Gross domestic product (GDP) is a monetary measure of the market value of all the final goods and services produced in a specific time period by a country or countries. GDP is more often used by the government of a single country to measure its economic health. Due to its complex and subjective nature, this measure is often revised before being considered a reliable indicator.

The Northern Territory is an Australian territory in the central and central northern regions of Australia. The Northern Territory shares its borders with Western Australia to the west, South Australia to the south, and Queensland to the east. To the north, the territory looks out to the Timor Sea, the Arafura Sea and the Gulf of Carpentaria, including Western New Guinea and other islands of the Indonesian archipelago.

New South Wales is a state on the east coast of Australia. It borders Queensland to the north, Victoria to the south, and South Australia to the west. Its coast borders the Coral and Tasman Seas to the east. The Australian Capital Territory and Jervis Bay Territory are enclaves within the state. New South Wales' state capital is Sydney, which is also Australia's most populous city. In December 2023, the population of New South Wales was over 8.3 million, making it Australia's most populous state. Almost two-thirds of the state's population, 5.3 million, live in the Greater Sydney area.

South Australia is a state in the southern central part of Australia. It covers some of the most arid parts of the country. With a total land area of 984,321 square kilometres (380,048 sq mi), it is the fourth-largest of Australia's states and territories by area, and second smallest state by population. It has a total of 1.8 million people. Its population is the second most highly centralised in Australia, after Western Australia, with more than 77 percent of South Australians living in the capital Adelaide, or its environs. Other population centres in the state are relatively small; Mount Gambier, the second-largest centre, has a population of 26,878.

Western Australia is a state of Australia occupying the western third of the land area of Australia, excluding external territories. It is bounded by the Indian Ocean to the north and west, the Southern Ocean to the south, the Northern Territory to the north-east, and South Australia to the south-east. Western Australia is Australia's largest state, with a total land area of 2,527,013 square kilometres (975,685 sq mi). It is the second-largest country subdivision in the world, surpassed only by Russia's Sakha Republic. As of 2021, the state has 2.76 million inhabitants—11 percent of the national total. The vast majority live in the south-west corner; 79 percent of the population lives in the Perth area, leaving the remainder of the state sparsely populated.
A variety of measures of national income and output are used in economics to estimate total economic activity in a country or region, including gross domestic product (GDP), gross national product (GNP), net national income (NNI), and adjusted national income. All are specially concerned with counting the total amount of goods and services produced within the economy and by various sectors. The boundary is usually defined by geography or citizenship, and it is also defined as the total income of the nation and also restrict the goods and services that are counted. For instance, some measures count only goods & services that are exchanged for money, excluding bartered goods, while other measures may attempt to include bartered goods by imputing monetary values to them.

Australia is a highly developed country with a mixed economy. As of 2023, Australia was the 14th-largest national economy by nominal GDP, the 19th-largest by PPP-adjusted GDP, and was the 21st-largest goods exporter and 24th-largest goods importer. Australia took the record for the longest run of uninterrupted GDP growth in the developed world with the March 2017 financial quarter. It was the 103rd quarter and the 26th year since the country had a technical recession. As of June 2021, the country's GDP was estimated at $1.98 trillion.
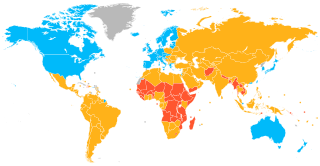
A developed country, or high-income country, is a sovereign state that has a high quality of life, developed economy, and advanced technological infrastructure relative to other less industrialized nations. Most commonly, the criteria for evaluating the degree of economic development are the gross domestic product (GDP), gross national product (GNP), the per capita income, level of industrialization, amount of widespread infrastructure and general standard of living. Which criteria are to be used and which countries can be classified as being developed are subjects of debate. Different definitions of developed countries are provided by the International Monetary Fund and the World Bank; moreover, HDI ranking is used to reflect the composite index of life expectancy, education, and income per capita. Another commonly used measure of a developed country is the threshold of GDP (PPP) per capita of at least US$22,000. In 2023, 40 countries fit all four criteria, while an additional 15 countries fit three out of four.

The Bureau of Economic Analysis (BEA) of the United States Department of Commerce is a U.S. government agency that provides official macroeconomic and industry statistics, most notably reports about the gross domestic product (GDP) of the United States and its various units—states, cities/towns/townships/villages/counties, and metropolitan areas. They also provide information about personal income, corporate profits, and government spending in their National Income and Product Accounts (NIPAs).

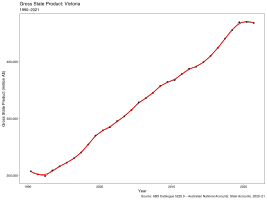
Victoria is a state in southeastern Australia. It is the second-smallest state, with a land area of 227,444 km2 (87,817 sq mi); the second-most-populated state, with a population of over 6.7 million; and the most densely populated state in Australia. Victoria is bordered by New South Wales to the north and South Australia to the west and is bounded by the Bass Strait to the south, the Great Australian Bight portion of the Southern Ocean to the southwest, and the Tasman Sea to the southeast. The state encompasses a range of climates and geographical features from its temperate coastal and central regions to the Victorian Alps in the northeast and the semi-arid northwest.

The Western Australian economy is a state economy dominated by its resources and services sector and largely driven by the export of iron-ore, gold, liquefied natural gas and agricultural commodities such as wheat. Covering an area of 2.5 million km2, the state is Australia's largest, accounting for almost one-third of the continent. Western Australia is the nation's fourth most populous state, with 2.6 million inhabitants.
This is a table of the total federal tax revenue by state, federal district, and territory collected by the U.S. Internal Revenue Service.

The economy of Oklahoma is the 29th largest in the United States. Oklahoma's gross state product (GSP) is approximately $197.2 billion as of December 2018.
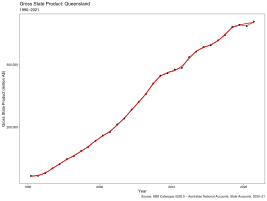
The economy of Queensland is the third largest economy within Australia. Queensland generated 19.5% of Australia's gross domestic product in the 2008-09 financial year. The economy is primarily built upon mining, agriculture, tourism and financial services. Queensland's main exports are coal, metals, meat and sugar.

The economy of the Australian Capital Territory (ACT) is the fastest-growing, sixth biggest economy of Australia as of the end of the 2017-18 financial year. Since the introduction of its self-government status in 1989, and with few exceptions in 1992, 1996, and 2014, the ACT economy has exhibited positive growth at a 1991-2018 average of 3.17 percent per year. A vast majority of the economy is concentrated in Canberra, the capital city of Australia, and is composed primarily (about 75%) by service industries, particularly those related to the administration of federal and local government. Construction also contributes to an important part of the economy, boosted by large government-funded projects and an active residential market. In contrast to other Australian states and territories, primary sectors such as agriculture, forestry, and mining, represent a very small proportion of the economy (±1%). A negative balance of trade has characterised the ACT economy since 2012-13, with small goods trade and a growing service export industry comprised mainly by education and public administration services.