List of Canadian provinces and territories by life expectancy

Last updated

This is a list of Canadian provinces and territories by life expectancy . Life expectancy is the average number of years of age that a group of infants born in the same year can expect to live, if maintained, from birth. The source is from the Canadian Vital Statistics Death Database. [1]

Contents

Life expectancy has increased in most Canadian provinces and territories due to medical advances in treating diseases such as heart disease and cancer - leading causes of death elsewhere worldwide. There were high gains in life expectancy in Nunavut due to improved rural health care; however, there were notable decreases in life expectancy in Newfoundland and Labrador.

Life expectancy in 2022 at birth

province 20192019
→2021
20212021
→2022
20222019
→2022
overallmalefemaleF Δ MoverallmalefemaleF Δ MoverallmalefemaleF Δ M
Canada on average82.2980.1884.374.19−0.6681.6379.2784.024.75−0.2981.3479.1283.584.46−0.95
Quebec 82.9481.0784.783.710.2183.1581.2984.993.70−0.6782.4880.7884.163.38−0.46
British Columbia 82.8180.6285.044.42−1.4081.4178.6784.265.590.0581.4678.7584.305.55−1.35
Ontario 82.5980.4384.724.29−0.6181.9879.6084.354.75−0.1681.8279.5784.074.50−0.77
Alberta 81.9779.8684.104.24−1.7080.2777.6183.165.55−0.0580.2277.9182.644.73−1.75
New Brunswick 80.7678.4983.064.570.1480.9078.7982.894.10−1.1479.7677.7781.804.03−1.00
Saskatchewan 80.5278.2483.014.77−2.0478.4876.0581.085.030.0178.4976.1381.044.91−2.03
Nova Scotia 80.4278.4682.283.820.0080.4278.0782.794.72−0.7079.7277.4781.964.49−0.70
Manitoba 80.1778.1082.414.31−0.3879.7977.3482.455.11−0.6579.1476.7381.714.98−1.03
Newfoundland and Labrador 80.0178.0682.033.97−0.6979.3277.2681.344.08−0.5678.7676.9580.573.62−1.25

Data source: Statistics Canada [2] .

3-year average:

Life expectancy in Canada in 2020-2022 Life expectancy map of Canada 2020-2022 with names.png
Life expectancy in Canada in 2020-2022
Life expectancy in Canada in 2017-2019 Life expectancy map of Canada 2017-2019 with names.png
Life expectancy in Canada in 2017-2019
Life expectancy in Canada in 2018-2020, 3-year average. The legend is identical to the one given in the health region map below. Life expectancy Canada 3-year average 2018-2020.svg
Life expectancy in Canada in 2018-2020, 3-year average. The legend is identical to the one given in the health region map below.
Life expectancy in Canada in 2015-2017, 3-year average, by health regions. Life expectancy Canada 3-year average 2015-2017 by health regions.png
Life expectancy in Canada in 2015-2017, 3-year average, by health regions.
Development of life expectancy in Canada according to estimation of the World Bank Group Life expectancy by WBG -Canada.png
Development of life expectancy in Canada according to estimation of the World Bank Group
Life expectancy with calculated gender gap Life expectancy by WBG -Canada -diff.png
Life expectancy with calculated gender gap
Life expectancy in Canada according to estimation of the Our World in Data Life expectancy in Canada.svg
Life expectancy in Canada according to estimation of the Our World in Data
Life expectancy in Canada and the US Life expectancy in USA and Canada.svg
Life expectancy in Canada and the US
Development of life expectancy in Canada in comparison to other big countries of North America Life expectancy in countries of North America.png
Development of life expectancy in Canada in comparison to other big countries of North America
Life Expectancy in Canada 1921-2018 ChartGo (18).png
Life Expectancy in Canada 1921-2018
Life expectancy and healthy life expectancy in Canada on the background of other countries of the world in 2019 Healthy life expectancy bar chart -world.png
Life expectancy and healthy life expectancy in Canada on the background of other countries of the world in 2019
Life expectancy and healthy life expectancy for males and females Healthy life expectancy bar chart -world -sex.png
Life expectancy and healthy life expectancy for males and females
province
or territory
2017-2019change2020-2022
overallmalefemaleF Δ MoverallmalefemaleF Δ M
Canada on average82.0379.9184.134.22−0.4881.5579.2883.844.56
Quebec 82.6380.7884.393.610.0082.6380.8684.373.51
Ontario 82.4180.2884.484.20−0.4481.9779.6684.254.59
British Columbia 82.3679.9984.804.81−0.7081.6678.9384.505.57
Alberta 81.6379.3683.964.60−1.1680.4777.9883.095.11
Prince Edward Island 81.5879.4983.604.110.0781.6579.4483.794.35
New Brunswick 80.7178.5582.834.28−0.1780.5478.4682.644.18
Nova Scotia 80.3978.3182.424.11−0.1580.2478.0182.514.50
Saskatchewan 80.3178.0382.734.70−1.4878.8376.3581.475.12
Manitoba 80.0477.8982.234.34−0.6079.4477.0581.954.90
Newfoundland and Labrador 79.9377.9681.903.94−0.7179.2277.3581.223.87
Northwest Territories 77.3775.6179.113.50−1.9975.3873.1877.624.44
Nunavut 70.5568.7172.353.641.1271.6768.8674.355.49

Data source: Statistics Canada [1] [3] . There are no data for Yukon for given periods. In 2014-2016 overall life expectancy in this territory was 78.68 years (75.92 for male and 81.47 for female).

Life expectancy by health region, 2015-2017 3-year averages

Health RegionProvinceLife Expectancy [4] Male [4] Female [4]
EasternFlag of Newfoundland and Labrador.svg  Newfoundland and Labrador 79.777.681.8
CentralFlag of Newfoundland and Labrador.svg  Newfoundland and Labrador 79.577.781.3
WesternFlag of Newfoundland and Labrador.svg  Newfoundland and Labrador 79.57880.8
Labrador-GrenfellFlag of Newfoundland and Labrador.svg  Newfoundland and Labrador 77.975.780.3
Prince Edward IslandFlag of Prince Edward Island.svg  Prince Edward Island 82.079.983.8
WesternFlag of Nova Scotia.svg  Nova Scotia 80.978.683.1
NorthernFlag of Nova Scotia.svg  Nova Scotia 79.577.681.5
EasternFlag of Nova Scotia.svg  Nova Scotia 78.575.681.4
CentralFlag of Nova Scotia.svg  Nova Scotia 81.279.283.1
MonctonFlag of New Brunswick.svg  New Brunswick 81.779.484
Saint JohnFlag of New Brunswick.svg  New Brunswick 80.17882.1
FrederictonFlag of New Brunswick.svg  New Brunswick 80.979.182.6
EdmundstonFlag of New Brunswick.svg  New Brunswick 79.877.581.8
CampbelltonFlag of New Brunswick.svg  New Brunswick 79.476.582
BathurstFlag of New Brunswick.svg  New Brunswick 81.479.283.6
MiramichiFlag of New Brunswick.svg  New Brunswick 79.576.282.6
Bas-Saint-LaurentFlag of Quebec.svg  Quebec 82.280.184
Saguenay - Lac-Saint-JeanFlag of Quebec.svg  Quebec 82.580.984
Capitale-NationaleFlag of Quebec.svg  Quebec 83.381.484.9
Mauricie et du Centre-du-QuébecFlag of Quebec.svg  Quebec 82.380.184.3
EstrieFlag of Quebec.svg  Quebec 83.181.184.9
MontréalFlag of Quebec.svg  Quebec 83.18185.1
OutaouaisFlag of Quebec.svg  Quebec 81.579.783.2
Abitibi-TémiscamingueFlag of Quebec.svg  Quebec 80.478.582.3
Côte-NordFlag of Quebec.svg  Quebec 81.179.882.4
Nord-du-QuébecFlag of Quebec.svg  Quebec 80.679.381.4
Gaspésie - Îles-de-la-MadeleineFlag of Quebec.svg  Quebec 80.878.782.8
Chaudière-AppalachesFlag of Quebec.svg  Quebec 83.381.485.1
Laval Flag of Quebec.svg  Quebec 83.981.985.6
LanaudièreFlag of Quebec.svg  Quebec 82.180.683.6
LaurentidesFlag of Quebec.svg  Quebec 82.180.583.7
MontérégieFlag of Quebec.svg  Quebec 82.88184.4
NunavikFlag of Quebec.svg  Quebec 68.765.673
Terres-Cries-de-la-Baie-JamesFlag of Quebec.svg  Quebec 77.275.478.7
AlgomaFlag of Ontario.svg  Ontario 79.477.281.6
BrantFlag of Ontario.svg  Ontario 80.278.182.2
DurhamFlag of Ontario.svg  Ontario 82.580.684.4
Grey BruceFlag of Ontario.svg  Ontario 81.679.583.8
Haldimand-NorfolkFlag of Ontario.svg  Ontario 80.278.382.1
Haliburton, Kawartha, Pine RidgeFlag of Ontario.svg  Ontario 81.279.383.2
Halton Flag of Ontario.svg  Ontario 84.582.686.2
HamiltonFlag of Ontario.svg  Ontario 81.378.883.6
Hastings and Prince EdwardFlag of Ontario.svg  Ontario 80.177.882.4
HuronFlag of Ontario.svg  Ontario 80.778.582.7
Chatham-KentFlag of Ontario.svg  Ontario 80.478.182.4
Kingston, Frontenac and Lennox and AddingtonFlag of Ontario.svg  Ontario 81.579.183.8
LambtonFlag of Ontario.svg  Ontario 80.578.382.7
Leeds, Grenville and LanarkFlag of Ontario.svg  Ontario 81.379.483
Middlesex-LondonFlag of Ontario.svg  Ontario 82.079.984
NiagaraFlag of Ontario.svg  Ontario 81.479.283.5
North Bay Parry SoundFlag of Ontario.svg  Ontario 80.378.282.4
NorthwesternFlag of Ontario.svg  Ontario 76.674.778.6
Ottawa Flag of Ontario.svg  Ontario 83.781.985.3
Oxford Elgin St. ThomasFlag of Ontario.svg  Ontario 80.878.982.6
Peel Flag of Ontario.svg  Ontario 84.88386.4
PerthFlag of Ontario.svg  Ontario 81.779.783.5
PeterboroughFlag of Ontario.svg  Ontario 81.579.383.5
PorcupineFlag of Ontario.svg  Ontario 78.376.180.5
RenfrewFlag of Ontario.svg  Ontario 81.179.283
EasternFlag of Ontario.svg  Ontario 81.279.183.2
Simcoe MuskokaFlag of Ontario.svg  Ontario 81.679.783.4
SudburyFlag of Ontario.svg  Ontario 79.876.982.7
Thunder BayFlag of Ontario.svg  Ontario 78.976.881.1
TimiskamingFlag of Ontario.svg  Ontario 79.376.981.7
WaterlooFlag of Ontario.svg  Ontario 82.180.283.9
Wellington-Dufferin-GuelphFlag of Ontario.svg  Ontario 82.380.583.9
Windsor-EssexFlag of Ontario.svg  Ontario 81.779.783.7
York Flag of Ontario.svg  Ontario 85.78487.1
Toronto Flag of Ontario.svg  Ontario 84.381.786.7
WinnipegFlag of Manitoba.svg  Manitoba 80.878.682.8
Prairie MountainFlag of Manitoba.svg  Manitoba 80.07882.1
Interlake-EasternFlag of Manitoba.svg  Manitoba 80.378.682.2
NorthernFlag of Manitoba.svg  Manitoba 72.770.375.2
SouthernFlag of Manitoba.svg  Manitoba 81.079.183.1
Sun CountryFlag of Saskatchewan.svg  Saskatchewan 81.579.783.2
Five HillsFlag of Saskatchewan.svg  Saskatchewan 81.378.484
CypressFlag of Saskatchewan.svg  Saskatchewan 81.479.383.5
Regina Qu'AppelleFlag of Saskatchewan.svg  Saskatchewan 80.578.282.8
SunriseFlag of Saskatchewan.svg  Saskatchewan 79.576.782.4
SaskatoonFlag of Saskatchewan.svg  Saskatchewan 81.379.183.4
HeartlandFlag of Saskatchewan.svg  Saskatchewan 80.978.283.7
Kelsey TrailFlag of Saskatchewan.svg  Saskatchewan 78.876.481.4
Prince Albert ParklandFlag of Saskatchewan.svg  Saskatchewan 78.375.481.6
Prairie NorthFlag of Saskatchewan.svg  Saskatchewan 78.876.181.7
Mamawetan/Keewatin/AthabascaFlag of Saskatchewan.svg  Saskatchewan 73.37175.8
SouthFlag of Alberta.svg  Alberta 80.378.182.4
CalgaryFlag of Alberta.svg  Alberta 83.181.285
CentralFlag of Alberta.svg  Alberta 79.977.482.6
EdmontonFlag of Alberta.svg  Alberta 8279.584.5
NorthFlag of Alberta.svg  Alberta 79.277.181.7
East KootenayFlag of British Columbia.svg  British Columbia 80.578.582.7
Kootenay-BoundaryFlag of British Columbia.svg  British Columbia 80.477.982.8
OkanaganFlag of British Columbia.svg  British Columbia 81.278.783.8
Thompson/CaribooFlag of British Columbia.svg  British Columbia 79.977.882.3
Fraser EastFlag of British Columbia.svg  British Columbia 81.278.783.7
Fraser NorthFlag of British Columbia.svg  British Columbia 83.681.685.6
Fraser SouthFlag of British Columbia.svg  British Columbia 82.880.685
Richmond Flag of British Columbia.svg  British Columbia 86.885.288.2
Vancouver Flag of British Columbia.svg  British Columbia 84.181.686.6
North Shore/Coast Garibaldi Flag of British Columbia.svg  British Columbia 83.981.686.2
South Vancouver IslandFlag of British Columbia.svg  British Columbia 83.381.185.3
Central Vancouver IslandFlag of British Columbia.svg  British Columbia 81.379.283.3
North Vancouver IslandFlag of British Columbia.svg  British Columbia 8178.683.5
NorthwestFlag of British Columbia.svg  British Columbia 79.176.981.7
Northern InteriorFlag of British Columbia.svg  British Columbia 78.876.981
NortheastFlag of British Columbia.svg  British Columbia 7876.479.6
Yukon [lower-alpha 1] Flag of Yukon.svg  Yukon 78.775.981.5
Northwest TerritoriesFlag of the Northwest Territories.svg  Northwest Territories 77.175.279.3
NunavutFlag of Nunavut.svg  Nunavut 72.170.873.4

Life expectancy in 2020 at birth

RankProvince/TerritoryLife expectancy

(2020) [2]

3-year average (2018-2020) [1] [3] [lower-alpha 1] 3-year average (2008-2010) [1] [3] Change
AllMaleFemale
1.Flag of Quebec.svg  Quebec 82.3482.5780.7784.3181.24Increase2.svg 1.27
2.Flag of British Columbia.svg  British Columbia 82.1982.3979.9384.9381.82Increase2.svg 0.57
3.Flag of Ontario.svg  Ontario 82.1482.3480.1684.4781.53Increase2.svg 0.81
-Flag of Canada (Pantone).svg  Canada 81.7281.9779.8284.1181.15Increase2.svg 0.82
4.Flag of Prince Edward Island.svg  Prince Edward Island 81.8079.8083.7280.44Increase2.svg 1.36
5.Flag of Alberta.svg  Alberta 80.8981.4679.1583.8580.81Increase2.svg 0.65
6.Flag of New Brunswick.svg  New Brunswick 81.1780.8478.7082.9180.34Increase2.svg 0.50
7.Flag of Nova Scotia.svg  Nova Scotia 80.5880.4678.3782.5580.17Increase2.svg 0.29
8.Flag of Saskatchewan.svg  Saskatchewan 79.4680.0677.6982.5679.51Increase2.svg 0.55
9.Flag of Newfoundland and Labrador.svg  Newfoundland and Labrador 79.6679.8977.9381.8779.28Increase2.svg 0.61
10.Flag of Manitoba.svg  Manitoba 79.4179.8877.7382.1279.64Increase2.svg 0.24
11.Flag of Yukon.svg  Yukon [lower-alpha 1] 78.6875.9281.4777.25Increase2.svg 1.43
12.Flag of the Northwest Territories.svg  Northwest Territories 77.0075.1078.8876.77Increase2.svg 0.23
13.Flag of Nunavut.svg  Nunavut 70.7468.1872.6971.53Decrease2.svg 0.79

Past life expectancy

Province/Territory2019 [10] 2010 [10] 2000 [10] 1990 [10] 1980 [10] Change 1980-2019
Flag of Canada (Pantone).svg  Canada 82.181.279.077.675.5Increase2.svg 6.6
Flag of Alberta.svg  Alberta 81.681.379.477.875.0Increase2.svg 6.6
Flag of British Columbia.svg  British Columbia 82.482.180.378.176.0Increase2.svg 6.4
Flag of Manitoba.svg  Manitoba 80.179.978.077.475.3Increase2.svg 4.8
Flag of New Brunswick.svg  New Brunswick 80.780.778.977.374.5Increase2.svg 6.2
Flag of Newfoundland and Labrador.svg  Newfoundland and Labrador 80.079.677.376.174.8Increase2.svg 5.2
Flag of the Northwest Territories.svg  Northwest Territories 77.477.875.572.468.7Increase2.svg 8.7
Flag of Nova Scotia.svg  Nova Scotia 80.480.378.576.774.6Increase2.svg 5.8
Flag of Nunavut.svg  Nunavut 71.170.467.565.562.4Increase2.svg 8.7
Flag of Ontario.svg  Ontario 82.481.779.477.875.4Increase2.svg 7.0
Flag of Prince Edward Island.svg  Prince Edward Island 81.681.378.476.976.2Increase2.svg 5.4
Flag of Quebec.svg  Quebec 82.981.479.077.074.4Increase2.svg 8.5
Flag of Saskatchewan.svg  Saskatchewan 80.379.678.577.975.9Increase2.svg 4.4
Flag of Yukon.svg  Yukon 79.077.375.074.469.8Increase2.svg 9.2

See also

Notes

  1. 1 2 3 4 5 2014-2016 3-year average for Yukon

Related Research Articles

<span class="mw-page-title-main">Demographics of Canada</span>

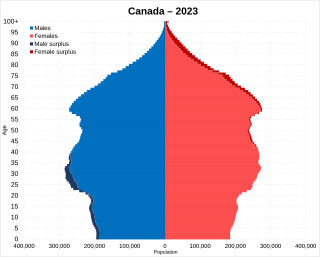
Statistics Canada conducts a country-wide census that collects demographic data every five years on the first and sixth year of each decade. The 2021 Canadian census enumerated a total population of 36,991,981, an increase of around 5.2 percent over the 2016 figure. It is estimated that Canada's population surpassed 40 million in 2023 and 41 million in 2024. Between 1990 and 2008, the population increased by 5.6 million, equivalent to 20.4 percent overall growth. The main driver of population growth is immigration. Between 2011 and May 2016, Canada's population grew by 1.7 million people, with immigrants accounting for two-thirds of the increase.

<span class="mw-page-title-main">Life expectancy</span> Measure of average lifespan in a given population

Human life expectancy is a statistical measure of the estimate of the average remaining years of life at a given age. The most commonly used measure is life expectancy at birth. This can be defined in two ways. Cohort LEB is the mean length of life of a birth cohort and can be computed only for cohorts born so long ago that all their members have died. Period LEB is the mean length of life of a hypothetical cohort assumed to be exposed, from birth through death, to the mortality rates observed at a given year. National LEB figures reported by national agencies and international organizations for human populations are estimates of period LEB.

<span class="mw-page-title-main">Demographics of the United States</span>

The United States had an official estimated resident population of 334,914,895 on July 1, 2023, according to the U.S. Census Bureau. This figure includes the 50 states and the District of Columbia but excludes the population of five unincorporated U.S. territories as well as several minor island possessions. The United States is the third most populous country in the world, and the most populous in the Americas and the Western Hemisphere. The Census Bureau showed a population increase of 0.4% for the twelve-month period ending in July 2022, below the world average annual rate of 0.9%. The total fertility rate in the United States estimated for 2022 is 1.665 children per woman, which is below the replacement fertility rate of approximately 2.1.

<span class="mw-page-title-main">Population of Canada by province and territory</span>

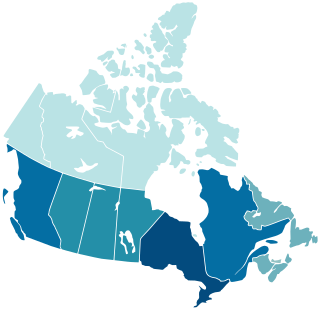
Canada is divided into 10 provinces and three territories. The majority of Canada's population is concentrated in the areas close to the Canada–US border. Its four largest provinces by area are also its most populous; together they account for 86.5 percent of the country's population. The territories account for over a third of Canada's area but are home to only 0.32 percent of its population, which skews the national population density value.

<span class="mw-page-title-main">Demographics of British Columbia</span>

British Columbia is a Canadian province with a population of about 5.6 million people. The province represents about 13.2% of the population of the Canadian population. Most of the population is between the ages of 15 and 49. About 60 percent of British Columbians have European descent with significant Asian and Aboriginal minorities. Just under 30% of British Columbians are immigrants. Over half of the population is irreligious, with Christianity and Sikhism being the most followed religions.

<span class="mw-page-title-main">Demographics of Ontario</span>

Ontario, one of the 13 provinces and territories of Canada, is located in east-central Canada. It is Canada's most populous province by a large margin, accounting for nearly 40 percent of all Canadians, and is the second-largest province in total area. Ontario is fourth-largest in total area when the territories of the Northwest Territories and Nunavut are included. It is home to the nation's capital city, Ottawa, and the nation's most populous city, Toronto.

<span class="mw-page-title-main">Demographics of Prince Edward Island</span>

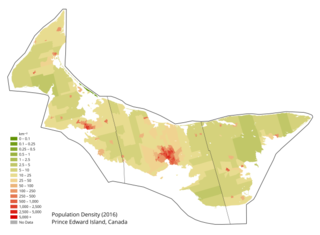
Prince Edward Island is a Canadian province. According to the 2011 National Household Survey, the largest ethnic group consists of people of Scottish descent (39.2%), followed by English (31.1%), Irish (30.4%), French (21.1%), German (5.2%), and Dutch (3.1%) descent. Prince Edward Island is mostly a white community and there are few visible minorities. Chinese people are the largest visible minority group of Prince Edward Island, comprising 1.3% of the province's population. Almost half of respondents identified their ethnicity as "Canadian." Prince Edward Island is by a strong margin the most Celtic and specifically the most Scottish province in Canada and perhaps the most Scottish place (ethnically) in the world, outside Scotland. 38% of islanders claim Scottish ancestry, but this is an underestimate and it is thought that almost 50% of islanders have Scottish roots. When combined with Irish and Welsh, almost 80% of islanders are of some Celtic stock, albeit most families have resided in PEI for at least two centuries. Few places outside Europe can claim such a homogeneous Celtic ethnic background. The only other jurisdiction in North America with such a high percentage of British Isles heritage is Newfoundland.

<span class="mw-page-title-main">2021 Canadian census</span> Detailed enumeration of Canadian residents in 2021

The 2021 Canadian census was a detailed enumeration of the Canadian population with a reference date of May 11, 2021. It follows the 2016 Canadian census, which recorded a population of 35,151,728. The overall response rate was 98%, which is slightly lower than the response rate for the 2016 census. It recorded a population of 36,991,981, a 5.2% increase from 2016. It will be succeeded by Canada's 2026 census.

References

  1. 1 2 3 4 5 6 7 "Life expectancy and other elements of the complete life table, three-year estimates, Canada, all provinces except Prince Edward Island". Statistics Canada . 27 November 2023. Retrieved 5 May 2024.
  2. 1 2 "Life expectancy and other elements of the complete life table, single-year estimates, Canada, all provinces except Prince Edward Island". Statistics Canada . 27 November 2023. Retrieved 5 May 2024.
  3. 1 2 3 4 5 6 "Life expectancy and other elements of the abridged life table, three-year estimates, Prince Edward Island and the territories". Statistics Canada . 27 November 2023. Retrieved 5 May 2024.
  4. 1 2 3 4 "Life expectancy, at birth and at age 65, by sex, three-year average, Canada, provinces, territories, health regions and peer groups". Statistics Canada . 30 May 2019.
  5. 1 2 3 "Life expectancy at birth, total - Canada". World Bank Group.
  6. "Life expectancy at birth: Canada". Our World in Data.
  7. "Life expectancy at birth: Canada, United States". Our World in Data.
  8. "Statistics Canada".
  9. 1 2 "Life expectancy and Healthy life expectancy, data by country". World Health Organization. 2020. Retrieved 22 January 2024.
  10. 1 2 3 4 5 "Canadian male and Female Life Expectancy By Province".