List of largest daily changes in the S&P 500 Index

Last updated

This is a list of the largest daily changes in the S&P 500 from 1923. Compare to the list of largest daily changes in the Dow Jones Industrial Average.

Contents

Largest percentage changes

While the S&P 500 was first introduced in 1923, it wasn't until 1957 when the stock market index was formally recognized, thus some of the following records may not be known by sources. [1]

Largest daily percentage gains [2]
Rank     Date   CloseNet Change % Change
11933-03-156.81+0.97+16.61
21929-10-3022.99+2.56+12.53
31931-10-069.91+1.09+12.36
41932-09-218.52+0.90+11.81
52008-10-131,003.35+104.13+11.58
62008-10-28940.51+91.59+10.79
71939-09-0512.64+1.11+9.63
81933-04-207.82+0.68+9.52
92020-03-242,447.33+209.93+9.38
102020-03-132,711.02+230.38+9.29
111987-10-21258.38+21.55+9.10
121929-11-1419.24+1.58+8.95
131932-08-036.39+0.52+8.86
141931-10-0810.62+0.84+8.59
151932-02-138.80+0.68+8.37
161931-12-188.36+0.64+8.29
171932-02-118.12+0.62+8.27
181933-07-2410.50+0.79+8.14
191932-06-104.92+0.35+7.66
201931-06-0313.12+0.92+7.54
Largest daily percentage losses [2]
Rank     Date   CloseNet Change % Change
1 1987-10-19 224.84−57.86−20.47
2 1929-10-28 22.74−3.20−12.34
3 2020-03-16 2,386.13−324.89−11.98
41929-10-2920.43−2.31−10.16
51929-11-0620.61−2.27−9.92
6 2020-03-12 2,480.64−260.74−9.51
71937-10-1810.76−1.10−9.27
8 2008-10-15 907.84−90.17−9.04
92008-12-01816.21−80.03−8.93
101933-07-2010.57−1.03−8.88
112008-09-291,106.39−106.62−8.79
121933-07-219.65−0.92−8.70
131987-10-26227.67−20.55−8.28
141932-10-057.39−0.66−8.20
151932-08-127.00−0.61−8.02
161932-05-314.47−0.38−7.84
171934-07-268.36−0.71−7.83
182008-10-09909.92−75.02−7.62
19 2020-03-09 2,746.56−225.81−7.60
201940-05-1410.28−0.83−7.47

Largest closing point changes

The two tables below show the largest one-day changes between a given day's close and the close of the previous trading day in terms of points. [3]

Largest daily point gains [2]
Rank     Date   CloseNet Change % Change
12020-03-132,711.02+230.38+9.29
22020-03-242,447.33+209.93+9.38
32022-11-103,955.94+207.80+5.54
42020-04-062,663.68+175.03+7.03
52020-03-262,630.07+154.51+6.24
62020-03-172,529.19+143.06+6.00
72020-03-023,090.23+136.01+4.60
82020-03-102,882.23+135.67+4.94
92020-03-043,130.12+126.75+4.22
102022-05-044,300.16+124.69+2.99
112022-11-304,080.11+122.48+3.09
122018-12-262,467.70+116.60+4.96
132022-06-243,911.74+116.01+3.06
142022-03-094,277.88+107.18+2.57
152022-07-193,936.69+105.84+2.76
162022-01-284,431.85+105.34+2.43
172024-02-225,087.03+105.23+2.11
182008-10-131,003.35+104.13+11.58
192022-04-284,287.50+103.54+2.47
202022-05-274,158.24+100.40+2.47
Largest daily point losses [2]
Rank     Date   CloseNet Change % Change
1 2020-03-16 2,386.13−324.89−11.98
2 2020-03-12 2,480.64−260.74−9.51
3 2020-03-09 2,746.56−225.81−7.60
42020-06-113,002.10−188.04−5.89
52022-09-133,932.69−177.72−4.32
62022-05-183,923.68−165.17−4.04
72022-04-294,131.93−155.57−3.63
82022-05-054,146.87−153.30−3.56
92022-06-133,749.63−151.23−3.88
102022-08-264,057.66−141.46−3.38
112020-03-112,741.38−140.85−4.89
122020-02-272,978.76−137.63−4.42
132022-05-093,991.24−132.10−3.20
142020-03-182,398.10−131.09−5.18
152022-03-074,201.09−127.78−2.95
162020-09-033,455.06−125.78−3.51
172022-06-163,666.77−123.22−3.25
182022-04-224,271.78−121.88−2.77
192022-04-264,175.20−120.92−2.81
202020-10-283,271.03−119.65−3.53

Largest intraday point swings

This table shows the largest intraday point swings since 1967.

RankDateCloseDay HighDay LowPoint SwingNet Change
12020-03-132,711.022,711.332,492.37218.96+230.38
22022-01-244,410.134,417.354,222.62194.73+12.19
32022-10-133,669.913,685.413,491.58193.83+92.88
42020-03-172,529.192,553.932,367.04186.89+143.06
5 2020-03-12 2,480.642,660.952,478.86182.09−260.74
62020-03-162,386.132,562.982,380.94182.04−324.89
72020-03-182,398.102,453.572,280.52173.05−131.09
82020-03-252,475.562,571.422,407.53163.89+28.23
92020-03-033,003.373,136.722,976.63160.09−86.86
102020-03-202,304.922,453.012,295.56157.45−104.34
112022-02-244,288.704,294.734,144.65150.08+63.20
122020-03-102,882.232,882.592,734.00148.59+135.67
132022-01-264,349.934,453.234,304.80148.43−6.52
142020-03-192,409.392,466.972,319.78147.19+11.29
152020-03-023,090.233,090.962,945.19145.77+136.01
162021-12-014,513.044,652.944,510.27142.67−53.96
172022-05-183,923.684,510.273,911.91140.07−165.17
182020-03-262,630.072,637.012,500.72136.29+154.51
192020-03-092,746.562,863.892,734.43129.46−225.81
202022-04-214,393.664,512.944,384.47128.47−65.79

Largest daily percentage changes each year

Largest daily percentage gains each year
YearDateClose % ChangeWeekday
2024*2024-02-225,086.95+2.11Thursday
20232023-01-063,895.08+2.28Friday
20222022-11-103,956.37+5.54Thursday
20212021-03-013,901.82+2.38Monday
2020 2020-03-24 2,447.33+9.38Tuesday
20192019-01-042,531.94+3.43Friday
20182018-12-262,467.70+4.96Wednesday
20172017-03-012,395.96+1.37Wednesday
20162016-01-291,940.24+2.48Friday
2015 2015-08-26 1,940.51+3.90Wednesday
20142014-12-182,061.23+2.40Thursday
20132013-01-021,462.42+2.54Wednesday
20122012-06-291,362.16+2.49Friday
2011 2011-08-09 1,172.53+4.74Tuesday
2010 2010-05-10 1,159.73+4.40Monday
2009 2009-03-23 822.92+7.08Monday
2008 2008-10-13 1,003.35+11.58Monday
20072007-09-181,519.78+2.92Tuesday
20062006-06-291,272.87+2.16Thursday
20052005-04-211,159.95+1.97Thursday
20042004-03-251,109.19+1.64Thursday
20032003-03-17862.79+3.54Monday
2002 2002-07-24 843.43+5.73Wednesday
2001 2001-01-03 1,347.56+5.01Wednesday
2000 2000-03-16 1,458.47+4.76Thursday
19991999-10-281,342.44+3.53Thursday
1998 1998-09-08 1,023.46+5.09Tuesday
1997 1997-10-28 921.85+5.12Tuesday
19961996-12-19745.76+1.94Thursday
19951995-05-31533.40+1.88Wednesday
19941994-04-05448.29+2.13Tuesday
19931993-03-08454.71+1.93Monday
19921992-04-09400.64+1.56Thursday
19911991-01-17327.97+3.73Thursday
19901990-08-27321.44+3.19Monday
1989 1989-10-16 342.85+2.76Monday
19881988-01-04255.94+3.59Monday
1987 1987-10-21 258.38+9.10Wednesday
19861986-03-11231.69+2.26Tuesday
19851985-01-21175.23+2.28Monday
19841984-08-03162.35+2.76Friday
19831983-07-20169.29+2.71Wednesday
1982 1982-08-17 109.04+4.76Tuesday
19811981-03-12133.19+2.49Thursday
19801980-04-22103.43+3.64Tuesday
19791979-09-20110.51+2.06Thursday
19781978-11-0196.85+3.97Wednesday
19771977-11-1094.71+1.86Thursday
19761976-01-0592.58+1.85Monday
19751975-01-2775.37+3.27Monday
19741974-10-0967.82+4.60Wednesday
19731973-12-2695.74+3.06Wednesday
19721972-09-27109.66+1.42Wednesday
19711971-08-1698.76+3.21Monday
1970 1970-05-27 72.77+5.02Wednesday
19691969-07-3191.83+2.11Thursday
19681968-04-0192.48+2.53Monday
19671967-06-0690.23+2.04Tuesday
19661966-10-1277.04+2.84Wednesday
19651965-06-3084.12+2.07Wednesday
19641964-05-0180.17+0.89Friday
19631963-11-2672.38+3.98Tuesday
1962 1962-05-29 58.08+4.65Tuesday
19611961-04-1768.68+3.48Monday
19601960-04-0656.51+2.06Wednesday
19591959-02-1955.50+2.21Thursday
19581958-11-2651.90+1.72Wednesday
19571957-10-2340.73+4.49Wednesday
19561956-09-1447.21+2.43Friday
19551955-07-0643.18+3.57Wednesday
19541954-12-1735.92+2.83Friday
19531953-09-2223.20+1.40Tuesday
19521952-05-0223.56+1.68Friday
19511951-07-0521.64+1.93Thursday
19501950-12-1819.85+2.69Monday
Largest daily percentage losses each year
YearDateClose % ChangeWeekday
2024*2024-01-314,845.65−1.61Wednesday
20232023-02-213,997.34−2.00Tuesday
20222022-09-133,932.69−4.32Tuesday
20212021-01-273,750.77−2.57Wednesday
2020 2020-03-16 2,386.13−11.98Monday
20192019-08-052,844.74−2.98Monday
20182018-02-052,648.94−4.10Monday
20172017-05-172,357.03−1.82Wednesday
2016 2016-06-24 2,037.41−3.59Friday
2015 2015-08-24 1,893.21−3.94Monday
20142014-02-031,741.89−2.28Monday
20132013-06-201,588.19−2.50Thursday
20122012-06-011,278.04−2.46Friday
2011 2011-08-08 1,119.46−6.66Monday
2010 2010-05-20 1,071.59−3.90Thursday
2009 2009-01-20 805.22−5.28Tuesday
2008 2008-10-15 907.84−9.03Wednesday
2007 2007-02-27 1,399.04−3.47Tuesday
20062006-01-201,261.49−1.83Friday
20052005-04-151,142.62−1.67Friday
20042004-08-051,080.70−1.63Thursday
20032003-03-24864.23−3.52Monday
2002 2002-09-03 878.02−4.15Tuesday
2001 2001-09-17 1,038.77−4.92Monday
2000 2000-04-14 1,356.56-5.83Friday
19991999-10-151,247.41−2.81Friday
1998 1998-08-31 957.28−6.80Monday
1997 1997-10-27 876.99−6.87Monday
19961996-03-08633.50−3.08Friday
19951995-12-18606.81−1.55Monday
19941994-02-04469.81−2.27Friday
19931993-02-16433.91−2.40Tuesday
19921992-04-07398.06−1.86Tuesday
19911991-11-15382.62−3.66Friday
19901990-08-06334.43−3.02Monday
1989 1989-10-13 333.65−6.12Friday
19881988-01-08243.40−6.77Friday
1987 1987-10-19 224.84−20.47Monday
19861986-09-11235.18−4.81Thursday
19851985-07-29189.60−1.46Monday
19841984-02-08155.85−1.82Wednesday
19831983-01-24139.97−2.70Monday
19821982-10-25133.32−3.97Monday
19811981-08-24125.50−2.89Monday
19801980-03-17102.26−3.01Monday
19791979-10-09106.63−2.96Tuesday
19781978-10-3193.15−2.01Tuesday
19771977-07-2798.64−1.63Wednesday
19761976-05-2499.44−1.80Monday
19751975-03-2481.42−2.36Monday
19741974-11-1869.27−3.67Monday
19731973-11-19100.71−3.05Monday
19721972-05-09104.74−1.32Tuesday
19711971-06-1898.97−1.52Friday
1970 1970-05-25 70.25−2.77Monday
19691969-07-2890.21−2.01Monday
19681968-03-1488.32−1.90Thursday
19671967-10-3193.30−1.57Tuesday
19661966-08-2974.53−2.46Monday
19651965-06-0287.09−1.84Wednesday
19641964-08-0481.96−1.25Tuesday
1963 1963-11-22 69.61−2.81Friday
1962 1962-05-28 55.50−6.68Monday
19611961-04-1866.20−3.61Tuesday
19601960-09-1953.86−2.27Monday
19591959-08-1058.62−2.09Monday
19581958-11-2551.02−1.94Tuesday
19571957-10-2139.15−2.93Monday
19561956-09-1346.09−2.04Thursday
1955 1955-09-26 42.61−6.62Monday
19541954-06-0828.34−2.24Tuesday
19531953-02-0925.69−3.09Monday
19521952-10-1524.06−1.72Wednesday
19511951-10-2222.75−2.44Monday
1950 1950-06-26 18.11−5.38Monday

* Year has not yet ended.

See also

Related Research Articles

<span class="mw-page-title-main">DAX</span> Blue chip stock market index

The DAX is a stock market index consisting of the 40 major German blue chip companies trading on the Frankfurt Stock Exchange. It is a total return index. Prices are taken from the Xetra trading venue. According to Deutsche Börse, the operator of Xetra, DAX measures the performance of the Prime Standard's 40 largest German companies in terms of order book volume and market capitalization. DAX is the equivalent of the UK FTSE 100 and the US Dow Jones Industrial Average, and because of its small company selection it does not necessarily represent the vitality of the German economy as a whole.

<span class="mw-page-title-main">Dow Jones Industrial Average</span> American stock market index composed of 30 industry leaders

The Dow Jones Industrial Average (DJIA), Dow Jones, or simply the Dow, is a stock market index of 30 prominent companies listed on stock exchanges in the United States.

<span class="mw-page-title-main">Stock market crash</span> Sudden widespread decline of stock prices

A stock market crash is a sudden dramatic decline of stock prices across a major cross-section of a stock market, resulting in a significant loss of paper wealth. Crashes are driven by panic selling and underlying economic factors. They often follow speculation and economic bubbles.

In 2001, stock prices took a sharp downturn in stock markets across the United States, Canada, Asia, and Europe. After recovering from lows reached following the September 11 attacks, indices slid steadily starting in March 2002, with dramatic declines in July and September leading to lows last reached in 1997 and 1998. The U.S. dollar increased in value relative to the euro, reaching a 1-to-1 valuation not seen since the euro's introduction.

<span class="mw-page-title-main">S&P 500</span> American stock market index

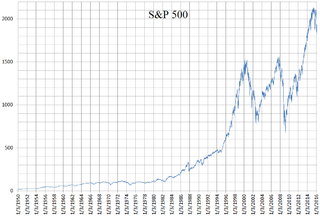
The Standard and Poor's 500, or simply the S&P 500, is a stock market index tracking the stock performance of 500 of the largest companies listed on stock exchanges in the United States. It is one of the most commonly followed equity indices and includes approximately 80% of the total market capitalization of U.S. public companies.

The Dow Jones Transportation Average is a U.S. stock market index from S&P Dow Jones Indices of the transportation sector, and is the most widely recognized gauge of the American transportation sector. It is the oldest stock index still in use, even older than its better-known relative, the Dow Jones Industrial Average (DJIA).

<span class="mw-page-title-main">BUX</span> Hungarian stock market index

BUX is a blue chip stock market index consisting up to 25 major Hungarian companies trading on the Budapest Stock Exchange. Prices are taken from the electronic Xetra trading system. According to the operator Budapest Stock Exchange, the BUX measures the performance of the Equities Prime Market's 12 to 25 largest Hungarian companies in terms of order book volume and market capitalization. It is the equivalent of the Dow Jones Industrial Average and DAX, the index shows the average price changing of the shares with the biggest market value and turnover in the equity section. Hereby this is the most important index number of the exchange trends.

This article is a summary of the closing milestones of the Dow Jones Industrial Average, a United States stock market index. Since first closing at 62.76 on February 16, 1885, the Dow Jones Industrial Average has increased, despite several periods of decline.

<span class="mw-page-title-main">Dow Jones Global Titans 50</span>

The Dow Jones Global Titans 50 Index is a float-adjusted index of 50 of the largest and best known blue chip companies traded on the New York Stock Exchange, American Stock Exchange, Nasdaq, Euronext, London Stock Exchange, and Tokyo Stock Exchange. The index represents the biggest and most liquid stocks traded in individual countries. It was created by Dow Jones Indexes to reflect the globalization of international blue chip securities in the wake of mergers and the creation of megacorporations.

<span class="mw-page-title-main">CME Group</span> American financial derivatives company

CME Group Inc. is a financial services company. Headquartered in Chicago, the company operates financial derivatives exchanges including the Chicago Mercantile Exchange, Chicago Board of Trade, New York Mercantile Exchange, and The Commodity Exchange. The company also owns 27% of S&P Dow Jones Indices. It is the world's largest operator of financial derivatives exchanges. Its exchanges are platforms for trading in agricultural products, currencies, energy, interest rates, metals, futures contracts, options, stock indexes, and cryptocurrencies futures.

The Nasdaq Composite is a stock market index that includes almost all stocks listed on the Nasdaq stock exchange. Along with the Dow Jones Industrial Average and S&P 500, it is one of the three most-followed stock market indices in the United States. The composition of the NASDAQ Composite is heavily weighted towards companies in the information technology sector. The Nasdaq-100, which includes 100 of the largest non-financial companies in the Nasdaq Composite, accounts for over 90% of the movement of the Nasdaq Composite.

The NYSE Composite (^NYA) is a stock market index covering all common stock listed on the New York Stock Exchange, including American depositary receipts, real estate investment trusts, tracking stocks, and foreign listings. It includes corporations in each of the ten industries listed in the Industry Classification Benchmark. It uses free-float market cap weighting.

SPDR funds are a family of exchange-traded funds (ETFs) traded in the United States, Europe, Mexico and Asia-Pacific and managed by State Street Global Advisors (SSGA). Informally, they are also known as Spyders or Spiders. SPDR is a trademark of Standard and Poor's Financial Services LLC, a subsidiary of S&P Global. The name is an acronym for the first member of the family, the Standard & Poor's Depositary Receipts, now the SPDR S&P 500 Trust ETF, which is designed to track the S&P 500 stock market index.

In finance and investing, Black Monday 2011 refers to August 8, 2011, when US and global stock markets crashed following the Friday night credit rating downgrade by Standard and Poor's of the United States sovereign debt from AAA, or "risk free", to AA+. It was the first time in history the United States was downgraded. Moody's issued a report during morning trading which said their AAA rating of U.S. credit was in jeopardy, this after issuing a negative outlook in the previous week.

This article is a summary of the closing milestones of the S&P 500 Index, a United States stock market index.

References

  1. "The Dow and the S&P 500: Where It All Began". us.spindices.com. Retrieved 2018-03-16.
  2. 1 2 3 4 "Sizzlers and Fizzlers". us.spindices.com. Retrieved 2018-03-16.
  3. S&P 500 Index Historical Prices