This is a list of the largest daily changes in the Dow Jones Industrial Average from 1896. Compare to the list of largest daily changes in the S&P 500 Index.
This is a list of the largest daily changes in the Dow Jones Industrial Average from 1896. Compare to the list of largest daily changes in the S&P 500 Index.
The first four tables show only the largest one-day changes between a given day's close and the close of the previous trading day, [1] [2] not the largest changes during the trading day (i.e. intraday changes).
Some sources (including the file Highlights/Lowlights of The Dow on the Dow Jones website) show a loss of −24.39% (from 71.42 to 54.00) on December 12, 1914, placing that day atop the list of largest percentage losses. The New York Stock Exchange reopened that day following a nearly four-and-a-half-month closure since July 30, 1914, and the Dow in fact rose 4.4% that day (from 71.42 to 74.56). However, the apparent decline was due to a later 1916 revision of the Dow Jones Industrial Average, which retroactively adjusted the values following the closure but not those before, and it represents the only discontinuity in the index's history rather than an actual loss. [3] [4]
Largest daily percentage gains [5]
| Largest daily percentage losses [5]
| ||||||||||||||||||||||||||||||||||||||||||||||||||||||||||||||||||||||||||||||||||||||||||||||||||||||||||||||||||||||||||||||||||||||||||||||||||||||||||||||||||||||||||||||||||||||||||||||||||||||||||||||||||||||
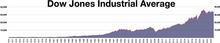
The Dow Jones Industrial Average was first published in 1896, but since the firms listed at that time were in existence before then, the index can be calculated going back to May 2, 1881. [6] A loss of just over 24 percent on May 5, 1893, from 39.90 to 30.02 signaled the apex of the stock effects of the Panic of 1893; the 2007–2008 crash was a 61.8 percent retracement thereof that began on October 11, 2007, and lasted until the closing low on March 9, 2009. [7]
The largest point drop in history occurred on March 16, 2020, when concerns over the ongoing COVID-19 pandemic engulfed the market, dropping the Dow Jones Industrial Average 2,997 points. The largest point gain (+2,113) occurred on March 24, 2020. As of August 4, 2020, all of the top seven and eight of the top ten largest point drops and point gains have been amid the 2020 stock market crash, which has been marked by extreme point swings. [8]
Largest daily point gains [5]
| Largest daily point losses [5]
| ||||||||||||||||||||||||||||||||||||||||||||||||||||||||||||||||||||||||||||||||||||||||||||||||||||||||||||||||||||||||||||||||||||||||||||||||||||||||||||||||||||||||||||||||||||||||||||||||||||||||||||||||||||||||||||||||||||||||||||||||||||||||||||||||
A point swing is the difference between the intraday high and the intraday low. (The intraday high may not be the same as the opening price; for instance, in the 2010 flash crash, the market reached an intraday high, higher than the opening price.) [49]
This is distinguished from an intraday point drop or gain, which is the difference between the opening price and the intraday low or high.
This table shows the largest intraday point swings since 1987. [50] As the "Net Change" column shows, 11 of these 20 largest intraday swings occurred during days on which the Dow declined, and 9 occurred during days on which it advanced. None of the top 20 occurred before the year 2018.
During the 2020 stock market crash, fourteen of the top seventeen positions occurred in the month of March 2020.
| Rank | Date | Close | Day high | Day low | Point swing | Net change |
|---|---|---|---|---|---|---|
| 1 | 2020-03-13 | 23,185.62 | 23,189.76 | 21,285.37 | 1,904.39 | +1,985.00 |
| 2 | 2020-03-12 | 21,200.62 | 22,837.95 | 21,154.46 | 1,683.49 | −2,352.60 |
| 3 | 2020-03-16 | 20,188.52 | 21,768.28 | 20,116.46 | 1,651.82 | −2,997.10 |
| 4 | 2018-02-05 | 24,345.75 | 25,520.53 | 23,923.88 | 1,596.65 | −1,175.21 |
| 5 | 2020-03-18 | 19,898.92 | 20,489.33 | 18,917.46 | 1,571.87 | −1,338.46 |
| 6 | 2022-10-13 | 30,038.72 | 30,168.54 | 28,660.94 | 1,507.60 | +827.87 |
| 7 | 2020-03-17 | 21,237.38 | 21,379.35 | 19,882.26 | 1,497.09 | +1,048.86 |
| 8 | 2020-03-25 | 21,200.55 | 22,019.93 | 20,538.34 | 1,481.59 | +495.64 |
| 9 | 2020-03-20 | 20,253.15 | 20,531.26 | 19,094.27 | 1,436.99 | −913.21 |
| 10 | 2020-03-03 | 25,917.41 | 27,084.59 | 25,706.28 | 1,378.31 | −785.91 |
| 11 | 2020-03-10 | 25,018.16 | 25,020.99 | 23,690.34 | 1,330.65 | +1,167.14 |
| 12 | 2020-03-02 | 26,703.32 | 26,706.17 | 25,391.96 | 1,314.21 | +1,293.96 |
| 13 | 2020-03-09 | 23,851.02 | 24,992.36 | 23,706.07 | 1,286.29 | −1,141.34 |
| 14 | 2020-03-11 | 23,553.22 | 24,604.63 | 23,328.32 | 1,276.31 | −1,464.94 |
| 15 | 2022-01-24 | 34,364.50 | 34,420.99 | 33,150.33 | 1,270.66 | +99.13 |
| 16 | 2020-03-19 | 20,087.19 | 20,442.63 | 19,177.13 | 1,265.50 | +188.27 |
| 17 | 2020-06-11 | 25,128.17 | 26,294.08 | 25,082.72 | 1,211.36 | −1,861.82 |
| 18 | 2020-03-26 | 22,552.17 | 22,595.06 | 21,427.10 | 1,167.96 | +1,351.62 |
| 19 | 2018-02-06 | 24,912.77 | 24,946.23 | 23,778.74 | 1,167.49 | +567.02 |
| 20 | 2018-12-26 | 22,878.45 | 22,878.92 | 21,712.53 | 1,166.39 | +1,086.25 |
| Largest intraday point gains An intraday point gain is defined as the difference between the opening price (which may or may not be the intraday low) and the intraday high. This is distinguished from a point swing, which is defined as the difference between the intraday high and the intraday low. Such records that turned negative are also recorded in a separate list. The opening price is used to calculate the point gain. The previous day close is used to calculate the net change.
| Largest intraday point drops An intraday point drop is defined as the difference between the opening price (which may or may not be the intraday high) and the intraday low. This is distinguished from a point swing, which is defined as the difference between the intraday high and the intraday low. Such records that turned positive are also recorded in a separate list. The opening price is used to calculate the point drop. The previous day close is used to calculate the net change.
|
| Largest intraday point gains that turned negative These are the largest intraday point gains that closed in negative territory at the end of the trading session. In order to be considered an intraday point gain, the intraday high must be above the previous day closing price, while the opening price is used to calculate intraday highs.
| Largest intraday point losses that turned positive These are the largest intraday point losses that closed in positive territory at the end of the trading session. In order to be considered an intraday point loss, the intraday low must be below the previous day closing price, while the opening price is used to calculate intraday lows.
|

The New York Stock Exchange is an American stock exchange in the Financial District of Lower Manhattan in New York City. It is the largest stock exchange in the world by market capitalization.

The Dow Jones Industrial Average (DJIA), Dow Jones, or simply the Dow, is a stock market index of 30 prominent companies listed on stock exchanges in the United States.

A stock market crash is a sudden dramatic decline of stock prices across a major cross-section of a stock market, resulting in a significant loss of paper wealth. Crashes are driven by panic selling and underlying economic factors. They often follow speculation and economic bubbles.
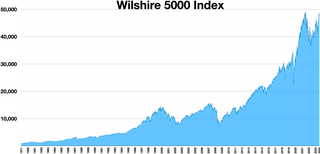
The Wilshire 5000 Total Market Index, or more simply the Wilshire 5000, is a market-capitalization-weighted index of the market value of all American stocks actively traded in the United States. As of December 31, 2023, the index contained 3,403 components. The index is intended to measure the performance of most publicly traded companies headquartered in the United States, with readily available price data. Hence, the index includes a majority of the common stocks and REITs traded primarily through New York Stock Exchange, NASDAQ, or the American Stock Exchange. Limited partnerships and ADRs are not included. It can be tracked by following the ticker ^FTW5000.

The Korea Composite Stock Price Index or KOSPI (Korean: 한국종합주가지수) is the index of all common stocks traded on the Stock Market Division—previously, Korea Stock Exchange—of the Korea Exchange. It is the representative stock market index of South Korea, analogous to the S&P 500 in the United States.
This article is a summary of the closing milestones of the Dow Jones Industrial Average, a United States stock market index. Since first closing at 62.76 on February 16, 1885, the Dow Jones Industrial Average has increased, despite several periods of decline.
The October 27, 1997, mini-crash is a global stock market crash that was caused by an economic crisis in Asia, the "Asian contagion", or Tom Yum Goong crisis. The point loss that the Dow Jones Industrial Average suffered on this day currently ranks as the 18th biggest percentage loss since the Dow's creation in 1896. This crash is considered a "mini-crash" because the percentage loss was relatively small compared to some other notable crashes. After the crash, the markets still remained positive for 1997, but the "mini-crash" may be considered as the beginning of the end of the 1990s economic boom in the United States and Canada, as both consumer confidence and economic growth were mildly reduced during the winter of 1997–1998, and when both returned to pre-October levels, they began to grow at an even slower pace than before the crash.
A trading curb is a financial regulatory instrument that is in place to prevent stock market crashes from occurring, and is implemented by the relevant stock exchange organization. Since their inception, circuit breakers have been modified to prevent both speculative gains and dramatic losses within a small time frame. When triggered, circuit breakers either stop trading for a small amount of time or close trading early in order to allow accurate information to flow among market makers and for institutional traders to assess their positions and make rational decisions.
The S&PMERVAL Index is the most important index of the Buenos Aires Stock Exchange. It is a price-weighted index, calculated as the market value of a portfolio of stocks selected based on their market share, number of transactions and quotation price. The base of MERVAL is set at 30 June 1986 = 0.01 Argentine pesos.
The Nasdaq Composite is a stock market index that includes almost all stocks listed on the Nasdaq stock exchange. Along with the Dow Jones Industrial Average and S&P 500, it is one of the three most-followed stock market indices in the United States. The composition of the NASDAQ Composite is heavily weighted towards companies in the information technology sector. The Nasdaq-100, which includes 100 of the largest non-financial companies in the Nasdaq Composite, accounts for over 90% of the movement of the Nasdaq Composite.
In modern finance, a flash crash is a very rapid, deep, and volatile fall in security prices occurring within a very short time period followed by a quick recovery. Flash crashes are frequently blamed by media on trades executed by black-box trading, combined with high-frequency trading, whose speed and interconnectedness can result in the loss and recovery of billions of dollars in a matter of minutes and seconds, but in reality occur because almost all participants have pulled their liquidity and temporarily paused their trading in the face of a sudden increase in risk.
The August 2011 stock markets fall was the sharp drop in stock prices in August 2011 in stock exchanges across the United States, Middle East, Europe and Asia. This was due to fears of contagion of the European sovereign debt crisis to Spain and Italy, as well as concerns over France's current AAA rating, concerns over the slow economic growth of the United States and its credit rating being downgraded. Severe volatility of stock market indexes continued for the rest of the year.
This article is a summary of the closing milestones of the S&P 500 Index, a United States stock market index.
The 2015–2016 stock market selloff was the period of decline in the value of stock prices globally that occurred between June 2015 to June 2016. It included the 2015–2016 Chinese stock market turbulence, in which the SSE Composite Index fell 43% in just over two months between June 2015 and August 2015, which culminated in the devaluation of the yuan. Investors sold shares globally as a result of slowing growth in the GDP of China, a fall in petroleum prices, the Greek debt default in June 2015, the effects of the end of quantitative easing in the United States in October 2014, a sharp rise in bond yields in early 2016, and finally, in June 2016, the 2016 United Kingdom European Union membership referendum, in which Brexit was voted upon.
Since the beginning of the Bombay stock exchange, stock markets in India, particularly the Bombay Stock Exchange and National Stock Exchange of India have seen a number of booms as well as crashes.
On 20 February 2020, stock markets across the world suddenly crashed after growing instability due to the COVID-19 pandemic. It ended on 7 April 2020.

Economic turmoil associated with the COVID-19 pandemic has had wide-ranging and severe impacts upon financial markets, including stock, bond, and commodity markets. Major events included a described Russia–Saudi Arabia oil price war, which after failing to reach an OPEC+ agreement resulted in a collapse of crude oil prices and a stock market crash in March 2020. The effects upon markets are part of the COVID-19 recession and are among the many economic impacts of the pandemic.
The COVID-19 recession, also known as the Great Lockdown, was a global economic recession caused by the COVID-19 pandemic. The recession began in most countries in February 2020. After a year of global economic slowdown that saw stagnation of economic growth and consumer activity, the COVID-19 lockdowns and other precautions taken in early 2020 drove the global economy into crisis. Within seven months, every advanced economy had fallen to recession.
The 2022 stock market decline was an economic event involving a decline in stock markets globally. The decline was the worst for American stock indices since 2008, ending three-years of gains.
{{cite web}}: CS1 maint: multiple names: authors list (link){{cite web}}: CS1 maint: multiple names: authors list (link){{cite web}}: CS1 maint: multiple names: authors list (link){{cite web}}: CS1 maint: multiple names: authors list (link){{cite web}}: CS1 maint: multiple names: authors list (link){{cite web}}: CS1 maint: multiple names: authors list (link){{cite web}}: CS1 maint: multiple names: authors list (link)