The dot-com bubble was a stock market bubble that ballooned during the late-1990s and peaked on Friday, March 10, 2000. This period of market growth coincided with the widespread adoption of the World Wide Web and the Internet, resulting in a dispensation of available venture capital and the rapid growth of valuations in new dot-com startups.

The New York Stock Exchange is an American stock exchange in the Financial District of Lower Manhattan in New York City. It is the largest stock exchange in the world by market capitalization.

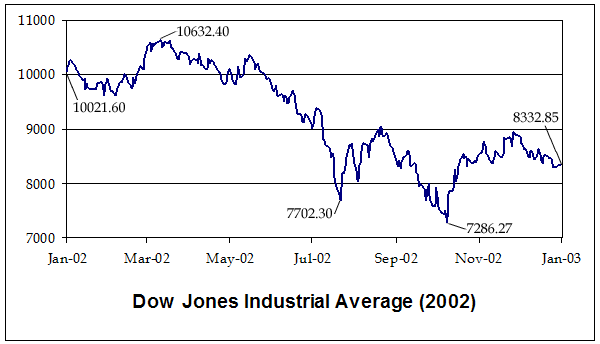
The Dow Jones Industrial Average (DJIA), Dow Jones, or simply the Dow, is a stock market index of 30 prominent companies listed on stock exchanges in the United States.

A stock market crash is a sudden dramatic decline of stock prices across a major cross-section of a stock market, resulting in a significant loss of paper wealth. Crashes are driven by panic selling and underlying economic factors. They often follow speculation and economic bubbles.
A market trend is a perceived tendency of the financial markets to move in a particular direction over time. Analysts classify these trends as secular for long time-frames, primary for medium time-frames, and secondary for short time-frames. Traders attempt to identify market trends using technical analysis, a framework which characterizes market trends as predictable price tendencies within the market when price reaches support and resistance levels, varying over time.

The Wall Street Crash of 1929, also known as the Great Crash or the Crash of '29, was a major American stock market crash that occurred in the autumn of 1929. It started in September, when share prices on the New York Stock Exchange (NYSE) collapsed, and ended in mid-November. The pivotal role of the 1920s' high-flying bull market and the subsequent catastrophic collapse of the NYSE in late 1929 is often highlighted in explanations of the causes of the worldwide Great Depression.
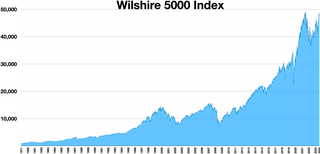
The Wilshire 5000 Total Market Index, or more simply the Wilshire 5000, is a market-capitalization-weighted index of the market value of all American stocks actively traded in the United States. As of September 30, 2023, the index contained 3,427 components. The index is intended to measure the performance of most publicly traded companies headquartered in the United States, with readily available price data. Hence, the index includes a majority of the common stocks and REITs traded primarily through New York Stock Exchange, NASDAQ, or the American Stock Exchange. Limited partnerships and ADRs are not included. It can be tracked by following the ticker ^W5000.
The Motley Fool is a private financial and investing advice company based in Alexandria, Virginia. It was founded in July 1993 by co-chairmen and brothers David Gardner and Tom Gardner, and Todd Etter and Erik Rydholm. The company employs over 300 people worldwide.
This article is a summary of the closing milestones of the Dow Jones Industrial Average, a United States stock market index. Since first closing at 62.76 on February 16, 1885, the Dow Jones Industrial Average has increased, despite several periods of decline.
The early 2000s recession was a decline in economic activity which mainly occurred in developed countries. The recession affected the European Union during 2000 and 2001 and the United States from March to November 2001. The UK, Canada and Australia avoided the recession, while Russia, a nation that did not experience prosperity during the 1990s, began to recover from it. Japan's 1990s recession continued.
The October 27, 1997, mini-crash is a global stock market crash that was caused by an economic crisis in Asia, the "Asian contagion", or Tom Yum Goong crisis. The point loss that the Dow Jones Industrial Average suffered on this day currently ranks as the 18th biggest percentage loss since the Dow's creation in 1896. This crash is considered a "mini-crash" because the percentage loss was relatively small compared to some other notable crashes. After the crash, the markets still remained positive for 1997, but the "mini-crash" may be considered as the beginning of the end of the 1990s economic boom in the United States and Canada, as both consumer confidence and economic growth were mildly reduced during the winter of 1997–1998, and when both returned to pre-October levels, they began to grow at an even slower pace than before the crash.
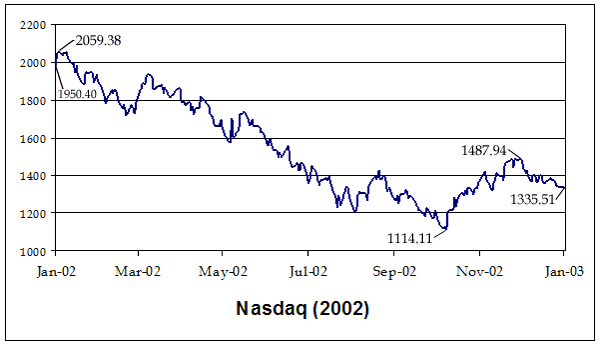
The Nasdaq Composite is a stock market index that includes almost all stocks listed on the Nasdaq stock exchange. Along with the Dow Jones Industrial Average and S&P 500, it is one of the three most-followed stock market indices in the United States. The composition of the NASDAQ Composite is heavily weighted towards companies in the information technology sector. The Nasdaq-100, which includes 100 of the largest non-financial companies in the Nasdaq Composite, accounts for over 90% of the movement of the Nasdaq Composite.
The NYSE Composite (^NYA) is a stock market index covering all common stock listed on the New York Stock Exchange, including American depositary receipts, real estate investment trusts, tracking stocks, and foreign listings. It includes corporations in each of the ten industries listed in the Industry Classification Benchmark. It uses free-float market cap weighting.
Dow 36,000: The New Strategy for Profiting From the Coming Rise in the Stock Market is a 1999 book by syndicated columnist James K. Glassman and economist Kevin A. Hassett, in which they argued that stocks in 1999 were significantly undervalued and concluded that there would be a fourfold market increase with the Dow Jones Industrial Average (DJIA) rising to 36,000 by 2002 or 2004. The bursting of the dot-com bubble of 2000, September 11 attacks in 2001, and the Financial crisis of 2007–2008 ensured that the titular target would not be attained within the author's suggested timeframe. It wasn't until 2021 when Dow 36,000 would be reached in actuality, 22 years after the book was published.
The 1973–1974 stock market crash caused a bear market between January 1973 and December 1974. Affecting all the major stock markets in the world, particularly the United Kingdom, it was one of the worst stock market downturns since the Great Depression, the other being the financial crisis of 2007–2008. The crash came after the collapse of the Bretton Woods system over the previous two years, with the associated 'Nixon Shock' and United States dollar devaluation under the Smithsonian Agreement. It was compounded by the outbreak of the 1973 oil crisis in October of that year. It was a major event of the 1970s recession.

The US bear market of 2007–2009 was a 17-month bear market that lasted from October 9, 2007 to March 9, 2009, during the financial crisis of 2007–2009. The S&P 500 lost approximately 50% of its value, but the duration of this bear market was just below average.
The 2015–2016 stock market selloff was the period of decline in the value of stock prices globally that occurred between June 2015 to June 2016. It included the 2015–2016 Chinese stock market turbulence, in which the SSE Composite Index fell 43% in just over two months between June 2015 and August 2015, which culminated in the devaluation of the yuan. Investors sold shares globally as a result of slowing growth in the GDP of China, a fall in petroleum prices, the Greek debt default in June 2015, the effects of the end of quantitative easing in the United States in October 2014, a sharp rise in bond yields in early 2016, and finally, in June 2016, the 2016 United Kingdom European Union membership referendum, in which Brexit was voted upon.
The Buffett indicator is a valuation multiple used to assess how expensive or cheap the aggregate stock market is at a given point in time. It was proposed as a metric by investor Warren Buffett in 2001, who called it "probably the best single measure of where valuations stand at any given moment", and its modern form compares the capitalization of the US Wilshire 5000 index to US GDP. It is widely followed by the financial media as a valuation measure for the US market in both its absolute, and de-trended forms.