2022 stock market decline

Last updated
Dow Jones Industrial Average Dow Jones Industrial Average.webp
Dow Jones Industrial Average
Nasdaq Composite Index NASDAQ Composite Index.webp
Nasdaq Composite Index
S&P 500 S & P 500.webp
S&P 500

The 2022 stock market decline was an economic event involving a decline in stock markets globally. The decline was the worst for American stock indices since 2008, ending three-years of gains. [1]

Contents

In February 2022, the Russian invasion of Ukraine caused a sell-off across many financial markets throughout the world.

The stock market decline has had a serious negative impact on economies throughout the world. In the United States, the S&P 500 stock market index peaked in January and began a gradual decline. In September, the S&P 500 would experience its largest drop since March 2020.

In the United States, the stock market decline was associated with a bear market which is considered to have begun on January 3, 2022, and to have ended on October 22, 2022; within months, the Dow Jones Industrial Average, the Nasdaq Composite, and the S&P 500 entered the bull market in November 2022, May 2023, and June 2023 respectively. [2] In Japan, the Nikkei 225 reached its highest level since 1990, in May 2023. [3]

Causes

The global financial instability in 2022 was a holdover from the COVID-19 pandemic, as investors attempted to determine the long-term effects of the pandemic on the global economy. [4] Global indices began to decline after January 2022. However, the Russian invasion of Ukraine escalated the decline as fears of energy disruption became apparent. [5]

Global markets were also impacted by fears of economic recession. On June 13, 2022, the MSCI ACWI index, which tracks stock prices from both emerging and developed markets, officially slipped into a bear market, falling 21% from a mid-November peak. [6]

Effects

Effects on the United States

The S&P 500 index peaked at 4,796 on its January 3 close and had since been on a downward trend for several months. In response to the inflation surge, the Federal Reserve rapidly raised interest rates which further led to a decline in investor confidence. Markets favor low interest rate environments because they are conducive to future growth: when interest rates are low, companies can increase spending, which leads to increased stock prices. As the United States gross domestic product shrank in the first quarter of 2022, fears of an economic recession contributed to the decline in equity prices. [7] The gross domestic product (GDP) decreased at an annual rate of 1.6 percent in the first quarter of 2022, according to the "third" estimate released by the Bureau of Economic Analysis. [8] By June 16, 2022, the S&P had fallen 23.55% from 4,796 to 3,666, though it was unknown if the index would plunge below the level. The DJIA fell 18.78% since its January 4 high, while the Nasdaq Composite fell 33.70% from its November 19 high. [9] [10]

On September 13, 2022, the S&P 500 experienced its largest single-day drop since June 2020. [11]

According to Morningstar, Inc., environmental, social, and corporate governance (ESG) investment funds in the United States saw capital inflows of $3.1 billion in 2022 while non-ESG investment funds saw capital outflows of $370 billion. [12]

Effects on China

Concerns over the economic effects of China's Zero-COVID strategy and its regulatory crackdown on companies like Ant Group have led to a decline in Chinese stock prices. In June 2022, the Alibaba Group's (NYSE: BABA) share price declined from a peak of over US$300 in mid-2020 to below US$100. [13]

Effects on emerging markets

Emerging markets were hit by the worst sell-off in decades. The JPMorgan EMBI Global Diversified delivered returns of -15% in 2022. During the same period, ETFs that provide exposure to emerging markets such as VWO, IEMG, and EEM are all down more than 15% since the start of 2022. [14]

Effects on cryptocurrency

As part of the global decline in most risky assets, the price of Bitcoin fell 59% during the same time period, and it declined 72% from its November 8th all-time high. The price of cryptocurrencies like the aforementioned Bitcoin and Ethereum plunged in June 2022 (the former of which suffered another decline) as investors moved their money out of risky assets. [15]

Related Research Articles

<span class="mw-page-title-main">Dow Jones Industrial Average</span> American stock market index composed of 30 industry leaders

The Dow Jones Industrial Average (DJIA), Dow Jones, or simply the Dow, is a stock market index of 30 prominent companies listed on stock exchanges in the United States.

<span class="mw-page-title-main">Stock market crash</span> Sudden widespread decline of stock prices

A stock market crash is a sudden dramatic decline of stock prices across a major cross-section of a stock market, resulting in a significant loss of paper wealth. Crashes are driven by panic selling and underlying economic factors. They often follow speculation and economic bubbles.

A market trend is a perceived tendency of the financial markets to move in a particular direction over time. Analysts classify these trends as secular for long time-frames, primary for medium time-frames, and secondary for short time-frames. Traders attempt to identify market trends using technical analysis, a framework which characterizes market trends as predictable price tendencies within the market when price reaches support and resistance levels, varying over time.

<span class="mw-page-title-main">S&P 500</span> American stock market index

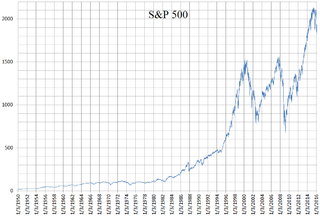
The Standard and Poor's 500, or simply the S&P 500, is a stock market index tracking the stock performance of 500 of the largest companies listed on stock exchanges in the United States. It is one of the most commonly followed equity indices and includes approximately 80% of the total market capitalization of U.S. public companies, with an aggregate market cap of more than $43 trillion as of January 2024.

An exchange-traded fund (ETF) is a type of investment fund that is also an exchange-traded product, i.e., it is traded on stock exchanges. ETFs own financial assets such as stocks, bonds, currencies, debts, futures contracts, and/or commodities such as gold bars. The list of assets that each ETF owns, as well as their weightings, is posted on the website of the issuer daily, or quarterly in the case of active non-transparent ETFs. Many ETFs provide some level of diversification compared to owning an individual stock.

<span class="mw-page-title-main">MSCI</span> American financial service provider

MSCI Inc. is an American finance company headquartered in New York City. MSCI is a global provider of equity, fixed income, real estate indices, multi-asset portfolio analysis tools, ESG and climate products. It operates the MSCI World, MSCI All Country World Index (ACWI) and MSCI Emerging Markets Indices among others.

The S&P 100 Index is a stock market index of United States stocks maintained by Standard & Poor's.

The Nasdaq Composite is a stock market index that includes almost all stocks listed on the Nasdaq stock exchange. Along with the Dow Jones Industrial Average and S&P 500, it is one of the three most-followed stock market indices in the United States. The composition of the NASDAQ Composite is heavily weighted towards companies in the information technology sector. The Nasdaq-100, which includes 100 of the largest non-financial companies in the Nasdaq Composite, accounts for over 90% of the movement of the Nasdaq Composite.

<span class="mw-page-title-main">United States bear market of 2007–2009</span> 17-month bear market

The US bear market of 2007–2009 was a 17-month bear market that lasted from October 9, 2007 to March 9, 2009, during the financial crisis of 2007–2009. The S&P 500 lost approximately 50% of its value, but the duration of this bear market was just below average.

<span class="mw-page-title-main">Stock market index</span> Financial metric which investors use to determine market performance

In finance, a stock index, or stock market index, is an index that measures the performance of a stock market, or of a subset of a stock market. It helps investors compare current stock price levels with past prices to calculate market performance.

The August 2011 stock markets fall was the sharp drop in stock prices in August 2011 in stock exchanges across the United States, Middle East, Europe and Asia. This was due to fears of contagion of the European sovereign debt crisis to Spain and Italy, as well as concerns over France's current AAA rating, concerns over the slow economic growth of the United States and its credit rating being downgraded. Severe volatility of stock market indexes continued for the rest of the year.

This article is a summary of the closing milestones of the S&P 500 Index, a United States stock market index.

The 2015–2016 stock market selloff was the period of decline in the value of stock prices globally that occurred between June 2015 to June 2016. It included the 2015–2016 Chinese stock market turbulence, in which the SSE Composite Index fell 43% in just over two months between June 2015 and August 2015, which culminated in the devaluation of the yuan. Investors sold shares globally as a result of slowing growth in the GDP of China, a fall in petroleum prices, the Greek debt default in June 2015, the effects of the end of quantitative easing in the United States in October 2014, a sharp rise in bond yields in early 2016, and finally, in June 2016, the 2016 United Kingdom European Union membership referendum, in which Brexit was voted upon.

Since the beginning of the Bombay stock exchange, stock markets in India, particularly the Bombay Stock Exchange and National Stock Exchange of India have seen a number of booms as well as crashes.

<span class="mw-page-title-main">2020 stock market crash</span> Financial market reaction to the COVID-19 pandemic

On 20 February 2020, stock markets across the world suddenly crashed after growing instability due to the COVID-19 pandemic. It ended on 7 April 2020.

<span class="mw-page-title-main">Financial market impact of the COVID-19 pandemic</span> Economic turmoil associated with the pandemic

Economic turmoil associated with the COVID-19 pandemic has had wide-ranging and severe impacts upon financial markets, including stock, bond, and commodity markets. Major events included a described Russia–Saudi Arabia oil price war, which after failing to reach an OPEC+ agreement resulted in a collapse of crude oil prices and a stock market crash in March 2020. The effects upon markets are part of the COVID-19 recession and are among the many economic impacts of the pandemic.

<span class="mw-page-title-main">COVID-19 recession</span> Economic downturn, primarily due to the COVID-19 pandemic

The COVID-19 recession, also known as the Great Lockdown, was a global economic recession caused by the COVID-19 pandemic. The recession began in most countries in February 2020. After a year of global economic slowdown that saw stagnation of economic growth and consumer activity, the COVID-19 lockdowns and other precautions taken in early 2020 drove the global economy into crisis. Within seven months, every advanced economy had fallen to recession.

<span class="mw-page-title-main">Everything bubble</span> 2020–2021 correlated bubble in assets

The expression "everything bubble" refers to the correlated impact of monetary easing by the Federal Reserve on asset prices in most asset classes, namely equities, housing, bonds, many commodities, and even exotic assets such as cryptocurrencies and SPACs. The policy itself and the techniques of direct and indirect methods of quantitative easing used to execute it are sometimes referred to as the Fed put. Modern monetary theory advocates the use of such tools, even in non-crisis periods, to create economic growth through asset price inflation. The term "everything bubble" first came in use during the chair of Janet Yellen, but it is most associated with the subsequent chair of Jerome Powell, and the 2020–2021 period of the coronavirus pandemic.

References

  1. Jesse Pound; Samantha Subin (December 30, 2022). "Stocks fall to end Wall Street's worst year since 2008, S&P 500 finishes 2022 down nearly 20%". CNBC.
  2. "The S&P 500 is in a bull market. Here's what that means and how long the bull might run". The Associated Press. June 8, 2023.
  3. "Japan's Nikkei hits 33-year high on weak yen, US optimism". Al Jazeera. May 29, 2023.
  4. Vega, Nicolas (2022-06-14). "Stocks have officially entered bear market territory—here's what that means and what you should do". CNBC. Retrieved 2022-06-29.
  5. Toews, Phillip (March 14, 2022). "Opinion: Ukraine War Likely Has Triggered Lasting Bear Market". Barrons. Retrieved 2022-06-29.
  6. Maki, Sydney (2022-06-13). "Global Stocks Dive Into Bear Market as Risk Appetite Evaporates". Bloomberg. Retrieved 2022-07-04.
  7. Simonetti, Isabella (2022-06-30). "After Worst Start in 50 Years, Some See More Pain Ahead for Stock Market". The New York Times. Retrieved 2022-06-30.
  8. "Gross Domestic Product (Third Estimate), GDP by Industry, and Corporate Profits (Revised), First Quarter 2022 | U.S. Bureau of Economic Analysis (BEA)". www.bea.gov. Retrieved 2022-07-03.
  9. Schnipper, Scott (2022-06-13). "The S&P 500 is now in an official bear market, according to S&P Dow Jones Indices". CNBC. Retrieved 2022-06-23.
  10. Gura, David (2022-06-13). "Stocks sink, sending the S&P 500 to a bear market". NPR. Retrieved 2022-06-23.
  11. Rennison, Joe (September 13, 2022). "Markets Plunge as Inflation Data Undercuts Wall Street's Optimism". The New York Times. Retrieved September 13, 2022.
  12. Shifflett, Shane (March 7, 2023). "Sustainable Funds Dodged Outflows in 2022 Market Rout". The Wall Street Journal. News Corp. Retrieved April 27, 2023.
  13. Calhoun, George. "Alibaba Update: It's Down 75%. Is It Still A Value Play?". Forbes. Retrieved 2022-06-23.
  14. Jonathan, Wheatley (28 May 2022). "Emerging Markets hit by worst sell-off in decades". Financial Times. Retrieved 2022-06-30.
  15. Vigna, Corrie Driebusch and Paul (2022-06-18). "The Crypto Party Is Over". Wall Street Journal. ISSN   0099-9660 . Retrieved 2022-06-23.