List of largest daily changes in the Nasdaq Composite

Last updated

This is a list of the largest daily changes in the Nasdaq Composite from 1971. [1]

Contents

Largest percentage changes

Largest daily percentage gains
Rank     Date   CloseNet Change % Change
12001-01-032,616.69+324.83+14.17
22008-10-131,844.25+194.74+11.81
32000-12-052,889.80+274.05+10.48
42008-10-281,649.47+143.57+9.53
52020-03-137,874.88+673.07+9.35
62001-04-051,785.00+146.20+8.92
7 (tie)2001-04-182,079.44+156.22+8.12
7 (tie)2020-03-247,417.86+557.18+8.12
92000-05-303,459.48+254.37+7.94
102000-10-133,316.77+242.09+7.87
112000-10-193,418.60+247.04+7.79
122002-05-081,696.29+122.47+7.78
132000-12-222,517.02+176.90+7.56
14 (tie)2022-11-1011,114.15+760.97+7.35
14 (tie)1987-10-21351.90+24.10+7.35
162020-04-067,913.24+540.15+7.33
172000-04-183,793.57+254.41+7.19
182009-03-101,358.28+89.64+7.07
192009-03-231,555.77+98.50+6.76
202000-04-253,711.23+228.75+6.57
Largest daily percentage losses
Rank     Date   CloseNet Change % Change
1 2020-03-16 6,904.59−970.28−12.32
2 1987-10-19 360.20−46.10−11.35
32000-04-143,321.29−355.49−9.67
4 2020-03-12 7,201.80−750.25−9.43
52008-09-291,983.73−199.61−9.14
61987-10-26298.90−29.60−9.01
71987-10-20327.80−32.40−9.00
82008-12-011,398.07−137.50−8.95
91998-08-311,499.25−140.43−8.56
102008-10-151,628.33−150.68−8.47
112000-04-034,223.68−349.15−7.64
12 2020-03-09 7,950.68−624.94−7.29
132001-01-022,291.86−178.66−7.23
142000-12-202,332.78−178.93−7.12
152000-04-123,769.63−286.27−7.06
161997-10-271,535.09−115.83−7.02
172011-08-082,357.69−174.72−6.90
182001-09-171,579.55−115.83−6.83
192008-11-191,386.42−96.85−6.53
202001-03-121,923.38−129.40−6.30

Largest point changes

Largest daily point gains
Rank     Date   CloseNet Change % Change
12022-11-1011,114.15+760.97+7.35
22020-03-137,874.88+673.07+9.35
32020-03-247,417.86+557.18+8.12
42020-04-067,913.24+540.15+7.33
52022-03-1613,436.55+487.93+3.77
62022-11-3011,468.00+484.22+4.41
72022-07-2712,032.42+469.85+4.06
82022-01-3114,239.88+469.31+3.41
92021-03-0913,073.82+464.66+3.69
102021-12-0715,686.92+461.76+3.03
112024-02-2216,041.62+460.75+2.96
122022-03-0913,255.55+459.99+3.59
132022-02-2413,473.59+436.10+3.34
142022-05-1311,805.00+434.04+3.82
152020-11-0411,590.78+430.21+3.85
162020-03-177,334.78+430.19+6.23
172022-01-2813,770.57+417.79+3.13
182020-03-267,797.54+413.24+5.60
192022-05-0412,964.86+401.10+3.19
202021-03-0113,588.83+396.48+3.01
Largest daily point losses
Rank     Date   CloseNet Change % Change
1 2020-03-16 6,904.59−970.28−12.32
2 2020-03-12 7,201.80−750.25−9.43
32022-05-0512,317.69−647.16−4.99
42022-09-1311,633.57−632.84−5.16
5 2020-03-09 7,950.68−624.94−7.29
62020-09-0311,458.10−598.34−4.96
72022-05-1811,418.15−566.37−4.73
82022-02-0313,878.82−538.73−3.74
92022-04-2912,334.64−536.89−4.17
102022-06-1310,809.23−530.80−4.68
112020-06-119,492.73−527.62−5.27
122022-01-0515,100.17−522.54−3.34
132022-05-0911,623.25−521.41−4.29
142022-04-2612,490.74−514.11−3.95
152022-08-2612,141.71−497.56−3.94
162022-03-0712,930.06−482.48−3.62
17 2021-02-25 13,119.43−478.54−3.52
182020-09-0810,847.69−465.44−4.11
192022-06-1610,646.10−453.06−4.08
202020-10-2811,004.87−426.48−3.73

Largest intraday point swings

This table shows the largest intraday point swings since 1985.

RankDateCloseDay HighDay LowPoint SwingNet Change
12022-02-2413,473.5813,486.1112,587.90898.23+436.09
22022-01-2413,855.1313,876.6113,094.65781.96+86.21
32020-03-137,874.237,875.937,219.09656.84+672.43
42020-09-0411,313.1311,531.1810,875.87655.31−144.97
52000-04-044,148.894,283.453,649.11634.34−74.79
62022-04-2113,715.514,28313.667.5616.00−276.50
72022-01-2613,542.1214,002.6513,392.19610.46+2.82
82022-10-1310,649.1510,697.7110,088.83608.88+232.05
92020-03-177,334.787,406.236,828.91577.32+430.19
10 2020-03-16 6,904.597,422.206,882.86539.34−970.28
112020-09-0311,458.1011,894.4011,361.36533.04−598.34
122020-03-127,201.807,712.337,194.67517.66−750.25
132020-03-206,879.317,354.446,854.67499.77−271.27
142020-03-186,989.847,182.836,686.36496.47−344.94
152020-03-197,150.587,341.386,858.38483.00+160.73
162020-03-038,684.099,070.328,602.89467.43−268.07
172020-07-1310,390.8410,824.7810,368.04456.74−226.60
182022-05-1811,418.1511,826.2211,381.69444.53−566.37
192020-09-1010,919.5911,299.5310,875.02424.51−221.97
202020-03-108,344.258,347.407,930.43416.97+393.58

Largest intraday percentage changes

Largest intraday percentage gains

An intraday percentage gain is defined as the difference between the previous trading session's closing price and the intraday high of the following trading session. The closing percentage change denotes the ultimate percentage change recorded after the corresponding trading session's close.

RankDatePrevious
session's
close
Following
session's
high
Intraday
percentage
gain
Closing
percentage
change
12001-01-032,291.862,618.03+14.23%+14.17%
22008-10-131,649.511,844.25+11.81%+11.81%
32001-04-181,923.222,129.31+10.72%+8.12%
42000-12-052,615.752,889.80+10.48%+10.48%
52008-10-281,505.901,649.47+9.53%+9.53%
62020-03-137,201.807,875.93+9.36%+9.35%
72001-04-051,638.801,785.73+8.97%+8.92%
82020-03-246,860.577,418.37+8.13%+8.12%
92000-05-303,205.113,460.24+7.96%+7.94%
102000-10-193,171.563,423.45+7.94%+7.79%
112000-10-133,074.683,316.97+7.88%+7.87%
122002-05-081,573.821,696.35+7.79%+7.78%
132020-04-067,373.087,938.33+7.67%+7.33%
142000-12-222,340.122,517.93+7.60%+7.56%
151987-10-21327.80352.30+7.47%+7.35%
162020-03-176,904.597,406.23+7.27%+6.23%
172000-04-183,539.163,794.97+7.23%+7.19%
182009-03-101,268.641,358.28+7.07%+7.07%
192001-04-101,745.711,868.10+7.01%+6.09%
202008-11-241,384.351,480.41+6.94%+6.33%
Largest intraday percentage drops

An intraday percentage drop is defined as the difference between the previous trading session's closing price and the intraday low of the following trading session. The closing percentage change denotes the ultimate percentage change recorded after the corresponding trading session's close.

RankDatePrevious
session's
close
Following
session's
low
Intraday
percentage
drop
Closing
percentage
change
12000-04-044,223.683,649.11−13.60%−1.77%
22020-03-167,874.886,882.86−12.60%−12.32%
31987-10-19406.30360.20−11.35%−11.35%
42000-04-143,676.783,265.98−11.17%−9.67%
52020-03-127,952.057,194.67−9.52%−9.43%
61987-10-20360.20326.60−9.33%−9.00%
72008-09-292,183.341,983.73−9.14%−9.14%
8 (tie)1987-10-26328.50298.90−9.01%−9.01%
8 (tie)2010-05-062,402.292,185.75−9.01%−3.44%
102008-12-011,535.571,398.07−8.95%−8.95%
112020-03-187,334.786,686.36−8.84%−4.70%
122015-08-244,706.044,292.14−8.80%−3.82%
132008-10-061,947.391,777.02−8.75%−4.34%
141998-08-311,639.681,498.73−8.60%−8.56%
152008-10-151,779.011,628.33−8.47%−8.47%
162000-04-034,572.834,193.10−8.30%−7.64%
172000-04-243,643.883,345.25−8.20%−4.43%
182001-01-022,470.522,273.07−7.99%−7.23%
192000-12-202,511.712,312.51−7.93%−7.12%
202020-03-098,575.627,943.16−7.38%−7.29%

Largest intraday percentage turnovers

Largest intraday percentage drops that closed positive

These are the largest intraday percentage drops that had been completely reversed and erased at the close of the respective trading session.

RankDatePrevious
session's
close
Following
session's
low
Intraday
percentage
drop
Closing
percentage
change
12008-10-101,645.121,542.45−6.24%+0.27%
22022-01-2413,768.9213,094.65−4.90%+0.63%
32008-11-131,499.211,428.54−4.71%+6.50%
42000-10-263,229.573,081.36−4.59%+1.32%
51997-10-281,535.091,465.84−4.51%+4.25%
62002-07-151,373.501,315.30−4.24%+0.66%
72001-02-232,244.962,156.29−3.95%+0.78%
82008-01-232,292.272,202.54−3.92%+1.05%
9 (tie)2000-05-243,164.553,042.66−3.85%+3.35%
9 (tie)2008-10-161,628.331,565.72−3.85%+5.49%
112001-03-012,151.832,071.03−3.76%+1.47%
122000-08-033,658.463,521.14−3.75%+2.77%
132000-01-313,887.073,748.03−3.58%+1.37%
142020-02-288,566.488,264.16−3.53%+0.01%
152008-11-181,482.051,429.92−3.52%+0.08%
162022-02-2413,037.4912,587.88−3.45%+3.34%
172002-06-141,496.861,445.44−3.44%+0.53%
182002-06-261,423.991,375.53−3.40%+0.38%
192000-04-054,148.894,009.09−3.37%+0.49%
202018-12-276,554.356,336.97−3.32%+0.38%
Largest intraday percentage gains that closed negative

These are the largest intraday percentage gains that had been completely reversed and erased at the close of the respective trading session.

RankDatePrevious
session's
close
Following
session's
high
Intraday
percentage
gain
Closing
percentage
change
12000-04-133,769.633,914.68+3.85%−2.46%
22008-10-171,717.711,782.58+3.78%−0.37%
32015-08-254,526.254,689.54+3.61%−0.44%
42008-10-031,976.722,046.81+3.55%−1.48%
52020-03-257,417.867,671.21+3.42%−0.45%
62000-11-272,904.382,998.75+3.25%−0.82%
7 (tie)2000-05-253,270.613,367.71+2.97%−2.00%
7 (tie)2001-03-151,972.092,030.73+2.97%−1.59%
92008-10-081,754.881,806.89+2.96%−0.83%
102020-04-077,913.248,146.43+2.95%−0.33%
112008-10-141,844.251,896.95+2.86%−3.54%
122020-03-207,150.587,354.44+2.85%−3.79%
132001-11-081,837.531,888.39+2.77%−0.53%
14 (tie)2000-12-182,653.272,726.20+2.75%−1.08%
14 (tie)2000-12-192,624.522,696.61+2.75%−4.30%
162008-10-091,740.331,787.41+2.71%−5.47%
17 (tie)1987-10-27298.90306.90+2.68%−0.87%
17 (tie)1998-10-061,536.691,577.87+2.68%−1.68%
192001-02-132,489.662,554.65+2.61%−2.49%
202000-10-123,168.493,249.11+2.54%−2.96%

Largest daily percentage changes per year

Largest daily percentage gains per year
YearDateClose % ChangeWeekday
2024*2024-02-2216,041.62+2.96Thursday
20232023-01-0610,569.29+2.56Friday
20222022-11-1011,114.15+7.35Thursday
20212021-03-0913,073.82+3.69Tuesday
20202020-03-137,874.88+9.35Friday
20192019-01-046,738.86+4.26Friday
20182018-12-266,554.35+5.84Wednesday
20172017-10-276,701.26+2.20Friday
20162016-03-014,689.60+2.89Tuesday
20152015-08-264,697.54+4.24Wednesday
20142014-10-214,419.48+2.40Tuesday
20132013-01-023,112.26+3.07Wednesday
20122012-06-292,935.05+3.00Friday
20112011-08-092,482.52+5.29Tuesday
20102010-05-102,374.67+4.81Monday
20092009-03-101,358.28+7.07Tuesday
20082008-10-131,844.25+11.81Monday
20072007-11-132,673.65+3.46Tuesday
20062006-06-292,174.38+2.96Thursday
20052005-04-211,962.41+2.54Thursday
20042004-03-251,967.17+3.02Thursday
20032003-03-131,340.77+4.81Thursday
20022002-05-081,696.29+7.78Wednesday
20012001-01-032,616.69+14.17Wednesday
20002000-12-052,889.80+10.48Tuesday
19991999-06-162,517.83+4.27Wednesday
19981998-09-081,660.86+6.02Tuesday
19971997-10-281,600.34+4.25Tuesday
19961996-07-171,086.65+3.15Thursday
19951995-12-191,026.41+2.38Tuesday
19941994-04-05750.95+3.24Tuesday
19931993-05-04678.16+1.72Tuesday
19921992-01-22620.68+2.61Wednesday
19911991-08-21517.97+3.17Wednesday
19901990-08-27381.27+3.79Monday
19891989-10-19470.80+1.62Thursday
19881988-01-04338.48+2.42Monday
19871987-10-21351.86+7.34Wednesday
19861986-04-16387.64+1.55Wednesday
19851985-05-10287.46+1.48Friday
19841984-08-03246.24+3.09Friday
19831983-07-20316.76+1.80Wednesday
19821982-11-03222.77+2.35Tuesday
19811981-09-29178.51+1.99Tuesday
19801980-03-28129.25+4.16Friday
19791979-11-26141.95+1.50Monday
19781978-11-01114.65+3.18Wednesday
19771977-11-1099.98+1.30Thursday
19761976-01-0680.27+1.92Tuesday
19751975-01-2767.04+2.54Monday
19741974-10-1059.13+2.71Thursday
19731973-05-24104.27+2.14Thursday
19721972-12-29133.73+1.36Thursday
19711971-08-16107.86+2.30Monday
Largest daily percentage losses per year
YearDateClose % ChangeWeekday
2024*2024-01-3115,164.01−2.23Wednesday
20232023-02-2111,492.30−2.50Monday
20222022-09-1311,633.57−5.16Tuesday
20212021-02-2513,119.43−3.52Thursday
20202020-03-166,904.59−12.32Monday
20192019-08-057,726.04−3.47Monday
20182018-10-247,108.40−4.43Wednesday
20172017-05-176,011.24−2.57Wednesday
20162016-06-244,707.98−4.12Friday
20152015-08-244,526.25−3.82Monday
20142014-04-104,054.11−3.10Thursday
20132013-04-153,216.49−2.38Monday
20122012-06-012,747.48−2.82Friday
20112011-08-082,357.69−6.90Monday
20102010-05-202,204.01−4.11Thursday
20092009-01-201,440.86−5.78Tuesday
20082008-09-291,983.73−9.14Monday
20072007-02-272,407.86−3.86Tuesday
20062006-01-202,247.70−2.35Friday
20052005-01-042,107.86−2.06Tuesday
20042004-02-042,014.14−2.52Wednesday
20032003-03-241,369.78−3.66Monday
20022002-07-231,229.05−4.18Tuesday
20012001-01-022,291.86−7.23Tuesday
20002000-04-143,321.29-9.67Friday
19991999-04-192,345.61−5.57Monday
19981998-08-311,499.25−8.56Monday
19971997-10-271,535.09−7.02Monday
19961996-07-151,060.19−3.92Monday
19951995-07-19952.83−3.61Wednesday
19941994-02-04777.28−2.57Friday
19931993-02-16665.39−3.64Tuesday
19921992-04-20577.20−2.47Monday
19911991-11-15531.29−4.24Friday
19901990-08-06400.04−4.17Monday
19891989-10-13467.29−3.09Friday
19881988-01-08338.47−3.20Friday
19871987-10-19360.20−11.35Monday
19861986-09-11353.34−3.67Thursday
19851985-09-17281.07−1.51Tuesday
19841984-02-06258.64−2.03Monday
19831983-01-24236.73−2.97Monday
19821982-12-15225.69−2.44Wednesday
19811981-01-07197.35−3.29Wednesday
19801980-03-27124.09−6.15Thursday
19791979-10-10139.31−4.06Wednesday
19781978-10-20123.82−2.67Friday
19771977-10-1299.83−1.38Wednesday
19761976-03-1589.72−1.40Monday
19751975-12-0375.67−2.15Wednesday
19741974-11-1862.09−3.60Monday
19731973-11-2694.13−3.26Monday
19721972-05-09125.78−2.21Tuesday
19711971-06-21106.50−1.54Monday

See also

Related Research Articles

<span class="mw-page-title-main">Dot-com bubble</span> Tech stock speculative craze, c. 1997–2003

The dot-com bubble was a stock market bubble that ballooned during the late-1990s and peaked on Friday, March 10, 2000. This period of market growth coincided with the widespread adoption of the World Wide Web and the Internet, resulting in a dispensation of available venture capital and the rapid growth of valuations in new dot-com startups.

<span class="mw-page-title-main">Nasdaq</span> American stock exchange

The Nasdaq Stock Market is an American stock exchange based in New York City. It is the most active stock trading venue in the US by volume, and ranked second on the list of stock exchanges by market capitalization of shares traded, behind the New York Stock Exchange. The exchange platform is owned by Nasdaq, Inc., which also owns the Nasdaq Nordic stock market network and several U.S.-based stock and options exchanges.

<span class="mw-page-title-main">Dow Jones Industrial Average</span> American stock market index composed of 30 industry leaders

The Dow Jones Industrial Average (DJIA), Dow Jones, or simply the Dow, is a stock market index of 30 prominent companies listed on stock exchanges in the United States.

<span class="mw-page-title-main">Stock market crash</span> Sudden widespread decline of stock prices

A stock market crash is a sudden dramatic decline of stock prices across a major cross-section of a stock market, resulting in a significant loss of paper wealth. Crashes are driven by panic selling and underlying economic factors. They often follow speculation and economic bubbles.

<span class="mw-page-title-main">S&P 500</span> American stock market index

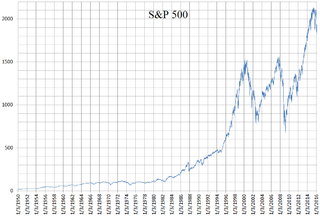
The Standard and Poor's 500, or simply the S&P 500, is a stock market index tracking the stock performance of 500 of the largest companies listed on stock exchanges in the United States. It is one of the most commonly followed equity indices and includes approximately 80% of the total market capitalization of U.S. public companies.

<span class="mw-page-title-main">Nasdaq Stockholm</span> Stock exchange in Stockholm, Sweden

Nasdaq Stockholm, formerly known as the Stockholm Stock Exchange, is a stock exchange located in Frihamnen, Stockholm, Sweden. Founded in 1863, it has become the primary securities exchange of the Nordic countries. As of March 2021, a total of 832 companies are listed on Nasdaq Stockholm with 385 companies on the main market and additional 447 listed on secondary markets.

<span class="mw-page-title-main">Nasdaq-100</span> Stock market index

The Nasdaq-100 (^NDX) is a stock market index made up of 101 equity securities issued by 100 of the largest non-financial companies listed on the Nasdaq stock exchange. It is a modified capitalization-weighted index. The stocks' weights in the index are based on their market capitalizations, with certain rules capping the influence of the largest components. It is limited to companies from a single exchange, and it does not have any financial companies. The financial companies are in a separate index, the Nasdaq Financial-100.

The Center for Research in Security Prices, LLC (CRSP) is a provider of historical stock market and investable index data. CRSP is an affiliate of the Booth School of Business at the University of Chicago. CRSP maintains some of the largest and most comprehensive proprietary historical databases in stock market research. Academic researchers and investment professionals rely on CRSP for accurate, survivor bias-free information which provides a foundation for their research and analyses. As of 2023, CRSP claims over 600 clients. The name is usually pronounced "crisp".

A capitalization-weightedindex, also called a market-value-weighted index is a stock market index whose components are weighted according to the total market value of their outstanding shares. Every day an individual stock's price changes and thereby changes a stock index's value. The impact that individual stock's price change has on the index is proportional to the company's overall market value, in a capitalization-weighted index. In other types of indices, different ratios are used.

The Nasdaq Composite is a stock market index that includes almost all stocks listed on the Nasdaq stock exchange. Along with the Dow Jones Industrial Average and S&P 500, it is one of the three most-followed stock market indices in the United States. The composition of the NASDAQ Composite is heavily weighted towards companies in the information technology sector. The Nasdaq-100, which includes 100 of the largest non-financial companies in the Nasdaq Composite, accounts for over 90% of the movement of the Nasdaq Composite.

The NYSE Composite (^NYA) is a stock market index covering all common stock listed on the New York Stock Exchange, including American depositary receipts, real estate investment trusts, tracking stocks, and foreign listings. It includes corporations in each of the ten industries listed in the Industry Classification Benchmark. It uses free-float market cap weighting.

The Value Line Composite Index (VLCI) are two futures market indices published by Value Line, both comprising 1,681 publicly listed companies on the NYSE, NYSE American, NASDAQ, and TSX stock exchanges. They include all components of the company's Value Line Investment Survey except for closed-end funds, designed to be representative of the North American equity market. The VLCI was initially released on June 30, 1961 as the Value Line Geometric Composite Index, a equally weighted index using a geometric average. Since February 1, 1988 the VLCI has also included the Value Line Arithmetic Composite Index, a similar index that instead uses a arithmetic average.

NASDAQ futures are financial futures which launched on June 21, 1999. It is the financial contract futures that allow an investor to hedge with or speculate on the future value of various components of the NASDAQ market index.

This article is a summary of the closing milestones of the S&P 500 Index, a United States stock market index.

The Barron's 400 Index or B400 is a stock market index of 400 public companies in the United States, as selected by editors and associates of Barron's magazine. Established in 2007, the Barron's 400 has tended to outperform certain other major indexes at least through the first half of 2013.

This article is a summary of the closing milestones of the Nasdaq Composite, a United States stock market index. Since first opening at 100.00 on February 5, 1971, the Nasdaq Composite has increased, despite several periods of decline, most recently after the financial crisis.

References