Paleotempestology is the study of past tropical cyclone activity by means of geological proxies as well as historical documentary records. The term was coined by American meteorologist Kerry Emanuel.
Intense flooding during the late glacial to 5,000 – 4,500 years ago indicate increased typhoon activity, followed by a period of less intense activity until about 2,350 years ago
A stage without intense storms between 2,900 – 2,500 years ago, followed by an active period that lasted until 1,000 years ago. Two intense events about 500 years ago and an increase between 300 – 100 years ago
Frequent flooding during the 7th, 9th and 19th century with less common flooding during the 13th and 15–17th centuries. Also, evidence of strong tropical cyclone strikes during the Terminal Classic Maya
7 hurricanes with category 3 or more intensity are known in the last 600 years, giving a frequency of 1.2 storms per century. Among the storms are Hurricane Audrey and Hurricane Rita
Potential storm deposits at 1200 AD, AD 1831 and AD 1848, the middle of which is correlated to a major storm; also an inactive phase in the 1950s and 1970s
Reconstruction of annual tropical cyclone rainfall totals, which exhibits a decrease after a major volcanic eruption. Presently the oldest paleohurricane reconstruction using tree rings.
Storms in 720 ± 60, 880 ± 110, 950 ± 70, 995 ± 120 and 1535 ± 40, the latter occurring during the Little Ice Age and the others during the Medieval Climate Anomaly
Last 800 years have an active climate with a return period of about 140–180 years, while between 800 and 2,800 the return period was only once between 600 and 2,100 years and another quiet period between 4,900 – 5,400 years ago; between 2,800 and 4,900 no records
Subdued activity between 900-1350 and after 1950AD during the recent warm periods and Medieval Climate Anomaly, with increased activity during the Little Ice Age
Active periods occurred within the last 50 years, between 1,200 and 500 years ago, 2,400 – 1,800 years ago and 4,600 – 3,800 years ago, with low activity before 4,400 years
18 typhoon strikes in the last 8,000 years, with increased activity in the mid-Holocene until 3,900 years ago (2–5 times more storms) either due to a warmer climate or higher sea level induced better sensitivity to storms
0.48% probability of landfall any given year, but an active period in the last 250 years and previous active periods between 2,500 – 1,000 and 3,600 – 5,400 years ago. El Nino is linked with lower activity, a strong West African Monsoon with higher activity
Beginning at 250 AD increased activity, while a quiet period has lasted from 1600 AD to today. Typhoon Jean, Typhoon Grace and others have been identified, including two deposits that may correlate to the Kamikaze typhoons which also coincide within an active period. Recorded storms appear to be of category 3 or higher strength
11 intense storms between 3,500 and 700 years ago, a quiet period before 3,200 radiocarbon years ago may be either a stage of inactivity or a change in the lake environment. Comparisons to Hurricane Frederic and Hurricane Ivan imply that the intense storms reached category 4 or 5 intensity
Increased storm intensity during the Medieval Warm Period, with more but possibly weaker storms during the Little Ice Age and an increase in storm intensity after it
Between 3,100 – 1,800 years ago only weak activity, followed and preceded by strong activity; intense storms about once every ten years in the last 3,500 years and the storm activity correlates to sea surface temperatures
Active between 1,245–1,290, 1,395–1,500, 1,590–1,650 and 1,775–1,845 AD in particular the most recent period. Inactive during 1,161–1,213, 1,528–1,585, 1,651–1,713, 1,877–1,927 and 1,933–2,003 AD
Up to eight Category 2–3 hurricanes occurred per century in the 12th to 16th century, while the preceding and the two subsequent ones only saw 2–3 such storms per century
Maximum activity between 1,550-1,900 with 8 events/century. Active periods in 690-760, 960-1,100, 1,550-1,900 and inactive ones in 98-595, 618-690, 758-813, 831-901, 1,444-1,514 and 1,961-2,017 AD
Active periods with intense storms 650 – 750 years ago, 925 – 875 years ago, 1,250 – 1,150 years ago, 2,800 – 2,300 years ago, 3,350 – 3,250 years ago, 3,600 – 3,500 years ago and 3,950 – 3,650 years ago; the maximum occurrence rate between 2,300 and 2,800 years ago saw six storms per century while the last 150 years have been fairly inactive. Mullet Pond records also somewhat weaker storms and shows a recurrence rate of 3.9 events per century.
2 strong storms between AD 1400 – 1600 after two centuries without one, seven strong storms between AD 1600 and AD 1800 and only one strong storm after that
Intense storms occurred between 130 and 1,550 years ago as well as between 3,380 – 5,010 years ago, while the time between 1,550 – 2,280 years ago had very weak storms
35 hurricanes with active periods between 150 -1,150 AD and 1,400 – 1,675 AD; one historical hurricane (Hurricane Bob) recorded; some storms are stronger than the most intense hurricane there, the Great Colonial Hurricane of 1635
Increased storm activity between 3,400 and 1,000 years ago. Recurrence rate of strong hurricanes appears to be much less than the historical rate, which may be due to measurement issues
Two tsunami deposits, one of which linked to the 1755 Lisbon earthquake. Of the 23 remaining deposits most likely linked to hurricanes, one probably belongs to Hurricane Dog in 1950 and another to an unnamed hurricane in 1923. Increased activity in 445–525, 720–835, 1080–1230, 1625–1695, 1745–1890 and 1920–1970 including the Medieval Warm Period and decreased activity in 560, ~670, 965–1020,1400–1600, ~1740 cal. CE.
Storm deposits were emplaced between AD1875-1925, before AD1827, before AD1665-1696, in the 14th–15th century, before AD950-1040, AD429-966 and before AD260-520
An inactive period between about 5,400 and 3,700 years ago accompanied by drought. Storm intensity indicated by the ridges is about category 2–4 on the Saffir-Simpson scale, while no case of category 5 is inferred
Higher activity than the historical period 650–1000, 1100–1300, 1350–1450, and 1750–1850 AD, and lower activity than today 450–650, 1000–1100, 1300–1350, and 1500–1750 AD; Hurricane Michael in 2018 left a deposit
Historical storms like Hurricane Hazel and Hurricane Hugo are recorded, with more storms until 1050 BC. Between 3050 and 1050 BC there are no storm deposits, but one deposit dating to 3750 BC appears to relate to a very intense event, perhaps due to a warmer climate at that time
Deposits from Hurricane Katrina and Hurricane Camille are present and serve as modern analogues to reconstruct storm surge height for stormy intervals between 350 BC–AD 50 and AD 1050–1350. The decline in activity after AD 1350 coincides with a southward shift in the mean position of the Loop Current
Mainly intense tropical cyclones recorded, including unnamed 1919 and 1945 Category 3 hurricanes although a weaker storm in 1945 might have also contributed. In general there are phases of high and low activity associated with phase changes of the ITCZ volcanic activity and the Little Ice Age
Recorded storms include Hurricane Jeanne in 2004; active periods between 1050 and 1150 AD, a very active period between 1350-1650AD, a reincrease in the late 18th century
Seven storm periods in the last 7,500 years, including active periods between 5,500 and 3,500 and from 1,700 years ago onwards, with inactive period in between; there are also (in)active periods embedded within these active(inactive) ones and there is more generally a correlation to storm activity elsewhere in southern China and to ENSO variations
After an inactive phase (~1 storm/year) in the middle 16th century, an increase to ~8 storms/year in the 17th century associated with the Little Ice Age. Then a steady decrease until 1870, when occurrence halved and dropped to ~2 storms/year
Six strikes in 1,000 years, with two during the Little Ice Age and four during the Medieval Climate Anomaly. Also high storm activity around 1200 AD, 400 BC and 1200 BC
Between around 5720–5520 BC and 5050 BC–AD 360, storm activity was less meaningful. Increased storminess occurred AD 1350–1450, 150 BC–year 0, 900–400 BC, 1550–1320 BC, 3450–3420 BC, and 4700–4560 BC.
The Holocene is the current geological epoch. It began approximately 11,700 years ago. It follows the Last Glacial Period, which concluded with the Holocene glacial retreat. The Holocene and the preceding Pleistocene together form the Quaternary period. The Holocene has been identified with the current warm period, known as MIS 1. It is considered by some to be an interglacial period within the Pleistocene Epoch, called the Flandrian interglacial.
The North Atlantic Oscillation (NAO) is a weather phenomenon over the North Atlantic Ocean of fluctuations in the difference of atmospheric pressure at sea level (SLP) between the Icelandic Low and the Azores High. Through fluctuations in the strength of the Icelandic Low and the Azores High, it controls the strength and direction of westerly winds and location of storm tracks across the North Atlantic.
The Holocene Climate Optimum (HCO) was a warm period in the first half of the Holocene epoch, that occurred in the interval roughly 9,500 to 5,500 years BP, with a thermal maximum around 8000 years BP. It has also been known by many other names, such as Altithermal, Climatic Optimum, Holocene Megathermal, Holocene Optimum, Holocene Thermal Maximum, Hypsithermal, and Mid-Holocene Warm Period.
This is a list of all known or suspected Atlantic hurricanes up to 1599. Although most storms likely went unrecorded, and many records have been lost, recollections of hurricane occurrences survive from some sufficiently populated coastal areas, and rarely, ships at sea that survived the tempests.
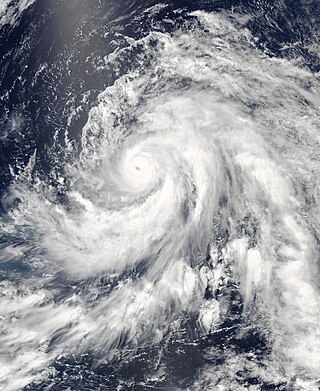
An Atlantic hurricane is a type of tropical cyclone that forms in the Atlantic Ocean primarily between June and November. The terms "hurricane", "typhoon", and "cyclone" can be used interchangeably to describe this weather phenomenon. These storms are rotating, organized systems of clouds and thunderstorms that originate over tropical or subtropical waters and have closed low-level circulation, not to be confused with tornadoes. They form over low pressure systems. In the North Atlantic, central North Pacific, and eastern North Pacific, the term "hurricane" is mainly used, whereas "typhoon" is more commonly used for storms originating in the western North Pacific. The term "cyclone" is used in the South Pacific and Indian Ocean.
A tropical cyclone is a rapidly rotating storm system characterized by a low-pressure center, a closed low-level atmospheric circulation, strong winds, and a spiral arrangement of thunderstorms that produce heavy rain and squalls. Depending on its location and strength, a tropical cyclone is referred to by different names, including hurricane, typhoon, tropical storm, cyclonic storm, tropical depression, or simply cyclone. A hurricane is a strong tropical cyclone that occurs in the Atlantic Ocean or northeastern Pacific Ocean, and a typhoon occurs in the northwestern Pacific Ocean. In the Indian Ocean and South Pacific, comparable storms are referred to as "tropical cyclones". In modern times, on average around 80 to 90 named tropical cyclones form each year around the world, over half of which develop hurricane-force winds of 65 kn or more. Tropical cyclones carry heat and energy away from the tropics and transport it towards temperate latitudes, which plays an important role in regulating global climate.
Tropical cyclone observation has been carried out over the past couple of centuries in various ways. The passage of typhoons, hurricanes, as well as other tropical cyclones have been detected by word of mouth from sailors recently coming to port or by radio transmissions from ships at sea, from sediment deposits in near shore estuaries, to the wiping out of cities near the coastline. Since World War II, advances in technology have included using planes to survey the ocean basins, satellites to monitor the world's oceans from outer space using a variety of methods, radars to monitor their progress near the coastline, and recently the introduction of unmanned aerial vehicles to penetrate storms. Recent studies have concentrated on studying hurricane impacts lying within rocks or near shore lake sediments, which are branches of a new field known as paleotempestology. This article details the various methods employed in the creation of the hurricane database, as well as reconstructions necessary for reanalysis of past storms used in projects such as the Atlantic hurricane reanalysis.
The 4.2-kiloyear BP aridification event, also known as the 4.2 ka event, was one of the most severe climatic events of the Holocene epoch. It defines the beginning of the current Meghalayan age in the Holocene epoch.
Hurricane Alley is an area of warm water in the Atlantic Ocean stretching from the west coast of northern Africa to the east coast of Central America and Gulf Coast of the Southern United States. Many hurricanes form within this area. The sea surface temperature of the Atlantic in Hurricane Alley has grown slightly warmer over the past decades. A particularly warm summer in 2005 led climate scientists to begin studying whether this trend would lead to an increase in hurricane activity.
In climatology, the 8.2-kiloyear event was a sudden decrease in global temperatures that occurred approximately 8,200 years before the present, or c. 6,200 BC, and which lasted for the next two to four centuries. It defines the start of the Northgrippian age in the Holocene epoch. The cooling was significantly less pronounced than during the Younger Dryas cold period that preceded the beginning of the Holocene. During the event, atmospheric methane concentration decreased by 80 ppb, an emission reduction of 15%, by cooling and drying at a hemispheric scale.
Climate change can affect tropical cyclones in a variety of ways: an intensification of rainfall and wind speed, a decrease in overall frequency, an increase in the frequency of very intense storms and a poleward extension of where the cyclones reach maximum intensity are among the possible consequences of human-induced climate change. Tropical cyclones use warm, moist air as their source of energy or "fuel". As climate change is warming ocean temperatures, there is potentially more of this fuel available.
Lake Tauca is a former lake in the Altiplano of Bolivia. It is also known as Lake Pocoyu for its constituent lakes: Lake Poopó, Salar de Coipasa and Salar de Uyuni. The lake covered large parts of the southern Altiplano between the Eastern Cordillera and the Western Cordillera, covering an estimated 48,000 to 80,000 square kilometres of the basins of present-day Lake Poopó and the Salars of Uyuni, Coipasa and adjacent basins. Water levels varied, possibly reaching 3,800 metres (12,500 ft) in altitude. The lake was saline. The lake received water from Lake Titicaca, but whether this contributed most of Tauca's water or only a small amount is controversial; the quantity was sufficient to influence the local climate and depress the underlying terrain with its weight. Diatoms, plants and animals developed in the lake, sometimes forming reef knolls.
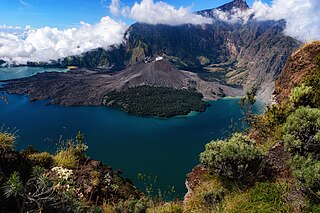
In 1257, a catastrophic eruption occurred at Samalas, a volcano on the Indonesian island of Lombok. The event had a probable Volcanic Explosivity Index of 7, making it one of the largest volcanic eruptions during the Holocene epoch. It left behind a large caldera that contains Lake Segara Anak. Later volcanic activity created more volcanic centres in the caldera, including the Barujari cone, which remains active.
Cyclonic Niño is a climatological phenomenon that has been observed in climate models where tropical cyclone activity is increased. Increased tropical cyclone activity mixes ocean waters, introducing cooling in the upper layer of the ocean that quickly dissipates and warming in deeper layers that lasts considerably more, resulting in a net warming of the ocean.
The African humid period is a climate period in Africa during the late Pleistocene and Holocene geologic epochs, when northern Africa was wetter than today. The covering of much of the Sahara desert by grasses, trees and lakes was caused by changes in the Earth's axial tilt; changes in vegetation and dust in the Sahara which strengthened the African monsoon; and increased greenhouse gases. During the preceding Last Glacial Maximum, the Sahara contained extensive dune fields and was mostly uninhabited. It was much larger than today, and its lakes and rivers such as Lake Victoria and the White Nile were either dry or at low levels. The humid period began about 14,600–14,500 years ago at the end of Heinrich event 1, simultaneously to the Bølling–Allerød warming. Rivers and lakes such as Lake Chad formed or expanded, glaciers grew on Mount Kilimanjaro and the Sahara retreated. Two major dry fluctuations occurred; during the Younger Dryas and the short 8.2 kiloyear event. The African humid period ended 6,000–5,000 years ago during the Piora Oscillation cold period. While some evidence points to an end 5,500 years ago, in the Sahel, Arabia and East Africa, the end of the period appears to have taken place in several steps, such as the 4.2-kiloyear event.
The Medieval Warm Period (MWP), also known as the Medieval Climate Optimum or the Medieval Climatic Anomaly, was a time of warm climate in the North Atlantic region that lasted from c. 950 to c. 1250. Climate proxy records show peak warmth occurred at different times for different regions, which indicate that the MWP was not a globally uniform event. Some refer to the MWP as the Medieval Climatic Anomaly to emphasize that climatic effects other than temperature were also important.
Paleotempestology is the study of past tropical cyclone activity by means of geological proxies as well as historical documentary records. The term was coined by American meteorologist Kerry Emanuel.
The Quelccaya Ice Cap is the second largest glaciated area in the tropics, after Coropuna. Located in the Cordillera Oriental section of the Andes mountains in Peru, the cap covers an area of 42.8 square kilometres (16.5 sq mi) with ice up to 200 metres (660 ft) thick. It is surrounded by tall ice cliffs and a number of outlet glaciers, the largest of which is known as Qori Kalis Glacier; lakes, moraines, peat bogs and wetlands are also present. There is a rich flora and fauna, including birds that nest on the ice cap. Quelccaya is an important source of water, eventually melting and flowing into the Inambari and Vilcanota Rivers.
Pacific Meridional Mode (PMM) is a climate mode in the North Pacific. In its positive state, it is characterized by the coupling of weaker trade winds in the northeast Pacific Ocean between Hawaii and Baja California with decreased evaporation over the ocean, thus increasing sea surface temperatures (SST); and the reverse during its negative state. This coupling develops during the winter months and spreads southwestward towards the equator and the central and western Pacific during spring, until it reaches the Intertropical Convergence Zone (ITCZ), which tends to shift north in response to a positive PMM.
The Rodwell–Hoskins mechanism is a hypothesis describing a climatic teleconnection between the Indian/Asian summer monsoon and the climate of the Mediterranean. It was formulated in 1996 by Brian Hoskins and Mark J. Rodwell [d]. The hypothesis stipulates that ascending air in the monsoon region induces atmospheric circulation features named Rossby waves that expand westward and interact with the mean westerly winds of the midlatitudes, eventually inducing descent of the air. Descending air warms and its humidity decreases, thus resulting in a drier climate during the summer months. The interaction of this atmospheric flow with topography further modifies the effect.
↑ Brill, Dominik; Seeger, Katharina; Pint, Anna; Reize, Felix; Hlaing, Kay Thwe; Seeliger, Martin; Opitz, Stephan; Win, Khin Mi Mi; Nyunt, Win Thuzar; Aye, Nilar; Aung, Aung; Kyaw, Kyaw; Kraas, Frauke; Brückner, Helmut (April 2020). "Modern and historical tropical cyclone and tsunami deposits at the coast of Myanmar: Implications for their identification and preservation in the geological record". Sedimentology. 67 (3): 1431–1459. doi:10.1111/sed.12586. S2CID134771900.
1 2 Liu, Kam-biu; Lu, Houyuan; Shen, Caiming (January 2008). "A 1200-year proxy record of hurricanes and fires from the Gulf of Mexico coast: Testing the hypothesis of hurricane–fire interactions". Quaternary Research. 69 (1): 30. Bibcode:2008QuRes..69...29L. doi:10.1016/j.yqres.2007.10.011. S2CID44126539.
Adomat, Friederike; Gischler, Eberhard (1 January 2017). "Assessing the suitability of Holocene environments along the central Belize coast, Central America, for the reconstruction of hurricane records". International Journal of Earth Sciences. 106 (1): 283–309. Bibcode:2017IJEaS.106..283A. doi:10.1007/s00531-016-1319-y. ISSN1437-3262. S2CID131311822.
Astakhov, A. S.; Dar’in, A. V.; Kalugin, I. A.; Aksentov, K. I. (2019-01-01). "Reconstructing the Frequency of Catastrophic Floods on the Western Coast of the Sea of Japan Based on Sedimentary Proxy". Russian Meteorology and Hydrology. 44 (1): 62–70. doi:10.3103/S1068373919010072. ISSN1934-8096. S2CID146559928.
Bennington, J. Bret; Farmer, E. Christa (2015), "Recognizing Past Storm Events in Sediment Cores Based on Comparison to Recent Overwash Sediments Deposited by Superstorm Sandy", Learning from the Impacts of Superstorm Sandy, Elsevier, pp.89–106, doi:10.1016/b978-0-12-801520-9.00007-9, ISBN9780128015209
Boldt, Katherine V.; Lane, Philip; Woodruff, Jonathan D.; Donnelly, Jeffrey P. (September 2010). "Calibrating a sedimentary record of overwash from Southeastern New England using modeled historic hurricane surges". Marine Geology. 275 (1–4): 127–139. Bibcode:2010MGeol.275..127B. doi:10.1016/j.margeo.2010.05.002.
Brandon, Christine M.; Woodruff, Jonathan D.; Lane, D. Phil; Donnelly, Jeffrey P. (August 2013). "Tropical cyclone wind speed constraints from resultant storm surge deposition: A 2500 year reconstruction of hurricane activity from St. Marks, FL: PALEO-HURRICANE ACTIVITY IN ST. MARKS, FL". Geochemistry, Geophysics, Geosystems. 14 (8): 2993–3008. doi:10.1002/ggge.20217. hdl:1912/6334. S2CID49657980.
Braun, Erick; Meyer, Brian; Deocampo, Daniel; Kiage, Lawrence M. (September 2017). "A 3000 yr paleostorm record from St. Catherines Island, Georgia". Estuarine, Coastal and Shelf Science. 196: 360–372. Bibcode:2017ECSS..196..360B. doi:10.1016/j.ecss.2017.05.021.
Brill, D.; May, S.M.; Shah-Hosseini, M.; Rufer, D.; Schmidt, C.; Engel, M. (August 2017). "Luminescence dating of cyclone-induced washover fans at Point Lefroy (NW Australia)". Quaternary Geochronology. 41: 134–150. Bibcode:2017QuGeo..41..134B. doi:10.1016/j.quageo.2017.03.004.
Chagué-Goff, Catherine; Chan, Jordan Chi Hang; Goff, James; Gadd, Patricia (September 2016). "Late Holocene record of environmental changes, cyclones and tsunamis in a coastal lake, Mangaia, Cook Islands: Cyclones and tsunamis on Mangaia". Island Arc. 25 (5): 333–349. doi:10.1111/iar.12153. S2CID132673825.
Chen, Huei-Fen; Wen, Shie-Ying; Song, Shen-Rong; Yang, Tien-Nan; Lee, Teh-Quei; Lin, Sue-Fen; Hsu, Shih-Chieh; Wei, Kuo-Yen; Chang, Ping-Yu (December 2012). "Strengthening of paleo-typhoon and autumn rainfall in Taiwan corresponding to the Southern Oscillation at late Holocene". Journal of Quaternary Science. 27 (9): 964–972. Bibcode:2012JQS....27..964C. doi:10.1002/jqs.2590. S2CID128642045– via Academia.edu.
Colombié, Claude; Carcel, Damien; Lécuyer, Christophe; Ruffel, Alastair; Schnyder, Johann (November 2018). "Temperature and cyclone frequency in Kimmeridgian Greenhouse period (late Jurassic)". Global and Planetary Change. 170: 126–145. Bibcode:2018GPC...170..126C. doi:10.1016/j.gloplacha.2018.08.005. S2CID134407200.
Cook, T. L.; Kundu, S.; Kanamaru, K.; Woodruff, J. D. (2015-01-01). "Depositional evidence for the Kamikaze typhoons and links to changes in typhoon climatology". Geology. 43 (1): 91–94. Bibcode:2015Geo....43...91W. doi:10.1130/G36209.1. ISSN0091-7613.
Dezileau, L.; Sabatier, P.; Blanchemanche, P.; Joly, B.; Swingedouw, D.; Cassou, C.; Castaings, J.; Martinez, P.; Von Grafenstein, U. (1 January 2011). "Intense storm activity during the Little Ice Age on the French Mediterranean coast". Palaeogeography, Palaeoclimatology, Palaeoecology. 299 (1): 289–297. Bibcode:2011PPP...299..289D. doi:10.1016/j.palaeo.2010.11.009. ISSN0031-0182.
Donnelly, Jeffrey P.; Smith Bryant, Sarah; Butler, Jessica; Dowling, Jennifer; Fan, Linda; Hausmann, Neil; Newby, Paige; Shuman, Bryan; Stern, Jennifer; Westover, Karlyn; Webb III, Thompson (June 2001). "700 yr sedimentary record of intense hurricane landfalls in southern New England". Geological Society of America Bulletin. 113 (6): 714–727. Bibcode:2001GSAB..113..714D. doi:10.1130/0016-7606(2001)113<0714:YSROIH>2.0.CO;2. S2CID37143442.
Donnelly, Jeffrey P.; Butler, Jessica; Roll, Stuart; Wengren, Micah; Webb, Thompson (2004). "A backbarrier overwash record of intense storms from Brigantine, New Jersey". Marine Geology. 210 (1–4): 107–121. Bibcode:2004MGeol.210..107D. doi:10.1016/j.margeo.2004.05.005.
Donnelly, Jeffrey P. (2005). "Evidence of Past Intense Tropical Cyclones from Backbarrier Salt Pond Sediments: A Case Study from Isla de Culebrita, Puerto Rico, USA". Journal of Coastal Research: 201–210. ISSN0749-0208. JSTOR25736985.
Du, Shuhuan; Li, Baosheng; Chen, Muhong; Xiang, Rong; Niu, Donefeng; Si, Yuejun (September 2016). "Paleotempestology evidence recorded by eolian deposition in the Bohai Sea coastal zone during the last interglacial period". Marine Geology. 379: 78–83. Bibcode:2016MGeol.379...78D. doi:10.1016/j.margeo.2016.05.013.
Ford, M. R.; Tuck, M.; Owen, S. D.; McLean, R. F.; Kench, P. S. (2018-10-01). "Storm-deposited coral blocks: A mechanism of island genesis, Tutaga island, Funafuti atoll, Tuvalu". Geology. 46 (10): 915–918. Bibcode:2018Geo....46..915K. doi:10.1130/G45045.1. ISSN0091-7613. S2CID135443385.
Forsyth, Anthony J.; Nott, Jonathan; Bateman, Mark D. (November 2010). "Beach ridge plain evidence of a variable late-Holocene tropical cyclone climate, North Queensland, Australia". Palaeogeography, Palaeoclimatology, Palaeoecology. 297 (3–4): 707–716. Bibcode:2010PPP...297..707F. doi:10.1016/j.palaeo.2010.09.024.
Forsyth, Anthony J.; Nott, Jonathan; Bateman, Mark D.; Beaman, Robin J. (April 2012). "Juxtaposed beach ridges and foredunes within a ridge plain — Wonga Beach, northeast Australia". Marine Geology. 307–310: 111–116. Bibcode:2012MGeol.307..111F. doi:10.1016/j.margeo.2012.02.012.
Frappier, Brian R.; González, Luis A.; Carpenter, Scott J.; Sahagian, Dork; Frappier, Amy Benoit (1 February 2007). "Stalagmite stable isotope record of recent tropical cyclone events". Geology. 35 (2): 111–114. Bibcode:2007Geo....35..111B. doi:10.1130/G23145A.1. ISSN0091-7613.
Frappier, Amy Benoit; Pyburn, James; Pinkey-Drobnis, Aurora D.; Wang, Xianfeng; Corbett, D. Reide; Dahlin, Bruce H. (2014-07-28). "Two millennia of tropical cyclone-induced mud layers in a northern Yucatán stalagmite: Multiple overlapping climatic hazards during the Maya Terminal Classic "megadroughts": Frappier et al.: Mud and the Maya". Geophysical Research Letters. 41 (14): 5148–5157. doi:10.1002/2014GL059882. hdl:10356/104967. S2CID53695062.
Grissino-Mayer, Henri D.; Miller, Dana L.; Mora, Claudia I. (2010), Stoffel, Markus; Bollschweiler, Michelle; Butler, David R.; Luckman, Brian H. (eds.), "Dendrotempestology and the Isotopic Record of Tropical Cyclones in Tree Rings of the Southeastern United States", Tree Rings and Natural Hazards: A State-of-Art, Advances in Global Change Research, Springer Netherlands, pp.291–303, doi:10.1007/978-90-481-8736-2_28, ISBN9789048187362
Hansom, J.D.; Hall, A.M. (February 2009). "Magnitude and frequency of extra-tropical North Atlantic cyclones: A chronology from cliff-top storm deposits". Quaternary International. 195 (1–2): 42–52. Bibcode:2009QuInt.195...42H. doi:10.1016/j.quaint.2007.11.010.
Harris, M. Scott; Martin, Ronald E.; Hippensteel, Scott P. (1 January 2005). "Records of prehistoric hurricanes on the South Carolina coast based on micropaleontological and sedimentological evidence, with comparison to other Atlantic Coast records: Discussion". GSA Bulletin. 117 (1–2): 250–253. Bibcode:2005GSAB..117..250H. doi:10.1130/B25535.1. ISSN0016-7606.
Kolodny, Yehoshua; Calvo, Ran; Rosenfeld, Daniel (September 2009). ""Too low" δ18O of paleo-meteoric, low latitude, water; do paleo-tropical cyclones explain it?". Palaeogeography, Palaeoclimatology, Palaeoecology. 280 (3–4): 387–395. Bibcode:2009PPP...280..387K. doi:10.1016/j.palaeo.2009.06.025.
Krencker, François-Nicolas; Bodin, Stéphane; Suan, Guillaume; Heimhofer, Ulrich; Kabiri, Lahcen; Immenhauser, Adrian (September 2015). "Toarcian extreme warmth led to tropical cyclone intensification". Earth and Planetary Science Letters. 425: 120–130. Bibcode:2015E&PSL.425..120K. doi:10.1016/j.epsl.2015.06.003.
Lane, Philip; Donnelly, Jeffrey P.; Woodruff, Jonathan D.; Hawkes, Andrea D. (September 2011). "A decadally-resolved paleohurricane record archived in the late Holocene sediments of a Florida sinkhole". Marine Geology. 287 (1–4): 14–30. Bibcode:2011MGeol.287...14L. doi:10.1016/j.margeo.2011.07.001. hdl:1912/4943.
LeBlanc, Allison R.; Kennedy, Lisa M.; Liu, Kam-biu; Lane, Chad S. (2017-08-01). "Linking hurricane landfalls, precipitation variability, fires, and vegetation response over the past millennium from analysis of coastal lagoon sediments, southwestern Dominican Republic". Journal of Paleolimnology. 58 (2): 135–150. Bibcode:2017JPall..58..135L. doi:10.1007/s10933-017-9965-z. ISSN1573-0417. S2CID132624091.
Liu, Kam-Biu (2004), "Paleotempestology: Geographic Solutions to Hurricane Hazard Assessment and Risk Prediction", in Janelle, Donald G.; Warf, Barney; Hansen, Kathy (eds.), WorldMinds: Geographical Perspectives on 100 Problems: Commemorating the 100th Anniversary of the Association of American Geographers 1904–2004, Springer Netherlands, pp.443–448, doi:10.1007/978-1-4020-2352-1_72, ISBN9781402023521
Liu, K.; Knowles, J. T. (2008-12-01). "Proxy Record of Holocene Hurricane Activity from Barbuda in the Northeastern Caribbean". AGU Fall Meeting Abstracts. 14: U14B–02. Bibcode:2008AGUFM.U14B..02L.
Liu, Entao; Zhao, Jian-xin; Feng, Yue-xing; Leonard, Nicole D.; Clark, Tara R.; Roff, George (July 2016). "U-Th age distribution of coral fragments from multiple rubble ridges within the Frankland Islands, Great Barrier Reef: Implications for past storminess history". Quaternary Science Reviews. 143: 51–68. Bibcode:2016QSRv..143...51L. doi:10.1016/j.quascirev.2016.05.006.
Madsen, A.T.; Duller, G.A.T.; Donnelly, J.P.; Roberts, H.M.; Wintle, A.G. (August 2009). "A chronology of hurricane landfalls at Little Sippewissett Marsh, Massachusetts, USA, using optical dating". Geomorphology. 109 (1–2): 36–45. Bibcode:2009Geomo.109...36M. doi:10.1016/j.geomorph.2008.08.023.
McCloskey, T.A.; Keller, G. (February 2009). "5000 year sedimentary record of hurricane strikes on the central coast of Belize". Quaternary International. 195 (1–2): 53–68. Bibcode:2009QuInt.195...53M. doi:10.1016/j.quaint.2008.03.003.
Medina-Elizalde, Martín; Polanco-Martínez, Josué Moises; Lases-Hernández, Fernanda; Bradley, Raymond; Burns, Stephen (September 2016). "Testing the "tropical storm" hypothesis of Yucatan Peninsula climate variability during the Maya Terminal Classic Period". Quaternary Research. 86 (2): 111–119. Bibcode:2016QuRes..86..111M. doi:10.1016/j.yqres.2016.05.006. ISSN0033-5894. S2CID133374197– via ResearchGate.
Muller, Joanne; Collins, Jennifer M.; Gibson, Samantha; Paxton, Leilani (2017), Collins, Jennifer M.; Walsh, Kevin (eds.), "Recent Advances in the Emerging Field of Paleotempestology", Hurricanes and Climate Change: Volume 3, Springer International Publishing, pp.1–33, doi:10.1007/978-3-319-47594-3_1, ISBN9783319475943, S2CID133456333
Muller, Joanne; Ercolani, Christian; Collins, Jennifer; Ellis, Shelby (April 2022). "Multi-proxy characterization of storm deposits on Sanibel Island, Florida: A modern analog for paleotempestology". Geomorphology. 402: 108148. Bibcode:2022Geomo.40208148M. doi:10.1016/j.geomorph.2022.108148. S2CID246670052.
Nott, Jonathan; Haig, Jordahna; Neil, Helen; Gillieson, David (March 2007). "Greater frequency variability of landfalling tropical cyclones at centennial compared to seasonal and decadal scales". Earth and Planetary Science Letters. 255 (3–4): 367–372. Bibcode:2007E&PSL.255..367N. doi:10.1016/j.epsl.2006.12.023.
Oliva, F.; Peros, M. C.; Viau, A. E. (2016-02-01). "Use of X-Ray Fluorescence (XRF) in Atlantic Basin Paleotempestology". American Geophysical Union, Ocean Sciences Meeting. 14: MG14A–1900. Bibcode:2016AGUOSMG14A1900O.
Oliva, Frank; Peros, Matthew; Viau, André (1 April 2017). "A review of the spatial distribution of and analytical techniques used in paleotempestological studies in the western North Atlantic Basin". Progress in Physical Geography: Earth and Environment. 41 (2): 171–190. doi:10.1177/0309133316683899. ISSN0309-1333. S2CID132039002.
Oliva, F.; Peros, M.C.; Viau, A.E.; Reinhardt, E.G.; Nixon, F.C.; Morin, A. (December 2018). "A multi-proxy reconstruction of tropical cyclone variability during the past 800 years from Robinson Lake, Nova Scotia, Canada". Marine Geology. 406: 84–97. Bibcode:2018MGeol.406...84O. doi:10.1016/j.margeo.2018.09.012. S2CID135272487.
Park, Lisa E. (1 February 2012). "Comparing Two Long-Term Hurricane Frequency and Intensity Records from San Salvador Island, Bahamas". Journal of Coastal Research. 28 (4): 891. doi:10.2112/JCOASTRES-D-11-00065.1. S2CID130374181.
Peros, Matthew; Gregory, Braden; Matos, Felipe; Reinhardt, Eduard; Desloges, Joseph (2015-09-01). "Late-Holocene record of lagoon evolution, climate change, and hurricane activity from southeastern Cuba". The Holocene. 25 (9): 1483–1497. Bibcode:2015Holoc..25.1483P. doi:10.1177/0959683615585844. ISSN0959-6836. S2CID140169114.
Scileppi, Elyse; Donnelly, Jeffrey P. (June 2007). "Sedimentary evidence of hurricane strikes in western Long Island, New York: HURRICANE STRIKES IN NEW YORK". Geochemistry, Geophysics, Geosystems. 8 (6): n/a. doi:10.1029/2006GC001463. hdl:1912/1786. S2CID52888698.
Toomey, Michael R.; Curry, William B.; Donnelly, Jeffrey P.; van Hengstum, Peter J. (March 2013). "Reconstructing 7000 years of North Atlantic hurricane variability using deep-sea sediment cores from the western Great Bahama Bank: A 7000 YR RECORD OF HURRICANE ACTIVITY". Paleoceanography. 28 (1): 31–41. doi:10.1002/palo.20012. hdl:1912/5928.
Urquhart, Gerald R. (February 2009). "Paleoecological record of hurricane disturbance and forest regeneration in Nicaragua". Quaternary International. 195 (1–2): 88–97. Bibcode:2009QuInt.195...88U. doi:10.1016/j.quaint.2008.05.012.
Woodruff, Jonathan D.; Donnelly, Jeffrey P.; Mohrig, David; Geyer, Wayne R. (2008). "Reconstructing relative flooding intensities responsible for hurricane-induced deposits from Laguna Playa Grande, Vieques, Puerto Rico". Geology. 36 (5): 391. Bibcode:2008Geo....36..391W. doi:10.1130/G24731A.1.
Woodruff, Jonathan D.; Donnelly, Jeffrey P.; Okusu, Akiko (August 2009). "Exploring typhoon variability over the mid-to-late Holocene: evidence of extreme coastal flooding from Kamikoshiki, Japan". Quaternary Science Reviews. 28 (17–18): 1774–1785. Bibcode:2009QSRv...28.1774W. doi:10.1016/j.quascirev.2009.02.005. hdl:1912/2988.
van Hengstum, Peter J.; Donnelly, Jeffrey P.; Toomey, Michael R.; Albury, Nancy A.; Lane, Philip; Kakuk, Brian (September 2014). "Heightened hurricane activity on the Little Bahama Bank from 1350 to 1650 AD". Continental Shelf Research. 86: 103–115. Bibcode:2014CSR....86..103V. doi:10.1016/j.csr.2013.04.032.
van Hengstum, Peter J.; Donnelly, Jeffrey P.; Kingston, Andrew W.; Williams, Bruce E.; Scott, David B.; Reinhardt, Eduard G.; Little, Shawna N.; Patterson, William P. (February 2015). "Low-frequency storminess signal at Bermuda linked to cooling events in the North Atlantic region". Paleoceanography. 30 (2): 52–76. Bibcode:2015PalOc..30...52V. doi:10.1002/2014PA002662. hdl:1912/7256. S2CID128392417.
Yang, Dong Yoon; Han, Min; Kim, Jin Cheul; Cho, Yang-Ki; Kim, Ju-Yong; Yi, Sangheon; Katsuki, Kota; Williams, Harry F.L. (December 2017). "Shell and gravel layers caused by storm-induced rip currents during the Medieval Warm Period and Little Ice Age in South Korea". Palaeogeography, Palaeoclimatology, Palaeoecology. 487: 204–215. Bibcode:2017PPP...487..204Y. doi:10.1016/j.palaeo.2017.08.035.
Yu, Ke-Fu; Zhao, Jian-Xin; Shi, Qi; Meng, Qing-Shan (February 2009). "Reconstruction of storm/tsunami records over the last 4000 years using transported coral blocks and lagoon sediments in the southern South China Sea". Quaternary International. 195 (1–2): 128–137. Bibcode:2009QuInt.195..128Y. doi:10.1016/j.quaint.2008.05.004.
Yue, Yuanfu; Yu, Kefu; Tao, Shichen; Zhang, Huiling; Liu, Guohui; Wang, Ning; Jiang, Wei; Fan, Tianla; Lin, Wuhui (May 2019). "3500-year western Pacific storm record warns of additional storm activity in a warming warm pool". Palaeogeography, Palaeoclimatology, Palaeoecology. 521: 57–71. Bibcode:2019PPP...521...57Y. doi:10.1016/j.palaeo.2019.02.009. S2CID134190655.
Zhou, Liang; Yang, Yang; Wang, Zhanghua; Jia, Jianjun; Mao, Longjiang; Li, Zhanhai; Fang, Xin; Gao, Shu (1 October 2019). "Investigating ENSO and WPWP modulated typhoon variability in the South China Sea during the mid–late Holocene using sedimentological evidence from southeastern Hainan Island, China". Marine Geology. 416: 105987. Bibcode:2019MGeol.416j5987Z. doi:10.1016/j.margeo.2019.105987. ISSN0025-3227. S2CID199843694.
Zhou, Liang; Gao, Shu; Jia, Jianjun; Zhang, Yuzhu; Yang, Yang; Mao, Longjiang; Fang, Xin; Shulmeister, James (1 October 2019). "Extracting historic cyclone data from coastal dune deposits in eastern Hainan Island, China". Sedimentary Geology. 392: 105524. Bibcode:2019SedG..39205524Z. doi:10.1016/j.sedgeo.2019.105524. ISSN0037-0738. S2CID203103902.
Liu, Kam-biu (2004). "Paleotempestology: Principles, Methods, and Examples from Gulf Coast Lake Sediments". In Murnane, R. J.; Liu, Kam-biu (eds.). Hurricanes and Typhoons: Past, Present, and Future. New York: Columbia University Press. pp.13–57. ISBN978-0-231-12388-4.
Liu, Kam-biu (2007). "Paleotempestology". In Elias, Scott A. (ed.). Encyclopedia of Quaternary Science. Vol.3. Amsterdam: Elsevier. pp.1978–1986. ISBN978-0-444-51922-1.
Nott, Jonathan (2004). "Palaeotempestology: the study of prehistoric tropical cyclones—a review and implications for hazard assessment". Environment International. 30 (3): 433–447. doi:10.1016/j.envint.2003.09.010. PMID14987874.
This page is based on this Wikipedia article Text is available under the CC BY-SA 4.0 license; additional terms may apply. Images, videos and audio are available under their respective licenses.