Opinion polling for UK general elections |
---|
1979 election |
Opinion polls |
1983 election |
Opinion polls |
1987 election |
Opinion polls |
1992 election |
Opinion polls |
1997 election |
Opinion polls |
In the run-up to the 1987 general election, various organisations carried out opinion polling to gauge voting intention. Results of such polls are displayed in this article. The date range for these opinion polls are from the 1983 general election until 10 June 1987.
All Data from UK polling Report [1]
Survey end date | Pollster | Client | Con | Lab | All | Lead |
---|---|---|---|---|---|---|
11 Jun | 1987 general election | 42.2% | 30.8% | 22.6% | 11.4% | |
10 Jun | Marplan | The Guardian | 42% | 35% | 21% | 7% |
10 Jun | MORI | The Times | 44% | 32% | 22% | 12% |
9 Jun | Marplan | Today | 43% | 35% | 21% | 8% |
9 Jun | Audience Selection | N/A | 43% | 34% | 21% | 9% |
9 Jun | Gallup | The Daily Telegraph | 41% | 34% | 23.5% | 7% |
9 Jun | Harris | TV-AM | 42% | 35% | 21% | 7% |
8 Jun | Marplan | The Guardian | 45% | 32% | 21% | 13% |
6 Jun | Harris | TV-AM | 43% | 33% | 22% | 10% |
5 Jun | Marplan | Today | 43% | 35% | 21% | 8% |
5 Jun | Gallup | The Sunday Telegraph | 41.5% | 34.5% | 22.5% | 7% |
4 Jun | Marplan | The Guardian | 44% | 34% | 20% | 10% |
4 Jun | Harris | The Observer | 44% | 33% | 21% | 11% |
4 Jun | MORI | The Sunday Times | 43% | 32% | 24% | 11% |
3 Jun | Gallup | The Daily Telegraph | 40.5% | 36.5% | 21.5% | 4% |
1 Jun | Marplan | Today | 44% | 33% | 21% | 11% |
31 May | Harris | N/A | 42% | 35% | 21% | 7% |
29 May | Harris | TV-AM | 45% | 32% | 22% | 13% |
29 May | Gallup | The Sunday Telegraph | 41.5% | 34% | 22.5% | 7.5% |
28 May | Marplan | The Guardian | 44% | 32% | 21% | 12% |
28 May | Harris | The Observer | 41% | 37% | 21% | 4% |
28 May | MORI | The Sunday Times | 44% | 32% | 23% | 12% |
27 May | Gallup | The Daily Telegraph | 44.5% | 36% | 18% | 8.5% |
26 May | Marplan | Today | 42% | 35% | 20% | 7% |
25 May | Harris | TV-AM | 42% | 37% | 21% | 5% |
24 May | MORI | N/A | 44% | 31% | 24% | 13% |
22 May | Gallup | The Sunday Telegraph | 42% | 33% | 23% | 9% |
21 May | Marplan | The Guardian | 41% | 33% | 21% | 8% |
21 May | Harris | TV-AM | 43% | 36% | 20% | 7% |
21 May | MORI | The Sunday Times | 44% | 31% | 24% | 13% |
21 May | Harris | The Observer | 41% | 34% | 22% | 7% |
20 May | Gallup | N/A | 42% | 33% | 23% | 9% |
20 May | NOP | N/A | 41% | 33% | 23% | 8% |
18 May | Marplan | Today | 41% | 33% | 24% | 8% |
18 May | The Dissolution of the 49th Parliament and campaigning officially begins | |||||
17 May | Harris | TV-AM | 42% | 32% | 24% | 10% |
15 May | Harris | The Observer | 42% | 33% | 23% | 9% |
14 May | MORI | The Sunday Times | 44% | 30% | 25% | 14% |
13 May | Marplan | Daily Express | 41% | 30% | 26% | 11% |
12 May | Marplan | The Guardian | 43% | 29% | 25% | 14% |
12 May | MORI | N/A | 44% | 31% | 23% | 13% |
11 May | NOP | Evening Standard | 46% | 28% | 25% | 18% |
11 May | Gallup | The Daily Telegraph | 39% | 28% | 30% | 9% |
7 May | Harris | London Weekend Television | 44% | 33% | 21% | 11% |
7 May | 1987 local elections [2] | |||||
4 May | NOP | The Independent | 39% | 34% | 25% | 5% |
3 May | Harris | TV-AM | 44% | 30% | 25% | 14% |
30 Apr | MORI | The Sunday Times | 44% | 31% | 23% | 13% |
27 Apr | Harris | Capital Radio | 42% | 31% | 25% | 11% |
27 Apr | Marplan | Today | 39% | 33% | 24% | 6% |
23 Apr | Harris | The Observer | 42% | 31% | 25% | 11% |
15 Apr | NOP | Evening Standard | 44% | 29% | 25% | 15% |
13 Apr | Gallup | The Daily Telegraph | 40.5% | 28% | 29% | 11.5% |
12 Apr | MORI | Evening Standard | 42% | 29% | 26% | 13% |
10 Apr | Marplan | Press Association | 40% | 30% | 27% | 10% |
7 Apr | Marplan | The Guardian | 38% | 32% | 27% | 6% |
5 Apr | Harris | TV-AM | 43% | 30% | 26% | 13% |
2 Apr | MORI | The Sunday Times | 41% | 29% | 29% | 12% |
2 Apr | Marplan | Daily Express | 39% | 29% | 30% | 9% |
24 Mar | Marplan | Today | 36% | 31% | 31% | 5% |
23 Mar | Gallup | The Daily Telegraph | 37.5% | 29.5% | 31.5% | 6% |
20 Mar | MORI | The Sunday Times | 39% | 33% | 26% | 6% |
19 Mar | Harris | The Observer | 39% | 33% | 26% | 6% |
17 Mar | Gallup | The Sunday Telegraph | 38.5% | 30% | 30.5% | 8% |
12 Mar | Truro by-election | |||||
10 Mar | Marplan | The Guardian | 38% | 32% | 27% | 6% |
10 Mar | MORI | The Sunday Times | 41% | 32% | 25% | 9% |
2 Mar | NOP | Evening Standard | 39% | 34% | 25% | 5% |
1 Mar | Harris | TV-AM | 36% | 33% | 29% | 3% |
26 Feb | Greenwich by-election | |||||
25 Feb | MORI | The Sunday Times | 41% | 35% | 21% | 6% |
19 Feb | Harris | The Observer | 39% | 37% | 23% | 2% |
16 Feb | Gallup | The Daily Telegraph | 36% | 34.5% | 27.5% | 1.5% |
10 Feb | Marplan | The Guardian | 38% | 35% | 25% | 3% |
10 Feb | MORI | The Sunday Times | 39% | 36% | 23% | 3% |
9 Feb | NOP | Evening Standard | 39% | 37% | 23% | 2% |
1 Feb | Harris | TV-AM | 37% | 39% | 22% | 2% |
28 Jan | NOP | Channel 4 | 38% | 40% | 20% | 2% |
28 Jan | MORI | The Sunday Times | 39% | 38% | 21% | 1% |
27 Jan | Marplan | Today | 38.5% | 38.5% | 20% | Tie |
22 Jan | Harris | The Observer | 44% | 36% | 18% | 8% |
20 Jan | Gallup | The Daily Telegraph | 34.5% | 39.5% | 23.5% | 5% |
14 Jan | NOP | Evening Standard | 42% | 37% | 19% | 5% |
12 Jan | Marplan | The Guardian | 38% | 36% | 23% | 2% |
11 Jan | Harris | TV-AM | 42% | 37% | 20% | 5% |
Survey end date | Pollster | Client | Con | Lab | All | Lead |
---|---|---|---|---|---|---|
30 Dec | MORI | The Sunday Times | 39% | 38% | 21% | 1% |
15 Dec | Gallup | N/A | 41% | 32.5% | 23.5% | 8.5% |
12 Dec | MORI | The Sunday Times | 41% | 39% | 19% | 2% |
8 Dec | Marplan | The Guardian | 39% | 38% | 21% | 1% |
7 Dec | Harris | TV-AM | 41% | 35% | 22% | 6% |
3 Dec | NOP | N/A | 41% | 38% | 19.5% | 3% |
26 Nov | MORI | Evening Standard | 41% | 39% | 18% | 2% |
24 Nov | Marplan | Today | 39% | 38% | 20% | 1% |
17 Nov | Gallup | The Daily Telegraph | 36% | 39.5% | 22% | 3.5% |
13 Nov | Knowsley North by-election | |||||
12 Nov | MORI | N/A | 39% | 41% | 18% | 2% |
11 Nov | NOP | N/A | 41% | 38% | 18% | 3% |
11 Nov | Marplan | The Guardian | 39% | 36% | 23% | 3% |
4 Nov | MORI | The Sunday Times | 40% | 39% | 18% | 1% |
2 Nov | Harris | TV-AM | 40% | 36% | 21% | 4% |
24 Oct | Marplan | Press Association | 41% | 37.5% | 19% | 3.5% |
22 Oct | MORI | Evening Standard | 39% | 41% | 17% | 2% |
20 Oct | Gallup | The Daily Telegraph | 37.5% | 37.5% | 22% | Tie |
20 Oct | Marplan | Today | 40% | 41% | 17% | 1% |
9 Oct | N/A | N/A | 36% | 39% | 23% | 3% |
7 Oct | Marplan | The Guardian | 36% | 39% | 23% | 3% |
3 Oct | Harris | The Observer | 38% | 41% | 20% | 3% |
23 Sep | Marplan | Today | 34% | 40% | 24% | 6% |
23 Sep | MORI | Evening Standard | 35% | 37% | 26% | 2% |
15 Sep | Gallup | The Daily Telegraph | 32.5% | 38% | 27.5% | 5.5% |
9 Sep | Marplan | The Guardian | 34% | 40% | 24% | 6% |
27 Aug | Marplan | Today | 35% | 38% | 24% | 3% |
19 Aug | MORI | Evening Standard | 37% | 37% | 24% | Tie |
11 Aug | Gallup | The Daily Telegraph | 30% | 36.5% | 30% | 6.5% |
11 Aug | Marplan | The Guardian | 32% | 38% | 27% | 6% |
31 Jul | MORI | The Times | 32% | 41% | 25% | 9% |
29 Jul | Marplan | Today on S | 29.5% | 41% | 27.5% | 11.5% |
22 Jul | MORI | Evening Standard | 36% | 37% | 25% | 1% |
17 Jul | Newcastle-under-Lyme by-election | |||||
14 Jul | Gallup | The Daily Telegraph | 33% | 38% | 27% | 5% |
14 Jul | Marplan | The Guardian | 31% | 38% | 28% | 7% |
24 Jun | MORI | Evening Standard | 34% | 40% | 23% | 6% |
16 Jun | Gallup | The Daily Telegraph | 34% | 39% | 24.5% | 5% |
16 Jun | Marplan | The Guardian | 33% | 39% | 26% | 6% |
12 Jun | Harris | The Observer | 31% | 40% | 25% | 9% |
21 May | MORI | Evening Standard | 32% | 40% | 26% | 8% |
19 May | Marplan | The Guardian | 28% | 39% | 30% | 9% |
12 May | Gallup | The Daily Telegraph | 27.5% | 37% | 32.5% | 4.5% |
8 May | West Derbyshire & Ryedale by-elections [3] | |||||
8 May | 1986 local elections [4] | |||||
2 May | MORI | The Sunday Times | 36% | 38% | 23% | 2% |
22 Apr | MORI | Evening Standard | 34% | 39% | 25% | 5% |
21 Apr | Gallup | The Daily Telegraph | 33.5% | 38% | 26% | 4.5% |
14 Apr | Gallup | The Daily Telegraph | 28% | 38.5% | 31.5% | 7% |
10 Apr | Fulham by-election | |||||
8 Apr | Marplan | The Guardian | 32% | 35% | 30% | 3% |
26 Mar | MORI | N/A | 34% | 36% | 28% | 2% |
24 Mar | Gallup | The Daily Telegraph | 29.5% | 34% | 34.5% | 0.5% |
21 Mar | MORI | The Sunday Times | 31% | 39% | 28% | 8% |
10 Mar | Marplan | The Guardian | 32% | 35% | 31% | 3% |
26 Feb | MORI | Evening Standard | 34% | 35% | 30% | 1% |
12 Feb | MORI | The Sunday Times | 33% | 37% | 29% | 4% |
10 Feb | Gallup | The Daily Telegraph | 29.5% | 35.5% | 33.5% | 2% |
10 Feb | Marplan | The Guardian | 27% | 36% | 35% | 1% |
24 Jan | Harris | The Observer | 31% | 36% | 30% | 5% |
23 Jan | 1986 Northern Ireland by-elections [5] | |||||
13 Jan | Gallup | The Daily Telegraph | 29.5% | 34% | 35% | 1% |
12 Jan | Marplan | The Guardian | 29% | 36% | 33% | 3% |
12 Jan | Harris | ITN | 32% | 33% | 31% | 2% |
8 Jan | MORI | Evening Standard | 33% | 38% | 28% | 5% |
Survey end date | Pollster | Client | Con | Lab | All | Lead |
---|---|---|---|---|---|---|
9 Dec | Gallup | The Daily Telegraph | 33% | 32.5% | 32.5% | 0.5% |
9 Dec | Marplan | The Guardian | 35% | 33% | 30% | 2% |
8 Dec | MORI | N/A | 35% | 35% | 28% | Tie |
5 Dec | Tyne Bridge by-election | |||||
24 Nov | MORI | Evening Standard | 36% | 36% | 25% | Tie |
11 Nov | Gallup | The Daily Telegraph | 35% | 34% | 29.5% | 1% |
11 Nov | Marplan | The Guardian | 34% | 35% | 29% | 1% |
21 Oct | Gallup | The Daily Telegraph | 32% | 38% | 28% | 6% |
20 Oct | MORI | Evening Standard | 37% | 36% | 25% | 1% |
19 Oct | NOP | Mail on Sunday | 37% | 34% | 28% | 3% |
14 Oct | Marplan | The Guardian | 32% | 34% | 32% | 2% |
4 Oct | Harris | The Observer | 32% | 39% | 27% | 7% |
3 Oct | MORI | The Times | 34% | 36% | 28% | 2% |
29 Sep | Harris | Thames | 33% | 32% | 32% | 1% |
22 Sep | MORI | Evening Standard | 30% | 33% | 35% | 2% |
16 Sep | Gallup | The Daily Telegraph | 29% | 29.5% | 39% | 9.5% |
16 Sep | Marplan | The Guardian | 31% | 32% | 36% | 4% |
8 Sep | MORI | Evening Standard | 31% | 37% | 31% | 6% |
7 Sep | Harris | London Weekend Television | 35% | 36% | 26% | 1% |
3 Sep | Marplan | The Guardian | 30% | 34% | 35% | 1% |
18 Aug | MORI | Evening Standard | 31% | 35% | 31% | 4% |
12 Aug | Gallup | The Daily Telegraph | 24% | 40% | 34% | 6% |
12 Aug | Marplan | The Guardian | 31% | 36% | 31% | 5% |
9 Aug | MORI | The Sunday Times | 33% | 37% | 29% | 4% |
21 Jul | MORI | Evening Standard | 33% | 34% | 31% | 1% |
15 Jul | Gallup | The Daily Telegraph | 27.5% | 38% | 32.5% | 5.5% |
8 Jul | Marplan | The Guardian | 31% | 34% | 33% | 1% |
4 Jul | Brecon and Radnor by-election | |||||
23 Jun | MORI | Evening Standard | 35% | 36% | 27% | 1% |
21 Jun | MORI | The Sunday Times | 32% | 40% | 26% | 8% |
17 Jun | Gallup | The Daily Telegraph | 34.5% | 34.5% | 30% | Tie |
10 Jun | Marplan | The Guardian | 31% | 36% | 32% | 4% |
26 May | MORI | Evening Standard | 33% | 35% | 30% | 2% |
13 May | MORI | The Sunday Times | 34% | 36% | 28% | 2% |
13 May | Gallup | The Daily Telegraph | 30.5% | 34% | 33.5% | 0.5% |
13 May | Marplan | The Guardian | 29% | 35% | 35% | Tie |
2–15 May | 1985 local elections [6] [7] | |||||
28 Apr | MORI | Evening Standard | 38% | 37% | 24% | 1% |
22 Apr | Gallup | The Daily Telegraph | 34% | 37.5% | 26.5% | 2.5% |
15 Apr | Marplan | The Guardian | 33% | 38% | 28% | 5% |
25 Mar | Gallup | The Daily Telegraph | 33% | 39.5% | 25.5% | 6.5% |
24 Mar | MORI | Evening Standard | 36% | 40% | 23% | 4% |
22 Mar | MORI | The Sunday Times | 37% | 39% | 22% | 2% |
11 Mar | Marplan | The Guardian | 36% | 36% | 27% | Tie |
8 Mar | NOP | Mail on Sunday | 35% | 35% | 26% | Tie |
7 Mar | Harris | The Observer | 40% | 38% | 19% | 2% |
25 Feb | Marplan | The Guardian | 38% | 36% | 25% | 2% |
24 Feb | MORI | Evening Standard | 39% | 35% | 24% | 4% |
18 Feb | MORI | London Weekend Television | 38% | 40% | 19% | 2% |
11 Feb | Gallup | The Daily Telegraph | 35% | 32% | 31.5% | 3% |
11 Feb | Marplan | The Guardian | 38% | 35% | 26% | 3% |
6 Feb | MORI | The Sunday Times | 37% | 37% | 24% | Tie |
14 Jan | Gallup | The Daily Telegraph | 39% | 33% | 25.5% | 6% |
14 Jan | Marplan | The Guardian | 41% | 33% | 25% | 8% |
7 Jan | MORI | Evening Standard | 42% | 34% | 21% | 8% |
8 Jan | NOP | Daily Mail | 33% | 38% | 28% | 5% |
Survey end date | Pollster | Client | Con | Lab | All | Lead |
---|---|---|---|---|---|---|
28 Dec | MORI | The Sunday Times | 38% | 36% | 25% | 2% |
14 Dec | Enfield Southgate by-election | |||||
10 Dec | Gallup | The Daily Telegraph | 39.5% | 31% | 27.5% | 8.5% |
10 Dec | Marplan | The Guardian | 41% | 32% | 26% | 9% |
10 Dec | MORI | N/A | 40% | 36% | 22% | 4% |
7 Dec | MORI | The Sunday Times | 41% | 37% | 20% | 4% |
19 Nov | MORI | Evening Standard | 43% | 35% | 19% | 8% |
12 Nov | Gallup | The Daily Telegraph | 44.5% | 30.5% | 23.5% | 14% |
5 Nov | Marplan | The Guardian | 42% | 33% | 24% | 9% |
22 Oct | Gallup | The Daily Telegraph | 44.5% | 32% | 21.5% | 12.5% |
22 Oct | MORI | Evening Standard | 44% | 35% | 20% | 9% |
8 Oct | Marplan | The Guardian | 38% | 37% | 23% | 1% |
4 Oct | MORI | The Sunday Times | 43% | 35% | 19% | 8% |
24 Sep | Marplan | The Guardian | 38% | 36% | 24% | 2% |
21 Sep | MORI | Evening Standard | 42% | 36% | 20% | 6% |
11 Sep | Marplan | The Guardian | 39% | 38% | 21% | 1% |
10 Sep | Gallup | The Daily Telegraph | 37% | 36% | 25.5% | 1% |
10 Sep | MORI | The Times | 40% | 39% | 19% | 1% |
29 Aug | MORI | The Sunday Times | 39% | 40% | 19% | 1% |
20 Aug | MORI | Evening Standard | 39% | 39% | 21% | Tie |
13 Aug | Gallup | The Daily Telegraph | 36% | 39% | 22.5% | 3% |
13 Aug | Marplan | The Guardian | 36% | 39% | 24% | 3% |
23 Jul | MORI | N/A | 37% | 40% | 20% | 3% |
16 Jul | Gallup | The Daily Telegraph | 37.5% | 38.5% | 22% | 1% |
10 Jul | Marplan | The Guardian | 34.5% | 39% | 25.5% | 4.5% |
25 Jun | MORI | Evening Standard | 39% | 39% | 21% | Tie |
16 Jun | Marplan | Sunday Mirror | 38% | 39% | 22% | 1% |
14 Jun | Portsmouth South by-election [8] | |||||
14 Jun | 1984 European Parliament election [9] | |||||
11 Jun | Gallup | The Daily Telegraph | 37.5% | 38% | 23% | 0.5% |
11 Jun | Marplan | The Guardian | 37% | 38% | 23% | 1% |
8 Jun | MORI | The Sunday Times | 42% | 38% | 18% | 4% |
29 May | MORI | Evening Standard | 40% | 38% | 21% | 2% |
14 May | Gallup | The Daily Telegraph | 38.5% | 36.5% | 23% | 2% |
14 May | Marplan | The Guardian | 38% | 37% | 23% | 1% |
3 May | Cynon Valley, Stafford and South West Surrey by-elections | |||||
3 May | 1984 local elections [10] | |||||
1 May | MORI | Evening Standard | 40% | 39% | 20% | 1% |
25 Apr | MORI | The Sunday Times | 42% | 36% | 20% | 6% |
17 Apr | Harris | The Observer | 40% | 36% | 22% | 4% |
16 Apr | Gallup | The Daily Telegraph | 41% | 36.5% | 20.5% | 4.5% |
16 Apr | Marplan | The Guardian | 40% | 37% | 21% | 3% |
20 Mar | MORI | Evening Standard | 41% | 40% | 17% | 1% |
19 Mar | Marplan | The Guardian | 39% | 39% | 22% | Tie |
19 Mar | Gallup | The Daily Telegraph | 41% | 38.5% | 19.5% | 2.5% |
3 Mar | MORI | The Sunday Times | 38% | 41% | 18% | 3% |
1 Mar | Chesterfield by-election | |||||
20 Feb | MORI | Evening Standard | 41% | 38% | 19% | 3% |
13 Feb | Gallup | The Daily Telegraph | 43% | 33.5% | 21.5% | 9.5% |
13 Feb | Marplan | The Guardian | 39% | 40% | 20% | 1% |
20 Jan | Harris | The Observer | 43% | 36% | 18% | 7% |
20 Jan | NOP | Mail on Sunday | 45% | 33% | 20% | 12% |
16 Jan | Gallup | The Daily Telegraph | 41.5% | 38% | 19.5% | 3.5% |
16 Jan | Marplan | The Guardian | 42% | 38% | 19% | 4% |
9 Jan | MORI | Evening Standard | 42% | 37% | 19% | 5% |
Survey end date | Pollster | Client | Con | Lab | All | Lead |
---|---|---|---|---|---|---|
17 Dec | MORI | The Sunday Times | 40.5% | 39.5% | 18% | 2% |
12 Dec | Gallup | The Daily Telegraph | 42.5% | 36% | 19.5% | 6.5% |
9 Dec | MORI | N/A | 42% | 37% | 19% | 5% |
7 Dec | Marplan | The Guardian | 41% | 37% | 21% | 4% |
3 Dec | MORI | The Sunday Times | 44% | 37% | 18% | 7% |
21 Nov | MORI | N/A | 39% | 37% | 22% | 2% |
14 Nov | Gallup | The Daily Telegraph | 43.5% | 36% | 19.5% | 7.5% |
9 Nov | Marplan | The Guardian | 42% | 35% | 22% | 7% |
7 Nov | NOP | Daily Mail | 44% | 32% | 22% | 12% |
5 Nov | MORI | The Sunday Times | 43% | 35% | 20% | 8% |
24 Oct | Gallup | The Daily Telegraph | 42% | 35.5% | 20.5% | 6.5% |
24 Oct | MORI | Evening Standard | 42% | 37% | 19% | 5% |
12 Oct | Marplan | The Guardian | 42% | 37% | 20% | 5% |
6 Oct | Harris | The Observer | 42% | 39% | 18% | 3% |
2 Oct | Neil Kinnock is elected leader of the Labour Party [11] | |||||
26 Sep | MORI | N/A | 45% | 27% | 26% | 18% |
12 Sep | Gallup | The Daily Telegraph | 45.5% | 24.5% | 29% | 16.5% |
22 Aug | MORI | Daily Star | 46% | 30% | 22% | 16% |
15 Aug | Gallup | The Daily Telegraph | 44.5% | 25% | 29% | 15.5% |
10 Aug | Marplan | The Guardian | 45% | 30% | 24% | 15% |
28 Jul | Penrith and the Border by-election | |||||
25 Jul | MORI | Daily Express | 44% | 30% | 25% | 14% |
11 Jul | Gallup | The Daily Telegraph | 44% | 28.5% | 26% | 15.5% |
20 Jun | MORI | Daily Star | 43% | 27% | 29% | 14% |
13 Jun | David Owen becomes leader of the Social Democratic Party [12] | |||||
9 Jun | 1983 general election | 42.4% | 27.6% | 25.4% | 14.8% |
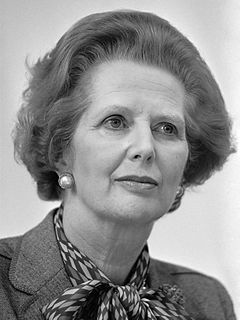
The 1983 United Kingdom general election was held on Thursday 9 June 1983. It gave the Conservative Party under the leadership of Margaret Thatcher the most decisive election victory since that of the Labour Party in 1945, with a majority of 144 seats.
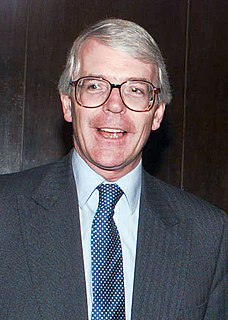
The 1992 United Kingdom general election was held on Thursday 9 April 1992, to elect 651 members to the House of Commons. The election resulted in the fourth consecutive victory for the Conservative Party since 1979 and would be the last time that the Conservatives would win an overall majority at a general election until 2015. It was also the last general election to be held on a day which didn’t coincide with any local elections until 2017. This election result took many by surprise, as opinion polling leading up to the election day had shown the Labour Party, under leader Neil Kinnock, consistently, if narrowly, ahead.
The SDP–Liberal Alliance was a centrist and social liberal political and electoral alliance in the United Kingdom.
Sheffield Hallam is a constituency represented in the House of Commons of the UK Parliament since 2019 by Olivia Blake of the Labour Party.
The 2005 United Kingdom general election was held on Thursday 5 May 2005, to elect 646 members to the House of Commons. The Labour Party, led by Tony Blair, won its third consecutive victory, with Blair becoming the second Labour leader after Harold Wilson to form three majority governments. However, its majority fell to 66 seats compared to the 167-seat majority it had won four years before. This was the first time the Labour Party had won a third consecutive election, and remains the party's most recent general election victory.
The 2010 United Kingdom general election was held on Thursday 6 May 2010, with 45,597,461 registered voters entitled to vote to elect members to the House of Commons. The election took place in 650 constituencies across the United Kingdom under the first-past-the-post system.
The shy Tory factor is a name given by British opinion polling companies to a phenomenon first observed by psephologists in the early 1990s. They observed that the share of the electoral vote won by the Conservative Party was significantly higher than the equivalent share in opinion polls. The accepted explanation was that so-called "shy Tories" were voting Conservative after telling pollsters they would not. The general elections held in 1992 and 2015 are examples where it has allegedly affected the overall results, but has also been discussed in other elections where the Conservatives did unexpectedly well. It has also been applied to the success of the Republican Party in the United States or the continued electoral victories of the People's Action Party in Singapore.
The 1987 Greenwich by-election was a by-election to the British House of Commons held on 26 February 1987, shortly before the 1987 general election. The election was caused by the death of Guy Barnett, Labour Party Member of Parliament for Greenwich on 24 December 1986.
A Glasgow Hillhead by-election was held on 25 March 1982. The by-election was caused by the death of the Conservative Party Member of Parliament for Glasgow Hillhead Tam Galbraith on 2 January 1982.
In the run-up to the general election of 2010, several polling organisations carried out opinion polling in regards to voting intention in Great Britain. Results of such polls are displayed below.
Margaret Thatcher was Prime Minister of the United Kingdom from 4 May 1979 to 28 November 1990, during which time she led a Conservative majority government. She was the first woman to hold that office. During her premiership, Thatcher moved to liberalise the British economy through deregulation, privatisation, and the promotion of entrepreneurialism.
The 2014 European Parliament election was the United Kingdom's component of the 2014 European Parliament election, held on Thursday 22 May 2014, coinciding with the 2014 local elections in England and Northern Ireland. In total, 73 Members of the European Parliament were elected from the United Kingdom using proportional representation. England, Scotland and Wales use a closed-list party list system of PR, while Northern Ireland used the single transferable vote (STV).
In the run up to the general election of 2005, several polling organisations carried out opinion polling in regards to voting intention in Great Britain. Results of such polls are displayed below.
The 2015 United Kingdom general election was held on Thursday, 7 May 2015 to elect 650 members to the House of Commons. It was the first and only general election held at the end of a Parliament under the Fixed-term Parliaments Act 2011. Local elections took place in most areas on the same day.
The 2019 United Kingdom general election was held on Thursday, 12 December 2019. It resulted in the Conservative Party receiving a landslide majority of 80 seats. The Conservatives made a net gain of 48 seats and won 43.6% of the popular vote – the highest percentage for any party since 1979.
Prior to the 2019 United Kingdom general election, various organisations carried out opinion polling to gauge voting intentions. Results of such polls are displayed in this list. Most of the pollsters listed are members of the British Polling Council (BPC) and abide by its disclosure rules. Opinion polling about attitudes to the leaders of various political parties can be found in a separate article.
In the run up to the 1992 general election, various organisations carried out opinion polling to gauge voting intention in the United Kingdom. Results of such polls are displayed in this article. The date range for these opinion polls are from the election to 8 April.
In the run-up to the 1983 general election, various organisations carried out opinion polling to gauge voting intention. Results of such polls are displayed in this article. The date ranges for these opinion polls are from the 1979 general election until 6 June 1983.
A by-election was held in the UK Parliament constituency of Brecon and Radnorshire on 1 August 2019 after Chris Davies, who had held the seat for the Conservatives since the 2015 general election, was unseated by a recall petition. The by-election was won by Jane Dodds of the Liberal Democrats.
In the run-up to the 1979 general election, various organisations carried out opinion polling to gauge voting intention. Results of such polls are displayed in this article. The date range for these opinion polls are from the October general election until 3 May 1979.