
A weather station is a facility, either on land or sea, with instruments and equipment for measuring atmospheric conditions to provide information for weather forecasts and to study the weather and climate. The measurements taken include temperature, atmospheric pressure, humidity, wind speed, wind direction, and precipitation amounts. Wind measurements are taken with as few other obstructions as possible, while temperature and humidity measurements are kept free from direct solar radiation, or insolation. Manual observations are taken at least once daily, while automated measurements are taken at least once an hour. Weather conditions out at sea are taken by ships and buoys, which measure slightly different meteorological quantities such as sea surface temperature (SST), wave height, and wave period. Drifting weather buoys outnumber their moored versions by a significant amount.
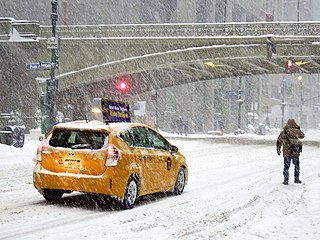
A winter storm is an event in which wind coincides with varieties of precipitation that only occur at freezing temperatures, such as snow, mixed snow and rain, or freezing rain. In temperate continental climates, these storms are not necessarily restricted to the winter season, but may occur in the late autumn and early spring as well. A snowstorm with strong winds and other conditions meeting certain criteria is called a blizzard.

A cooling tower is a device that rejects waste heat to the atmosphere through the cooling of a coolant stream, usually a water stream, to a lower temperature. Cooling towers may either use the evaporation of water to remove process heat and cool the working fluid to near the wet-bulb air temperature or, in the case of dry cooling towers, rely solely on air to cool the working fluid to near the dry-bulb air temperature using radiators.

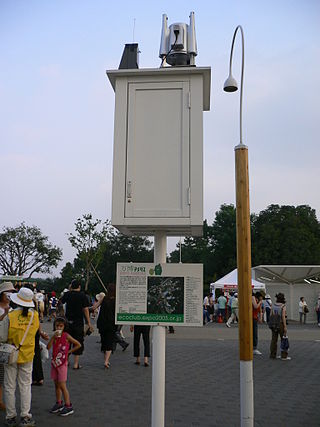
An automatic weather station (AWS) is an automated version of the traditional weather station, either to save human labor or to enable measurements from remote areas. An AWS will typically consist of a weather-proof enclosure containing the data logger, rechargeable battery, telemetry (optional) and the meteorological sensors with an attached solar panel or wind turbine and mounted upon a mast. The specific configuration may vary due to the purpose of the system. The system may report in near real time via the Argos System, LoRa and the Global Telecommunications System, or save the data for later recovery.
The United States Environmental Protection Agency (EPA) Storm Water Management Model (SWMM) is a dynamic rainfall–runoff–subsurface runoff simulation model used for single-event to long-term (continuous) simulation of the surface/subsurface hydrology quantity and quality from primarily urban/suburban areas. It can simulate the Rainfall- runoff, runoff, evaporation, infiltration and groundwater connection for roots, streets, grassed areas, rain gardens and ditches and pipes, for example. The hydrology component of SWMM operates on a collection of subcatchment areas divided into impervious and pervious areas with and without depression storage to predict runoff and pollutant loads from precipitation, evaporation and infiltration losses from each of the subcatchment. Besides, low impact development (LID) and best management practice areas on the subcatchment can be modeled to reduce the impervious and pervious runoff. The routing or hydraulics section of SWMM transports this water and possible associated water quality constituents through a system of closed pipes, open channels, storage/treatment devices, ponds, storages, pumps, orifices, weirs, outlets, outfalls and other regulators.

Weather buoys are instruments which collect weather and ocean data within the world's oceans, as well as aid during emergency response to chemical spills, legal proceedings, and engineering design. Moored buoys have been in use since 1951, while drifting buoys have been used since 1979. Moored buoys are connected with the ocean bottom using either chains, nylon, or buoyant polypropylene. With the decline of the weather ship, they have taken a more primary role in measuring conditions over the open seas since the 1970s. During the 1980s and 1990s, a network of buoys in the central and eastern tropical Pacific Ocean helped study the El Niño-Southern Oscillation. Moored weather buoys range from 1.5–12 metres (5–40 ft) in diameter, while drifting buoys are smaller, with diameters of 30–40 centimetres (12–16 in). Drifting buoys are the dominant form of weather buoy in sheer number, with 1250 located worldwide. Wind data from buoys has smaller error than that from ships. There are differences in the values of sea surface temperature measurements between the two platforms as well, relating to the depth of the measurement and whether or not the water is heated by the ship which measures the quantity.

In meteorology and climatology, a mesonet, portmanteau of mesoscale network, is a network of automated weather and, often also including environmental monitoring stations, designed to observe mesoscale meteorological phenomena and/or microclimates.

Meteorological instruments, including meteorological sensors, are the equipment used to find the state of the atmosphere at a given time. Each science has its own unique sets of laboratory equipment. Meteorology, however, is a science which does not use much laboratory equipment but relies more on on-site observation and remote sensing equipment. In science, an observation, or observable, is an abstract idea that can be measured and for which data can be taken. Rain was one of the first quantities to be measured historically. Two other accurately measured weather-related variables are wind and humidity. Many attempts had been made prior to the 15th century to construct adequate equipment to measure atmospheric variables.
Geophysical MASINT is a branch of Measurement and Signature Intelligence (MASINT) that involves phenomena transmitted through the earth and manmade structures including emitted or reflected sounds, pressure waves, vibrations, and magnetic field or ionosphere disturbances.

Airport weather stations are automated sensor suites which are designed to serve aviation and meteorological operations, weather forecasting and climatology. Automated airport weather stations have become part of the backbone of weather observing in the United States and Canada and are becoming increasingly more prevalent worldwide due to their efficiency and cost-savings.
Surface weather observations are the fundamental data used for safety as well as climatological reasons to forecast weather and issue warnings worldwide. They can be taken manually, by a weather observer, by computer through the use of automated weather stations, or in a hybrid scheme using weather observers to augment the otherwise automated weather station. The ICAO defines the International Standard Atmosphere (ISA), which is the model of the standard variation of pressure, temperature, density, and viscosity with altitude in the Earth's atmosphere, and is used to reduce a station pressure to sea level pressure. Airport observations can be transmitted worldwide through the use of the METAR observing code. Personal weather stations taking automated observations can transmit their data to the United States mesonet through the Citizen Weather Observer Program (CWOP), the UK Met Office through their Weather Observations Website (WOW), or internationally through the Weather Underground Internet site. A thirty-year average of a location's weather observations is traditionally used to determine the station's climate. In the US a network of Cooperative Observers make a daily record of summary weather and sometimes water level information.
Road surface textures are deviations from a planar and smooth surface, affecting the vehicle/tyre interaction. Pavement texture is divided into: microtexture with wavelengths from 0 mm to 0.5 millimetres (0.020 in), macrotexture with wavelengths from 0.5 millimetres (0.020 in) to 50 millimetres (2.0 in) and megatexture with wavelengths from 50 millimetres (2.0 in) to 500 millimetres (20 in).
The Antarctic Automatic Weather Station (AWS) Project is an Antarctic research program at the Space Science and Engineering Center at the University of Wisconsin–Madison that is funded by the Office of Polar Programs at the National Science Foundation (NSF). The AWS project was started in 1980 by UW-Madison atmospheric sciences Professor Charles R. Stearns.
The Oklahoma Mesonet is a network of environmental monitoring stations designed to measure the environment at the size and duration of mesoscale weather events. The phrase "mesonet" is a portmanteau of the words mesoscale and network. In meteorology, “mesoscale” refers to weather events that range in size from approximately 1 mile (1.6 km) to 150 miles (240 km) and can last from several minutes to several hours. Mesoscale events include thunderstorms, wind gusts, heat bursts, and dry lines. Without densely spaced weather observations, these mesoscale events might go undetected. In addition to surface weather observations, Oklahoma Mesonet stations also include environmental data such as insolation and soil conditions.

IRIS is an open-source Advanced Traffic Management System (ATMS) software project developed by the Minnesota Department of Transportation. It is used by transportation agencies to monitor and manage interstate and highway traffic. IRIS uses the GPL license.
Automated Weather Source (AWS) was a partnership and later a corporation founded in 1992 by James Michael "Mike" Bailey and Charles "Topper" Shutt of Montgomery County, Maryland, whose purpose was to create a network of weather stations located at public schools and recreational facilities throughout the Mid-Atlantic region of the United States.
AMeDAS, commonly known in Japanese as "アメダス" (amedasu), is a high-resolution surface observation network developed by the Japan Meteorological Agency (JMA) used for gathering regional weather data and verifying forecast performance. The system began operating on 1 November 1974, and currently comprises 1,300 stations throughout Japan, with an average separation of 17 km (11 mi).
The 20 indian Antarctic Expedition was flagged off on-board M.V. Magdalena Oldenorff from Cape Town on 30 December 2000. The team comprising a total of 51 members was led by Shri Mervin J. D’Souza from Geological Survey of India. The 20th IAE team consisted of 51 members including 34 scientists from various scientific Organizations/Universities/Departments and 17 logistic members. After successful completion of all logistics and scientific tasks the 20th IAE team returned to India in March 2002.

This glossary of meteorology is a list of terms and concepts relevant to meteorology and atmospheric science, their sub-disciplines, and related fields.
