Seriation (archaeology)

Last updated

In archaeology, seriation is a relative dating method in which assemblages or artifacts from numerous sites in the same culture are placed in chronological order. Where absolute dating methods, such as radio carbon, cannot be applied, archaeologists have to use relative dating methods to date archaeological finds and features. Seriation is a standard method of dating in archaeology. It can be used to date stone tools, pottery fragments, and other artifacts. In Europe, it has been used frequently to reconstruct the chronological sequence of graves in a cemetery (e.g. Jørgensen 1992; [1] Müssemeier, Nieveler et al. 2003). [2]

Contents

Contextual and frequency seriation

Two different variants of seriation have been applied: contextual seriation and frequency seriation (Renfrew and Bahn 1996, pp. 116117). Whereas contextual seriation is based on the presence or absence of a design style, frequency seriation relies on measuring the proportional abundance or frequency of a design style. Contextual seriation is often used for reconstructing the chronological sequence of graves as only the presence or absence of a design style or type is important. Frequency seriation is applied in cases of large quantities of objects belonging to the same style. An example of this being assemblages of pottery shards that include roughly the same range of types, though in different proportions.

History

Flinders Petrie excavated at Diospolis Parva in Egypt in the late nineteenth century. He found that the graves he was uncovering contained no evidence of their dates and their discrete nature meant that a sequence could not be constructed through their stratigraphy. Petrie listed the contents of each grave on a strip of cardboard and swapped the papers around until he arrived at a sequence he was satisfied with. [3] He reasoned that the most accurate sequence would be the one where concentrations of certain design styles had the shortest duration across the sequence of papers (Renfrew and Bahn 1996, p. 116; Kendall 1971, p. 215; Shennan 1997, p. 341 [4] ). Whereas Petrie is considered the inventor of contextual seriation, Brainerd (1951) [5] and Robinson (1951) [6] were the first to address the problem of frequency seriation (Shennan 1997, p. 342 [4] ).

The model

Description of the model

The assumption that design styles follow a bell curve of popularity  starting slowly, growing to a peak and then dying away as another style becomes popular  provides the basis for frequency seriation. It also assumes that design popularity will be broadly similar from site to site within the same culture. In addition, it is vital that the lifespans of the different design styles overlap. Following these rules, an assemblage of objects can be placed into sequence so that sites with the most similar proportions of certain styles are always together (Lock 2003, p. 125).

Pitfalls

The task of identifying design styles i.e. to form groups of objects belonging to the same design style is by no means trivial. Creating a typology frequently is the basis of a seriation. Errors in typology result in errors in seriation: For example, if a certain design style had two peaks in popularity (bimodal distribution), this design style is not appropriate for seriation and its inclusion in the analysis may result in strange results. Some design styles were used for a very long time as the shape constructed was handy and no improvement or ornament was added. Of course, these design styles are not eligible for chronological seriation. For example, knives in early medieval times in Europe are said to show no chronological variation.

In addition to temporal organization, seriation results may reflect assemblage differences in social status, age, sex or those resulting from regional variation (or a combination of two or more of these factors). Shennan (1997, p. 343) [4] presents a seriation result of Danish hoards based on artefact types like daggers, axes, and swords. The result is not a chronological sequence due to the selection of types, the ordering seems to start with extremely male hoards and ends with extremely female ones.

Three conditions for chronological seriation

Doran and Hodson (1975, p. 269) [7] list three conditions that must be satisfied to obtain a chronological seriation result:

Statistical methods

Development of seriation methods

Nowadays, seriation results are no longer produced manually as in Petrie's times but by appropriate algorithms. Though according to David George Kendall (1971), Petrie's paper showed already a deep understanding of the mathematics of the seriation problem (Quote: "..in my view Petrie should be ranked with the greatest applied mathematicians of the nineteenth century"). In Baxter's (2003, p. 8) list of landmarks of statistics in archaeology the paper of Robinson (1951) [6] is the first entry. Robinson based his frequency seriation method on a similarity matrix. In 1971, Kendall proposed the use of multidimensional scaling techniques for seriation problems, and this approach has also been used by some other scientists (see Baxter 2003, pp. 202203). Baxter also presents a review of statistical methods for seriation and a description of these approaches (pp. 202207). In 1975, Doran and Hodson (pp. 269281) [7] summarized the state of the art of seriation methods thoroughly, giving detailed descriptions of Kendall's and Robinson's approaches.

Correspondence analysis for seriation purposes

Today, the most popular seriation method both for contextual and frequency problems is based on correspondence analysis. The sequence of the first axis of a correspondence analysis is considered the best seriation order (Shennan 1997, [4] p. 342; Lock 2003, p. 127; Jensen & Høilund Nielsen 1997). Using this technique, not only the sequence of the objects but also those of the design styles is established. Note that external evidence is needed to establish the direction of the sequence calculated, i.e. the method does not tell whether the first object in the sequence is the oldest or the youngest object.

Kendall (1971) applied multidimensional scaling to the cemetery data of Münsingen. The resulting scatterplot showed the form of a horse-shoe where the graves were arranged on the curve according to their chronological order. Similarly, a mapping of the component scores for the first two axes of the correspondence analysis result will display a parabola if the design styles considered are controlled by one factor only (like chronology). This is called the arch effect by Hill and Gauch (1980). [8] Both Kendall and Jensen & Høilund Nielsen (1997) created artificial data sets to show that the parabola results in ideal circumstances. Therefore, it is recommended inspecting the scatterplot of the first two axes of correspondence analysis to find out if other factors play a role as well (see Examples 2 and 3).

If more than one factor is important, the arch effect may distort the results. Hill and Gauch (1980) presented a method to remove this effect.

In 2003, Groenen and Poblome adapted the correspondence analysis algorithm to combine seriation with absolute dates and stratigraphic relationships. [9] [10]

Examples

Example 1: Small contextual seriation

The small example below was inspired by Flinders Petrie's serial ordering of Egyptian pottery as published by Renfrew and Bahn (1996, p. 117).

Raw data for contextual seriation Unsorted contextual.png
Raw data for contextual seriation
Result of contextual seriation Seriation contextual.png
Result of contextual seriation
Another way of presenting the raw data for contextual seriation:
1=context contains the type
0=context does not contain the type Unsorted contextual 01.png
Another way of presenting the raw data for contextual seriation:
1=context contains the type
0=context does not contain the type

The raw data are stored in an unsorted binary contingency table indicating which design style can be found in which context by a star symbol. For example, consider the first column: context 3 contains the design styles blackrim, bottle, and handle. A beaker is contained in contexts 1 and 2. Contextual seriation sorts the design styles and the contexts in such a way that the star symbols are found as close as possible to the diagonal of the table. Of course, for a small examples like this, no computer programs are needed to find the best ordering, but for larger data sets like the 900 graves studied by Petrie they are extremely helpful.

Example 2: Simulated data, seriation and correspondence analysis

The data presented in this example was simulated by WinBasp. Initially 60 contexts (called units in WinBasp) were created along with 50 types. The contexts were labeled in chronological order by numbers 01 to 60, the types are labeled in the form T00001 to T00050. If a type is represented by one object only this object is not relevant for the chronological sequence as it does not provide a link to another context. Similarly, contexts containing one object only are irrelevant for seriation. Therefore, the contexts with one or no object and types represented by one object or not at all were eliminated. The resulting raw simulated data consisting of 43 contexts and 34 types are shown on the left. As expected, the dots indicating the occurrence of a type in a context are close to the diagonal of the table.

Raw simulated data for contextual seriation Seriation simulated data raw.png
Raw simulated data for contextual seriation
Result of seriation Seriation simulated data.png
Result of seriation

The image on the right hand side shows the result of the seriation for this data set. Note that the dots are even more compact along the diagonal of the table compared to the raw data. This shows a minor problem of seriation: In fact, the intervals of production may be somewhat longer than those calculated by the algorithm. In general, the sequences of contexts and types calculated by a seriation algorithm are not the correct chronological sequences but they are fairly close.

Result of correspondence analysis Seriation Parabola.png
Result of correspondence analysis

The image above shows the scatterplot with the typical parabola shape of the first two axes of a correspondence analysis for the contexts of the simulated data set.

Example 3: Ideal data, seriation and correspondence analysis

Ideal seriation data Seriation Ideal Table30.png
Ideal seriation data

The contingency table shows 29 contexts with ideal seriation data as created by Kendall and Jensen & Høilund Nielsen (see above). With each new context a new type appears and another type disappears. For this regular data, it seems reasonable to assume constant time intervals for contexts adjacent in time.

The correspondence analysis results shown in the figures below were calculated on the basis of 49 contexts with ideal seriation data. The scatterplot of the first two correspondence analysis axes shows the typical parabola shape. The display of the scores on the first and the third axes exhibits points lying on a third degree polynomial curve. Similarly, the plot of the scores on the first and the fourth axes will show a fourth degree polynomial for ideal data and so on.

Note that the distances of the scores for adjacent contexts on the first axis vary: At the beginning and the end, the distances are extremely small, the largest distances in the centre is about 30 times as large as the smallest distance. Hill and Gauch (1979) [8] created a similar contingency table with a regular structure with each context containing six types. They note, too, that the within-context distances are smaller at the ends than in the middle. This was one of the reasons why they proposed an adjustment which is called detrended correspondence analysis.

Nevertheless, some archaeologists think that a linear transformation of the scores on the first axis on the basis of some known absolute dates will create good estimates for the unknown absolute dates, and this approach is the basis of the method presented by Groenen and Poblome (see above) to combine relative and absolute dates. This ideal example shows that a linear transformation might not be appropriate in all cases, though a simulation study by van de Velden, Groenen and Poblome comes to the conclusion that the predictions of the approach are quite good. [11]

Result of correspondence analysis: axes 1 and 2 Seriation Ideal Parabola.png
Result of correspondence analysis: axes 1 and 2
Result of correspondence analysis: axes 1 and 3 Seriation Ideal 3Polynom.png
Result of correspondence analysis: axes 1 and 3

Archaeological sequence

The archaeological sequence (or sequence) for short, on a specific archaeological site can be defined on two levels of rigour.

  1. Normally it is adequate to equate it to archaeological record. However, the two terms are not exactly interchangeable. The term 'Archaeological record' is broader in its meaning and can be applied to artifacts and other evidence such as Biofacts and Manuports as well as to the stratigraphy of a site. Also, the terms Archaeological sequence and Archaeological stratigraphy are closely related and somewhat interchangeable. These colloquial uses of the term are normal in conversation but:
  2. The term 'sequence' when narrowly defined, and used in a serious piece of writing, refers to the stratigraphy of a given site or any discrete part of the archaeological record as revealed by stratification. It is a succession of Archaeological contexts, such that the relationships between them create the sequence chronologically by virtue of their stratigraphic relationships. In other words, the events causing the stratigraphic contexts to be deposited happened one after another, in an order which can be determined from study of the several contexts. It is this sequence of events which is the archaeological sequence.

See also

Notes

  1. Jørgensen, L. (ed.) (1992). Chronological Studies of Anglo-Saxon England, Lombard Italy and Vendel Period Sweden. Arkæologiske Skrifter5. Copenhagen: Institute of Prehistoric and Classical Archaeology, University of Copenhagen. ISSN   0901-6732.
  2. Müssemeier, U., Nieveler, E., Plum, R., Pöppelmann, H. (2003). Chronologie der merowingerzeitlichen Grabfunde vom linken Niederrhein bis zur nördlichen Eifel. Materialien zur Bodendenkmalpflege im Rheinland, Heft 15. Köln: Rheinland-Verlag GmbH. ISBN   3-7927-1894-4.
  3. Petrie, F. W. M. (1899). Sequences in prehistoric remains. Journal of the Anthropological Institute29:295301
  4. 1 2 3 4 Shennan, St. (1997). Quantifying Archaeology. Edinburgh: Edinburgh University Press. ISBN   0-7486-0791-9.
  5. Brainerd, G.W. (1951). The place of chronological ordering in archaeological analysis. American Antiquity16, pp.301313
  6. 1 2 Robinson, W.S. (1951). A method for chronologically ordering archaeological deposits. American Antiquity16, pp.293301
  7. 1 2 Doran, J.E. and F.R. Hodson (1975). Mathematics and Computers in Archaeology. Edinburgh University Press. ISBN   0-85224-250-6.
  8. 1 2 Hill, M.O. and Gauch, H.G. (1980). Detrended Correspondence Analysis: An Improved Ordination Technique. Vegetatio42, 4758.
  9. Groenen, P. J. F. and J. Poblome (2003). Constrained correspondence analysis for seriation in archaeology applied to Sagalassos ceramic tablewares. In: Schwaiger, M. and O. Opitz (eds.), Exploratory Data Analysis in Empirical Research. Springer, Berlin: 9097.
  10. Poblome, J. and P. J . F. Groenen (2003). Constrained correspondence analysis for seriation of Sagalassos tablewares. In M. Doerr and A. Sarris (eds.), Computer Applications and Quantitative Methods in Archaeology. Hellinic Ministry of Culture, 301306.
  11. "Archived copy" (PDF). Archived from the original (PDF) on 2008-10-03. Retrieved 2008-08-27.{{cite web}}: CS1 maint: archived copy as title (link) van de Velden, M., Groenen, P. J. F., Poblome, J. (2007). Seriation by constrained correspondence analysis: a simulation study. Econometric Institute Report EI 2007-40.

Related Research Articles

Multivariate statistics is a subdivision of statistics encompassing the simultaneous observation and analysis of more than one outcome variable, i.e., multivariate random variables. Multivariate statistics concerns understanding the different aims and background of each of the different forms of multivariate analysis, and how they relate to each other. The practical application of multivariate statistics to a particular problem may involve several types of univariate and multivariate analyses in order to understand the relationships between variables and their relevance to the problem being studied.

Series may refer to:

<span class="mw-page-title-main">Archaeological excavation</span> Exposure, processing and recording of archaeological remains

In archaeology, excavation is the exposure, processing and recording of archaeological remains. An excavation site or "dig" is the area being studied. These locations range from one to several areas at a time during a project and can be conducted over a few weeks to several years.

<span class="mw-page-title-main">Artifact (archaeology)</span> Something made by humans and of archaeological interest

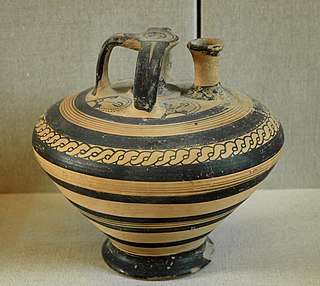
An artifact or artefact is a general term for an item made or given shape by humans, such as a tool or a work of art, especially an object of archaeological interest. In archaeology, the word has become a term of particular nuance and is defined as an object recovered by archaeological endeavor, which may be a cultural artifact having cultural interest.

<span class="mw-page-title-main">Oscar Montelius</span> Swedish archaeologist

Gustaf Oscar Augustin Montelius, known as Oscar Montelius was a Swedish archaeologist who refined the concept of seriation, a relative chronological dating method.

An archaeological culture is a recurring assemblage of types of artifacts, buildings and monuments from a specific period and region that may constitute the material culture remains of a particular past human society. The connection between these types is an empirical observation, but their interpretation in terms of ethnic or political groups is based on archaeologists' understanding and interpretation and is in many cases subject to long-unresolved debates. The concept of the archaeological culture is fundamental to culture-historical archaeology.

<span class="mw-page-title-main">Stratigraphy (archaeology)</span> Study of archaeological sedimentation for dating purposes

Stratigraphy is a key concept to modern archaeological theory and practice. Modern excavation techniques are based on stratigraphic principles. The concept derives from the geological use of the idea that sedimentation takes place according to uniform principles. When archaeological finds are below the surface of the ground, the identification of the context of each find is vital in enabling the archaeologist to draw conclusions about the site and about the nature and date of its occupation. It is the archaeologist's role to attempt to discover what contexts exist and how they came to be created. Archaeological stratification or sequence is the dynamic superimposition of single units of stratigraphy, or contexts.

<span class="mw-page-title-main">Harris matrix</span> Method of depicting site stratigraphy

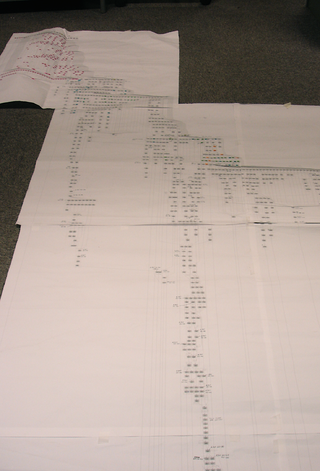
The Harris matrix is a tool used to depict the temporal succession of archaeological contexts and thus the sequence of depositions and surfaces on a 'dry land' archaeological site, otherwise called a 'stratigraphic sequence'. The matrix reflects the relative position and stratigraphic contacts of observable stratigraphic units, or contexts. It was developed in 1973 in Winchester, England, by Edward C. Harris.

Ordination or gradient analysis, in multivariate analysis, is a method complementary to data clustering, and used mainly in exploratory data analysis. In contrast to cluster analysis, ordination orders quantities in a latent space. In the ordination space, quantities that are near each other share attributes, and dissimilar objects are farther from each other. Such relationships between the objects, on each of several axes or latent variables, are then characterized numerically and/or graphically in a biplot.

In archaeology, a typology is the result of the classification of things according to their physical characteristics. The products of the classification, i.e. the classes, are also called types. Most archaeological typologies organize portable artifacts into types, but typologies of larger structures, including buildings, field monuments, fortifications or roads, are equally possible. A typology helps to manage a large mass of archaeological data. According to Doran and Hodson, "this superficially straightforward task has proved one of the most time consuming and contentious aspects of archaeological research".

<span class="mw-page-title-main">Relative dating</span>

Relative dating is the science of determining the relative order of past events, without necessarily determining their absolute age. In geology, rock or superficial deposits, fossils and lithologies can be used to correlate one stratigraphic column with another. Prior to the discovery of radiometric dating in the early 20th century, which provided a means of absolute dating, archaeologists and geologists used relative dating to determine ages of materials. Though relative dating can only determine the sequential order in which a series of events occurred, not when they occurred, it remains a useful technique. Relative dating by biostratigraphy is the preferred method in paleontology and is, in some respects, more accurate. The Law of Superposition, which states that older layers will be deeper in a site than more recent layers, was the summary outcome of 'relative dating' as observed in geology from the 17th century to the early 20th century.

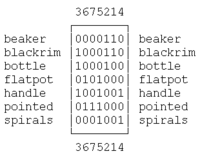
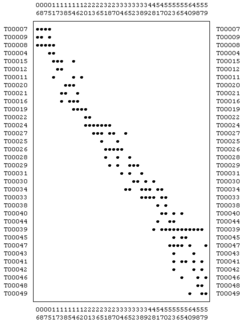
Sequence dating, an archaeological relative dating method, allows assemblages to be arranged in a rough serial order, which is then taken to indicate time. Sequence dating is a method of seriation developed by the Egyptologist Sir William Matthew Flinders Petrie. By linking styles of pottery with different time periods, he was able to establish the relative chronology of the site.

<span class="mw-page-title-main">Biplot</span> Type of exploratory graph used in statistics

Biplots are a type of exploratory graph used in statistics, a generalization of the simple two-variable scatterplot. A biplot overlays a score plot with a loading plot. A biplot allows information on both samples and variables of a data matrix to be displayed graphically. Samples are displayed as points while variables are displayed either as vectors, linear axes or nonlinear trajectories. In the case of categorical variables, category level points may be used to represent the levels of a categorical variable. A generalised biplot displays information on both continuous and categorical variables.

Detrended correspondence analysis (DCA) is a multivariate statistical technique widely used by ecologists to find the main factors or gradients in large, species-rich but usually sparse data matrices that typify ecological community data. DCA is frequently used to suppress artifacts inherent in most other multivariate analyses when applied to gradient data.

<span class="mw-page-title-main">Archaeology</span> Study of human activity via material culture

Archaeology or archeology is the study of human activity through the recovery and analysis of material culture. The archaeological record consists of artifacts, architecture, biofacts or ecofacts, sites, and cultural landscapes. Archaeology can be considered both a social science and a branch of the humanities. It is usually considered an independent academic discipline, but may also be classified as part of anthropology, history or geography.

<span class="mw-page-title-main">Plot (graphics)</span> Graphical technique for data sets

A plot is a graphical technique for representing a data set, usually as a graph showing the relationship between two or more variables. The plot can be drawn by hand or by a computer. In the past, sometimes mechanical or electronic plotters were used. Graphs are a visual representation of the relationship between variables, which are very useful for humans who can then quickly derive an understanding which may not have come from lists of values. Given a scale or ruler, graphs can also be used to read off the value of an unknown variable plotted as a function of a known one, but this can also be done with data presented in tabular form. Graphs of functions are used in mathematics, sciences, engineering, technology, finance, and other areas.

Chronological dating, or simply dating, is the process of attributing to an object or event a date in the past, allowing such object or event to be located in a previously established chronology. This usually requires what is commonly known as a "dating method". Several dating methods exist, depending on different criteria and techniques, and some very well known examples of disciplines using such techniques are, for example, history, archaeology, geology, paleontology, astronomy and even forensic science, since in the latter it is sometimes necessary to investigate the moment in the past during which the death of a cadaver occurred. These methods are typically identified as absolute, which involves a specified date or date range, or relative, which refers to dating which places artifacts or events on a timeline relative to other events and/or artifacts. Other markers can help place an artifact or event in a chronology, such as nearby writings and stratigraphic markers.

There are two main approaches currently used to analyze archaeological remains from an evolutionary perspective: evolutionary archaeology and behavioral ecology. The former assumes that cultural change observed in the archaeological record can be best explained by the direct action of natural selection and other Darwinian processes on heritable variation in artifacts and behavior. The latter assumes that cultural and behavioral change results from phenotypic adaptations to varying social and ecological environments. 

This page is a glossary of archaeology, the study of the human past from material remains.

<span class="mw-page-title-main">Ancient Egyptian pottery</span>

Ancient Egyptian pottery includes all objects of fired clay from ancient Egypt. First and foremost, ceramics served as household wares for the storage, preparation, transport, and consumption of food, drink, and raw materials. Such items include beer and wine mugs and water jugs, but also bread moulds, fire pits, lamps, and stands for holding round vessels, which were all commonly used in the Egyptian household. Other types of pottery served ritual purposes. Ceramics are often found as grave goods.

References