

A snowboard (US) or weaverboard [1] (Canada) is a meteorological tool used to aid in the obtaining of accurate measurement of snow accumulation.
A snowboard (US) or weaverboard [1] (Canada) is a meteorological tool used to aid in the obtaining of accurate measurement of snow accumulation.
Snowboards are typically flat pieces of plywood painted a light color (most commonly white), around 16 to 24 in (41 to 61 cm) in length and width and around 0.5 to 0.75 in (1.3 to 1.9 cm) thick. [2] [3] [4] [5] In addition, the weaverboard used in Canada has a white stick with a black tip placed in the centre. This allows the board to be found if the newly fallen snow was to completely cover the board.
When measuring snow in grass, the blades will produce inflated snow totals, whereas with a snowboard, this effect is absent. [4] The light or white color of a snowboard serves to minimize heating by sunlight, which often occurs on paved surfaces. [5] These qualities make snowfall measurement using a snowboard more accurate than measurements without one. [3] [4] [5]
Snowboards should be placed at ground level at a distance away from a building of at least two times the height of that building. [2] When measuring snowfall on a snowboard, the snowfall is measured to the nearest 0.1 in (0.25 cm). [2] The snow may be measured as often as necessary during a 6-hour period in order to record the greatest depth on the board, since snow may both accumulate and melt during the same 6-hour period. [5] All snow is cleaned from the snowboard once every 6 hours. [4] [5] At the end of the snow event, the maximum depths recorded on the snowboard during each 6-hour period are summed to provide the storm total; the same measurements during a single day are summed to produce the daily snowfall total. [5]
Usage in Canada is similar to that of the United States, with some minor differences. The board is checked every 6 hours at the synoptic hours of 12Z, 18Z, 00Z and 06Z. The depth of snow on the board should be checked in several different places and an average depth obtained rounded to the nearest 0.2 cm (0.08 in). [1]

Hail is a form of solid precipitation. It is distinct from ice pellets, though the two are often confused. It consists of balls or irregular lumps of ice, each of which is called a hailstone. Ice pellets generally fall in cold weather, while hail growth is greatly inhibited during low surface temperatures.

Snow comprises individual ice crystals that grow while suspended in the atmosphere—usually within clouds—and then fall, accumulating on the ground where they undergo further changes. It consists of frozen crystalline water throughout its life cycle, starting when, under suitable conditions, the ice crystals form in the atmosphere, increase to millimeter size, precipitate and accumulate on surfaces, then metamorphose in place, and ultimately melt, slide or sublimate away.

Lake-effect snow is produced during cooler atmospheric conditions when a cold air mass moves across long expanses of warmer lake water. The lower layer of air, heated by the lake water, picks up water vapor from the lake and rises through colder air. The vapor then freezes and is deposited on the leeward (downwind) shores.
A winter storm is an event in which wind coincides with varieties of precipitation that only occur at freezing temperatures, such as snow, mixed snow and rain, or freezing rain. In temperate continental and subarctic climates, these storms are not necessarily restricted to the winter season, but may occur in the late autumn and early spring as well. A snowstorm with strong winds and other conditions meeting certain criteria is called a blizzard.

In meteorology, precipitation is any product of the condensation of atmospheric water vapor that falls from clouds due to gravitational pull. The main forms of precipitation include drizzle, rain, sleet, snow, ice pellets, graupel and hail. Precipitation occurs when a portion of the atmosphere becomes saturated with water vapor, so that the water condenses and "precipitates" or falls. Thus, fog and mist are not precipitation but colloids, because the water vapor does not condense sufficiently to precipitate. Two processes, possibly acting together, can lead to air becoming saturated: cooling the air or adding water vapor to the air. Precipitation forms as smaller droplets coalesce via collision with other rain drops or ice crystals within a cloud. Short, intense periods of rain in scattered locations are called showers.

The 2004 Christmas Eve United States winter storm was a rare weather event that took place in Louisiana and Texas in the United States on December 24, 2004, before the storm moved northeast to affect the coastal sections of the Mid-Atlantic states and New England in the succeeding few days. This was a different storm from the historic event that struck the Midwest and southern Canada around December 23 from another cyclone which preceded this storm. The event involved a thin band of snowfall with unusually cold temperatures for the middle Texas coast, and caused dozens of varied weather records to be shattered. It was the most significant snow for the Texas Gulf Coast, and deep South Texas, since February 1895.

A snow gauge is a type of instrument used by meteorologists and hydrologists to gather and measure the amount of solid precipitation over a set period of time.
The Great Blizzard of 1978 was a historic winter storm that struck the Ohio Valley and Great Lakes regions of the United States as well as Southern Ontario in Canada from Wednesday, January 25 through Friday, January 27, 1978. It is often cited as one of the most severe blizzards in US history. The third lowest non-tropical atmospheric pressure ever recorded in the mainland United States occurred as the storm passed over Mount Clemens, Michigan, where barometer readings fell to 956.0 mb (28.23 inHg) on January 26.

Crucial to the survival of a glacier is its mass balance of which surface mass balance (SMB), the difference between accumulation and ablation. Climate change may cause variations in both temperature and snowfall, causing changes in the surface mass balance. Changes in mass balance control a glacier's long-term behavior and are the most sensitive climate indicators on a glacier. From 1980 to 2012 the mean cumulative mass loss of glaciers reporting mass balance to the World Glacier Monitoring Service is −16 m. This includes 23 consecutive years of negative mass balances.
The city of Vancouver, located in British Columbia, Canada, has a temperate oceanic climate. Its summer months are typically dry and modestly warm, while the rest of the year is rainy, especially between October and March. The region has frequent cloudy and overcast skies during the late fall, winter, and spring.

Weather buoys are instruments which collect weather and ocean data within the world's oceans, as well as aid during emergency response to chemical spills, legal proceedings, and engineering design. Moored buoys have been in use since 1951, while drifting buoys have been used since 1979. Moored buoys are connected with the ocean bottom using either chains, nylon, or buoyant polypropylene. With the decline of the weather ship, they have taken a more primary role in measuring conditions over the open seas since the 1970s. During the 1980s and 1990s, a network of buoys in the central and eastern tropical Pacific Ocean helped study the El Niño-Southern Oscillation. Moored weather buoys range from 1.5–12 metres (5–40 ft) in diameter, while drifting buoys are smaller, with diameters of 30–40 centimetres (12–16 in). Drifting buoys are the dominant form of weather buoy in sheer number, with 1250 located worldwide. Wind data from buoys has smaller error than that from ships. There are differences in the values of sea surface temperature measurements between the two platforms as well, relating to the depth of the measurement and whether or not the water is heated by the ship which measures the quantity.
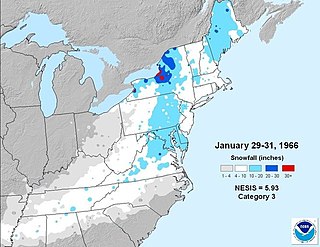
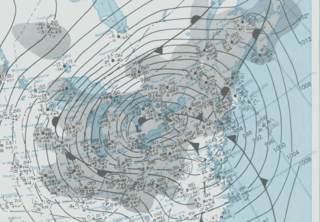
The Blizzard of 1966 was a nor'easter that impacted the northeastern United States and Eastern Canada from January 29-February 1, 1966. Heavy lake effect snows preceded the cyclonic storm southeast of Lake Ontario. In and around the Lake Ontario snow belt, the storm period is considered to have lasted from January 27 - February 1, 1966, and the blizzard was a combination nor' easter and lake effect event in this region.

Surface weather observations are the fundamental data used for safety as well as climatological reasons to forecast weather and issue warnings worldwide. They can be taken manually, by a weather observer, by computer through the use of automated weather stations, or in a hybrid scheme using weather observers to augment the otherwise automated weather station. The ICAO defines the International Standard Atmosphere (ISA), which is the model of the standard variation of pressure, temperature, density, and viscosity with altitude in the Earth's atmosphere, and is used to reduce a station pressure to sea level pressure. Airport observations can be transmitted worldwide through the use of the METAR observing code. Personal weather stations taking automated observations can transmit their data to the United States mesonet through the Citizen Weather Observer Program (CWOP), the UK Met Office through their Weather Observations Website (WOW), or internationally through the Weather Underground Internet site. A thirty-year average of a location's weather observations is traditionally used to determine the station's climate. In the US a network of Cooperative Observers make a daily record of summary weather and sometimes water level information.

The climate of Pennsylvania is diverse due to the multitude of geographic features found within the state. Straddling two major climate zones, the southeastern corner of Pennsylvania has the warmest climate. A portion of Greater Philadelphia lies at the southernmost tip of the humid continental climate zone, with the city proper being in the humid subtropical climate zone. Still, Philadelphia features colder, snowier winters than most locations with a humid subtropical climate. Moving west toward the mountainous interior of the state, the climate becomes markedly colder, the number of cloudy days increases, and winter snowfall amounts are greater.

The 2014–15 North American winter was frigid and prolifically wintry, especially across the eastern half of North America in the months of January–March. The season began early, with many places in North America experiencing their first wintry weather during mid-November. A period of below-average temperatures affected much of the contiguous United States, and several records were broken. An early trace of snowfall was recorded in Arkansas. There were greater accumulations of snow across parts of Oklahoma as well. A quasi-permanent phenomenon referred to as the polar vortex may have been partly responsible for the cold weather. Temperatures in much of the United States dropped 15 to 35 °F below average by November 19, following a southward "dip" of the polar vortex into the eastern two-thirds of the country. The effects of this dip were widespread, bringing about temperatures as low as 28 °F (−2 °C) in Pensacola, Florida. Following a significant snowstorm there, Buffalo, New York received several feet of snow from November 17–21. In addition, significant winter weather occurred throughout the season, including a major blizzard that struck the Northeastern United States at the end of January, another blizzard that affected much of the Northern United States days later in early February, and several significant snow events paired with very frigid temperatures for much of February.
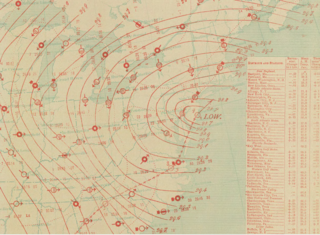
The January 1886 blizzard in North America was caused by a strong extratropical cyclone which initially dropped southeast across Texas before strengthening while it moved through the South and East, near the Eastern Seaboard through New England. The cyclone was at its strongest as it moved by New Jersey. This system formed within an active pattern which brought significant snow to the southern Rockies over many days. The system brought high winds and snowfall near and west of its path, resulting in blizzard conditions across portions of the Plains and East. A significant cold spell was ushered in by this system across portions of the southern and eastern United States. A slightly stronger storm on January 3, 1913, broke January low sea level pressure records originally set by this storm.

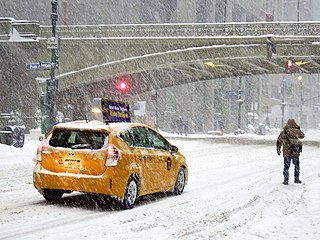
The January 2016 United States blizzard produced up to 3 ft (91 cm) of snow in parts of the Mid-Atlantic and Northeastern United States during January 22–24, 2016. A weather system, evolving from a shortwave trough that formed in the Pacific Northwest on January 19, consolidated into a defined low-pressure area on January 21 over Texas. Meteorologists indicated that a resultant storm could produce more than 2 ft (61 cm) of snow across a wide swath of the Mid-Atlantic region and could "paralyze the eastern third of the nation", and regarded it as a "potentially historic blizzard". Winter weather expert Paul Kocin described the blizzard as "kind of a top-10 snowstorm".

The 2009–10 North American winter saw several major blizzards affect the Northeastern United States. It refers to winter as it occurred across the North American continent from late 2009 to early 2010. While there is no well-agreed-upon date used to indicate the start of winter in the Northern Hemisphere, there are two definitions of winter which may be used. Based on the astronomical definition, winter begins at the winter solstice, which in 2009 occurred on December 21, and ends at the March equinox, which in 2010 occurred on March 20. Based on the meteorological definition, the first day of winter is December 1 and the last day February 28. Both definitions involve a period of approximately three months, with some variability.

Snow science addresses how snow forms, its distribution, and processes affecting how snowpacks change over time. Scientists improve storm forecasting, study global snow cover and its effect on climate, glaciers, and water supplies around the world. The study includes physical properties of the material as it changes, bulk properties of in-place snow packs, and the aggregate properties of regions with snow cover. In doing so, they employ on-the-ground physical measurement techniques to establish ground truth and remote sensing techniques to develop understanding of snow-related processes over large areas.

In meteorology, a trace denotes an amount of precipitation, such as rain or snow, that is greater than zero, but is too small to be measured by standard units or methods of measurement. The designation of a trace rather than zero is used to indicate that precipitation did fall, but not enough to be measured reliably. This is important for both weather forecasting and climatological purposes, because even precipitation amounts too small to be measured can have significant societal impacts.