Solar power in Thailand

Last updated
Solar potential SolarGIS-Solar-map-Thailand-en.png
Solar potential

Solar power in Thailand is targeted to reach 6,000 MW by 2036. [2] In 2013 installed photovoltaic capacity nearly doubled and reached 704 MW by the end of the year. [3] At the end of 2015, with a total capacity of 2,500-2,800 MW, Thailand has more solar power capacity than all the rest of Southeast Asia combined. [2]

Contents

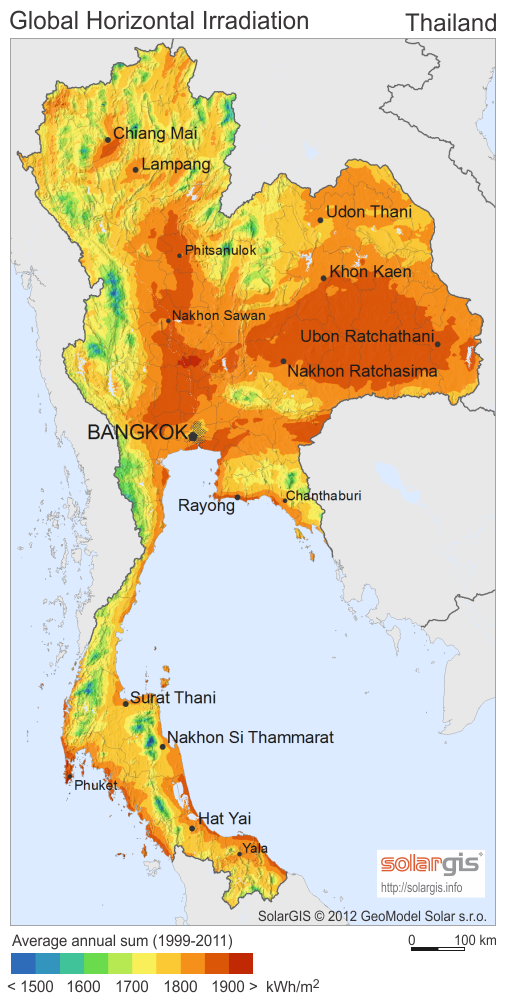
Thailand has great solar potential, especially the southern and northern parts of the northeastern region of Udon Thani Province and certain areas in the central region. Around 14.3% of the country has a daily solar exposure of around 19–20 MJ/m2/day, while another 50% of the country gains around 18–19 MJ/m2/day. In terms of solar potential, Thailand lags behind the US, but is ahead of Japan. [4]

The 84 MW Lopburi Solar Farm was completed in May 2013. German solar energy company Conergy signed a contract with Thailand's Siam Solar Energy to construct three solar plants of 10.5 MW each in addition to existing two solar plants that have been under construction since autumn 2012. [5]

In 2021, the world’s largest hybrid solar-hydropower project, the Sirindhorn floating solar farm, commenced operations. [6]

Power purchase scheme

In January 2015, Thailand's Energy Regulatory Commission (ERC) announced a new regulation for the purchase of electricity from ground-mounted solar projects, replacing the "adder" scheme with the "feed-in-tariff" (FiT) scheme. The regulation aims to revive the investment in renewable energy projects in Thailand after a quiet period in the renewable energy sector in 2014. There are over one hundred projects, with a total capacity of 1,000 MW, whose applications have not yet been accepted under the adder scheme and therefore are eligible for the feed-in-tariff scheme. [7]

Statistics

Solar power in Thailand

Daily insolation in Bangkok with an average of 5.04 hours of sun per day. [8]

Photovoltaics - Deployment
YearCumulative
Capacity (MWp)
Annual
Installations (MWp)
 On-grid

(Distributed)

On-grid

(Centralized)

Off-gridTotalOn-grid

(Distributed)

On-grid

(Centralized)

Off-gridTotal
2005-1.7722.1123.88-0.01-13.05
2006-1.8628.6630.52-0.096.556.64
2007-3.6128.9032.51-1.750.241.99
2008-4.0529.3433.39-0.447.230.88
2009-13.6829.4943.17-9.630.159.78
2010-19.5729.6549.22-5.897.546.05
2011-212.2829.88242.68-192.710.23193.46
2012-357.3830.19387.57-145.108.08144.89
2013-793.7329.73823.46-436.35-0.46a435.89
2014-1,268.7829.151,298.51-475.057.04475.05
2015-1,389.5530.031,419.58-120.77 [9] 0.88121.07
2016129.682,282.6433.802,446.12129.68893.0911.691,026.54
2017359.792,663.1234.143,057.05230.11380.480.34610.93
2018598.862,827.0511.433,437.34239.07163.93-10.68a380.29
Source: IEA-PVPS, Annual Report 2015 (AR2015), [10] National Survey report of PV applications in Thailand [11]
Notes:
a Some of the off-grid systems were dismantled.
1,000
2,000
3,000
4,000
2006
2008
2010
2012
2014
2016
2018
Cumulative Capacity – Total installed PV capacity in megawatts since 2005
250
500
750
1,000
1,250
1,500
2006
2008
2010
2012
2014
2016
2018
Annual Installations – Annually installed PV capacity in megawatts since 2005

See also

Related Research Articles

<span class="mw-page-title-main">Solar power by country</span>

Many countries and territories have installed significant solar power capacity into their electrical grids to supplement or provide an alternative to conventional energy sources. Solar power plants use one of two technologies:

<span class="mw-page-title-main">Solar power in Spain</span>

Spain is one of the first countries to deploy large-scale solar photovoltaics, and is the world leader in concentrated solar power (CSP) production.

<span class="mw-page-title-main">Solar power in India</span>

India's solar power installed capacity was 81.813 GWAC as of 31 March 2024.

For solar power, South Asia has the ideal combination of both high solar insolation and a high density of potential customers.

Financial incentives for photovoltaics are incentives offered to electricity consumers to install and operate solar-electric generating systems, also known as photovoltaics (PV).

<span class="mw-page-title-main">Solar power in the United Kingdom</span>

Solar power has a small but growing role in electricity production in the United Kingdom.

<span class="mw-page-title-main">Solar power in Portugal</span>

Solar power is a growing source in the Portuguese energy mix. At the end of 2020, solar power installed capacity totalled 1.03 GW and represented 3.6% of total power generation in 2020.

<span class="mw-page-title-main">Solar power in China</span>

China is the largest market in the world for both photovoltaics and solar thermal energy. China's photovoltaic industry began by making panels for satellites, and transitioned to the manufacture of domestic panels in the late 1990s. After substantial government incentives were introduced in 2011, China's solar power market grew dramatically: the country became the world's leading installer of photovoltaics in 2013. China surpassed Germany as the world's largest producer of photovoltaic energy in 2015, and became the first country to have over 100 GW of total installed photovoltaic capacity in 2017.

<span class="mw-page-title-main">Solar power in Canada</span> Overview of solar power in Canada

Historically, the main applications of solar energy technologies in Canada have been non-electric active solar system applications for space heating, water heating and drying crops and lumber. In 2001, there were more than 12,000 residential solar water heating systems and 300 commercial/ industrial solar hot water systems in use. These systems presently comprise a small fraction of Canada's energy use, but some government studies suggest they could make up as much as five percent of the country's energy needs by the year 2025.

<span class="mw-page-title-main">Solar power in Japan</span>

Solar power in Japan has been expanding since the late 1990s. The country is a major manufacturer and exporter of photovoltaics (PV) and a large installer of domestic PV systems, with most of them grid connected.

<span class="mw-page-title-main">Growth of photovoltaics</span> Worldwide growth of photovoltaics

Between 1992 and 2023, the worldwide usage of photovoltaics (PV) increased exponentially. During this period, it evolved from a niche market of small-scale applications to a mainstream electricity source. From 2016-2022 it has seen an annual capacity and production growth rate of around 26%- doubling approximately every three years.

<span class="mw-page-title-main">Solar power in Romania</span> Electricity production in Romania via solar energy

Solar power in Romania had an installed capacity of 1,374 megawatt (MW) as of the end of 2017. The country had in 2007 an installed capacity of 0.30 MW, which increased to 3.5 MW by the end of 2011, and to 6.5 MW by the end of 2012. However, the record year of 2013 was an exception, and new installation fell back from 1,100 MW to a moderate level of 69 MW in 2014.

<span class="mw-page-title-main">Solar power in Italy</span>

Solar power is an important contributor to electricity generation in Italy, accounting for 8% of the total in 2017. As of 2022, the country has a total installed capacity of 22.56 GW. In 2019, Italy set a national goal of reaching 50 GW by 2030.

<span class="mw-page-title-main">Photovoltaic power station</span> Large-scale photovoltaic system

A photovoltaic power station, also known as a solar park, solar farm, or solar power plant, is a large-scale grid-connected photovoltaic power system designed for the supply of merchant power. They are different from most building-mounted and other decentralized solar power because they supply power at the utility level, rather than to a local user or users. Utility-scale solar is sometimes used to describe this type of project.

<span class="mw-page-title-main">Solar power in Austria</span>

As of the end of 2022, solar power in Austria amounted to nearly 3.8 gigawatt (GW) of cumulative photovoltaic (PV) capacity, with the energy source producing 4.2% of the nation's electricity.

Solar power in France including overseas territories reached an installed capacity figure of 11.2 GW in 2020, and rose further to 17.1 GW at the end of 2022. Government plans announced in 2022 foresee solar PV capacity in France rising to 100 GW by 2050.

<span class="mw-page-title-main">Solar power in Mexico</span> Overview of solar power in Mexico

Solar power in Mexico has the potential to produce vast amounts of energy. 70% of the country has an insolation of greater than 4.5 kWh/m2/day. Using 15% efficient photovoltaics, a square 25 km (16 mi) on each side in the state of Chihuahua or the Sonoran Desert could supply all of Mexico's electricity.

<span class="mw-page-title-main">Solar power in South Africa</span> Overview of the use of solar power in South Africa

Solar power in South Africa includes photovoltaics (PV) as well as concentrated solar power (CSP). As of 2023, South Africa had over 2700 MW of installed PV solar power capacity in its grid, in addition to 500 MW of CSP. Installed capacity is expected to reach 8,400 MW by 2030.

<span class="mw-page-title-main">Solar power in Belgium</span> Overview of solar power in Belgium

Solar power in Belgium reached an installed capacity of 9.9 GW at the end of 2023, an increase of 1.8 GW from 2022.

<span class="mw-page-title-main">Solar power in Switzerland</span> Overview of solar power in Switzerland

Solar power in Switzerland has demonstrated consistent capacity growth since the early 2010s, influenced by government subsidy mechanisms such as the implementation of the feed-in tariff in 2009 and the enactment of the revised Energy Act in 2018. By the end of 2022, solar photovoltaic (PV) capacity had reached 4.7 GW, a notable increase from the 0.1 GW recorded in 2010. Concurrently, the contribution of solar power to electricity generation also rose, climbing from 0.1% in 2010 to 6.2% in 2022.

References

  1. "Global Horizontal Irradiation (GHI): Thailand". solargis. Retrieved 5 Mar 2015.
  2. 1 2 Jittapong, Khettiya (2015-07-12). "Thailand ignites solar power investment in Southeast Asia". Reuters. Reuters UK. Retrieved 2014-07-24.
  3. Snapshot of Global PV 1992-2013 (PDF) (2nd ed.). International Energy Agency - Photovoltaic Power Systems Programme. 2014. p. 8. ISBN   978-3-906042-19-0. Archived (PDF) from the original on 7 April 2014.
  4. "Areas with solar power potential". Thailand Ministry of Energy, Department of Alternative Energy Development and Efficiency. Retrieved 5 Mar 2015.
  5. "Thailand turns to solar power". Investvine.com. 2013-02-25. Retrieved 2013-02-25.
  6. "Thailand starts operating massive floating solar panel project as pressure mounts on climate action". CNA. Retrieved 2021-11-02.
  7. "Solar power in Thailand: new power purchase scheme creates investment opportunities". www.nortonrosefulbright.com. Retrieved 2015-09-23.
  8. "PV Watts". US National Renewable Energy Laboratory (NREL). Archived from the original on 23 October 2014. Retrieved 9 Jul 2012.
  9. "Solarpv.tv".
  10. IEA-PVPS, Annual Report 2015 (AR2015), p. 105, 27 May 2016
  11. "IEA National Survey Report of PV Applications in Thailand 2018" (PDF). 2018.