There were few installations until 2010, when the UK government mandated subsidies in the form of a feed-in tariff (FIT), paid for by all electricity consumers. In the following years the cost of photovoltaic (PV) panels fell,[1] and the FIT rates for new installations were reduced in stages until the scheme closed to new applications in 2019.[2]
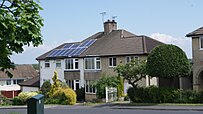
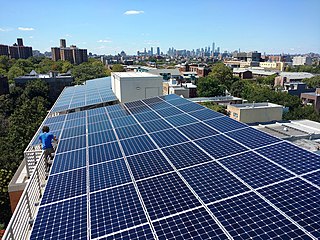
As of 2023[update], over 14.4gigawatt (GW) had been installed, a third of which was rooftop solar.[3] Annual generation was 14TWh in 2022 (4.3% of UK electricity consumption) and peak generation was more than 10GW.[3] PV panels have a capacity factor of around 10% in the UK climate. Home rooftop solar panels installed in 2022 were estimated to pay back their cost in ten to twenty years.[4]
Solar potential
Solar potential in the UK and on the European continent (different colour scale)
The UK's annual insolation is in the range of 750–1,100kilowatt-hours per square metre (kWh/m2). London receives 0.52 and 4.74kWh/m2 per day in December and July, respectively.[5] While the sunniest parts of the UK receive much less solar radiation than the sunniest parts of Europe, the country's insolation in the south is comparable with that of central European countries, including Germany, which generates about 10.7% of its electricity from solar power.[6] Additionally, the UK's higher wind speeds cool PV modules, leading to higher efficiencies than could be expected at these levels of insolation.[7] Capacity factors of solar PV reached values between 9.8% and 11.4% in the UK in the 2013-2022 period.[8]
Derry Newman, chief executive of Solarcentury, argues that the UK's "famously overcast weather does not make it an unsuitable place for solar power, as solar panels work on daylight, not necessarily direct sunlight."[9] Some solar cells work better in direct sunlight, others can use more diffuse light. While insolation rates are lower in England than France and Spain, they are still usable.[10]
Source: DECC – Department of Energy & Climate Change, Statistics – Solar photovoltaics deployment (period from 2010 onward)[16]
The table above shows electricity production from solar panels as a percentage of the final consumption of electricity in the UK and not gross supply to the grid. These numbers may be updated as the UK government has an average time lag of around 6months in completing the backlog of officially processing the large number of solar installations.
↑ 0.108 here means 10.8% for example. For more information on calculations see Capacity Factor
History
PV capacity in watts per capita by region in 2013
0–1 watt
1–10 watts
10–50 watts
50–100 watts
100–200 watts
200–350 watts
In 2006, the United Kingdom had installed about 12MW of photovoltaic capacity,[17] which represented only 0.3% of total European solar PV of 3,400MW.[18] In August 2006, there was widespread news coverage in the United Kingdom of the major high street electrical retailers Currys' decision to stock PV modules, manufactured by Sharp, at a cost of £1,000 per module. The retailer also provided an installation service.
Solar power installations increased rapidly in subsequent years, as a result of reductions in the cost of PV panels, and the introduction of a feed-in-tariff (FiT) subsidy in April 2010.[1]
FiT payments for new installations were cut a review announced by DECC on 9June 2011.[19] As a result, large arrays of solar panels became a less attractive investment opportunity for developers, especially for projects greater than 250kW, so large field arrays such as these were less likely to be built beyond the 1 August 2011 cut-off date.[20] At the end of 2011, there were 230,000 solar power projects in the UK,[1] with a total installed generating capacity of 750MW.[21]
In 2012, the government announced that 4million homes across the UK would be powered by the sun within eight years,[22] representing 22 gigawatts (GW) of installed solar power capacity by 2020.[1] At the end of September 2013, retailer IKEA announced that solar panel packages for houses would be sold at 17 UK stores by July 2014. The decision followed a successful pilot project at their Thurrock store, during which one system was sold almost every day. The panels were manufactured by the Chinese company Hanergy.[23] This partnership did not last and in October 2015 Ikea ended its relationship with Hanergy.[24]
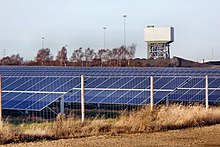
Colliery behind a solar farm in North Yorkshire in 2017
By 2016 the total installed capacity was over 10,000MW. In the summer half-year from April to September 2016, UK solar panels produced more electricity (6,964GWh) than did coal power (6,342GWh); each meeting about 5% of demand.[25]
UK solar PV installed capacity at the end of 2017 was 12.8GW, representing a 3.4% share of total electricity generation.[16] Provisionally, as of the end of January 2019 there was 13,123MW installed UK solar capacity across 979,983 installations. This is an increase of 323MW in slightly more than a year.[26] A new record peak generation from photovoltaics was set at 10.1GW on 20 April 2023.[27]
New solar PV installations slowed in 2020, though to a lesser extent, with 217MW being added in 2020 compared with 273MW in 2019. COVID-19 restrictions may have caused delays in some projects.[16]
2022 saw a big increase in domestic installations with over 130,000 installations added in the 10kW or less range, to take the total number of these small-scale installations to 1,179,495.[28] Total capacity as of February 2023 stood at 14,432MW, with an average of 72MW added each month over the previous six months.[28]
According to a report on behalf of the European Commission, in 2015 the United Kingdom had 2,499MW of residential solar PV capacity, with 775,000residential solar PV producers, representing 2.7% of households.[30] The average size of residential solar PV systems was estimated to be 3.25kW, and the technical potential for residential solar PV in the United Kingdom was estimated at 41,636MW.[30]
MCS (Microgeneration Certification Scheme) claim 61,320 UK properties had solar panels installed in 2021, an increase of 71% on the previous year.[31] The average payback time for residential solar PV in the UK was 11.4 years as of 2015,[30] but subsequent increases in the price of domestic energy have significantly decreased this. The April 2022 rise in the price cap saw payback times reduced on average by 2.5 years.[32]
Some of the advantages of small scale residential solar include eliminating the need for extra land, keeping cost saving advantages in local communities and empowering households to become producer/consumers of renewable electricity, raising awareness of wasteful consumption habits and environmental issues through direct experience. It will take anything from 4 to 20years to recoup the money spent on solar panels, this depends on a number of factors for example how many modules you have, how big they are, if they are south facing and where you live. Some studies have found that feed in tariff schemes have disproportionately benefited wealthier households with little or no assistance to help poorer household access financial loans or affordable schemes, whilst the costs of schemes are distributed evenly across utility bills.
In his Spring Statement of March 2022, Chancellor Rishi Sunak announced a reduction of VAT on the installation of energy-saving materials (including solar PV systems) to 0% (previously 5%) for a period of five years from 1 April 2022, stating "the measure is intended to incentivise the take-up of ESMs in line with the government’s net zero objectives".[33]
On 13 July 2011, construction of the largest solar park in the United Kingdom was completed in Newark-on-Trent in Nottinghamshire. The 4.9MW free-field system was built in just seven weeks after being granted planning permission. The system generates an estimated 4,860MWh of electricity (an average power of 560kW) into the national grid each year.[39] There are several other examples of 4–5MW field arrays of photovoltaics in the UK, including the 5MW Language Solar Park, the 5MW Westmill Solar Farm, the 4.51MW Marsten Solar Farm and Toyota's 4.6MW plant in Burnaston, Derbyshire.[40]
The first large solar farm in the United Kingdom, a 32MW solar farm, began construction in November 2012 in Leicestershire, between the runways of the former military airfield, Wymeswold.[41]
As of June 2014 there were 18 schemes generating more than 5MW and 34 in planning or construction in Wales.[42]
In 2023 the queue for grid connection was a problem.[43]
Planning considerations
Adding solar panels to the external elevations and roofs of a dwelling will change the appearance of both the property and the local street view. This in some cases will require planning permission from the local authority. For a Listed Building or in a Conservation Area, planning permission is mandatory. Otherwise, the owner of a domestic dwelling where solar panels are being installed can in most cases proceed under their Permitted Development rights, as long as certain height limitations are adhered to.
Government programmes
The Energy Saving Trust that administers government grants for domestic photovoltaic systems, the Low Carbon Building Programme, estimated that an installation for an average-sized house would cost between £5,000–£8,000, with most domestic systems usually between 1.5 and 3kWp, and yield annual savings between £150 and £200 (in 2008).[44]
The Green Energy for Schools programme was intended to provide 100 schools across the UK with solar panels. The first school in Wales was at Tavernspite, in Pembrokeshire, and received panels worth £20,000.[45]
The average UK home consumes about 3,000 kWh of electricity per year, equivalent to about 1ton of CO2 per home (dependent on electricity industry energy mix). That equates to 25 million tons of CO2 per year from UK domestic electricity consumption. As of September2019[update], there is no compulsion for new builds to incorporate any solar power generation.
Feed-in tariff
This section needs to be updated. Please help update this article to reflect recent events or newly available information.(April 2019)
Discussion on implementation of a feed-in tariff programme concluded on 26 September 2008, and the results were published in 2009.[46] The UK government agreed in April 2010 to pay for all grid-connected generated electricity at an initial rate of up to 41.3pence (US$0.67) per kWh, whether used locally or exported.[47] The rates proved more attractive than necessary, and in August 2011, were drastically reduced for installations over 50kW,[48] a policy change criticised as marking "the end of the UK's solar industry as we know it".[49] Subsequently, feed-in tariff rates were adjusted annually by the government,[50] and a requirement was introduced for new claims that the home's rating on the Energy Performance Certificate (EPC) had to be 'D' or better.[51] The amount of electricity exported is not usually measured for domestic installations; instead it is calculated by assuming that 50% of the electricity produced is exported into the grid.
The Feed-in Tariff was closed to new entries on 1 April 2019, but households are still able to claim on existing tariffs where available.
Smart Export Guarantee
On 10 June 2019, Ofgem announced[54] that BEIS had introduced the Smart Export Guarantee (SEG), in force from 1 January 2020. This is not a direct replacement of the feed-in tariff scheme, but rather a new initiative that rewards solar generators for electricity exported to the grid. Energy suppliers with more than 150,000 domestic customers must provide at least one export tariff.[55] The export tariff rate must be greater than zero. Export is measured by smart meters which the energy supplier will install free of charge.
The Contract for Difference (CfD) scheme, introduced in 2013 to replace the Renewables Obligation, excluded solar PV schemes from the competitive auctions in 2015. The majority of successful CfD auction bidders came from the wind sector. In 2020 the UK government reversed this decision, opening the door for PV projects to compete in the CfD auctions against onshore wind projects.[57]
Future
Decentralised smaller scale generators which are not connected directly to the transmission network are forecast to increase.[58] New solar farms and battery storage may help to meet increased demand from electric vehicles.[59]
Microgeneration is the small-scale production of heat or electric power from a "low carbon source," as an alternative or supplement to traditional centralized grid-connected power.
Many countries and territories have installed significant solar power capacity into their electrical grids to supplement or provide an alternative to conventional energy sources. Solar power plants use one of two technologies:
Solar power is a fast-growing industry in Australia. As of September 2023, Australia's over 3.60 million solar PV installations had a combined capacity of 32.9 GW photovoltaic (PV) solar power, of which at least 3,823 MW were installed in the preceding 12 months. In 2019, 59 solar PV projects with a combined capacity of 2,881 MW were either under construction, constructed or due to start construction having reached financial closure. Solar accounted for 12.4% of Australia's total electrical energy production in 2021.
Spain is one of the first countries to deploy large-scale solar photovoltaics, and is the world leader in concentrated solar power (CSP) production.
India's solar power installed capacity was 81.813 GWAC as of 31 March 2024.
Solar power accounted for an estimated 10.7% electricity in Germany in 2022, up from 1.9% in 2010 and less than 0.1% in 2000.
Financial incentives for photovoltaics are incentives offered to electricity consumers to install and operate solar-electric generating systems, also known as photovoltaics (PV).
Renewable energy in the United Kingdom contributes to production for electricity, heat, and transport.
A feed-in tariff is a policy mechanism designed to accelerate investment in renewable energy technologies by offering long-term contracts to renewable energy producers. This means promising renewable energy producers an above-market price and providing price certainty and long-term contracts that help finance renewable energy investments. Typically, FITs award different prices to different sources of renewable energy in order to encourage the development of one technology over another. For example, technologies such as wind power and solar PV are awarded a higher price per kWh than tidal power. FITs often include a "digression": a gradual decrease of the price or tariff in order to follow and encourage technological cost reductions.
Solar power includes solar farms as well as local distributed generation, mostly on rooftops and increasingly from community solar arrays. In 2023, utility-scale solar power generated 164.5 terawatt-hours (TWh), or 3.9% of electricity in the United States. Total solar generation that year, including estimated small-scale photovoltaic generation, was 238 TWh.
A photovoltaic system, also called a PV system or solar power system, is an electric power system designed to supply usable solar power by means of photovoltaics. It consists of an arrangement of several components, including solar panels to absorb and convert sunlight into electricity, a solar inverter to convert the output from direct to alternating current, as well as mounting, cabling, and other electrical accessories to set up a working system. It may also use a solar tracking system to improve the system's overall performance and include an integrated battery.
Feed-in tariffs in Australia are the feed-in tariffs (FITs) paid under various State schemes to non-commercial producers of electricity generated by solar photovoltaic (PV) systems using solar panels. They are a way of subsidising and encouraging uptake of renewable energy and in Australia have been enacted at the State level, in conjunction with a federal mandatory renewable energy target.
Solar power has been growing rapidly in the U.S. state of California because of high insolation, community support, declining solar costs, and a renewable portfolio standard which requires that 60% of California's electricity come from renewable resources by 2030, with 100% by 2045. Much of this is expected to come from solar power via photovoltaic facilities or concentrated solar power facilities.
Solar power in Greece has been driven by a combination of government incentives and equipment cost reductions. The installation boom started in the late 2000s with feed-in tariffs has evolved into a market featuring auctions, power purchase agreements, and self-generation. The country's relatively high level of solar insolation is an advantage boosting the effectiveness of solar panels; within Europe, Greece receives 50% more solar irradiation than Germany.
A feed-in tariff (FIT) is paid by energy suppliers in the United Kingdom if a property or organisation generates their own electricity using technology such as solar panels or wind turbines and feeds any surplus back to the grid. The FIT scheme was imposed on suppliers by the UK government, and applied to installations completed between July 2009 and March 2019.
A rooftop solar power system, or rooftop PV system, is a photovoltaic (PV) system that has its electricity-generating solar panels mounted on the rooftop of a residential or commercial building or structure. The various components of such a system include photovoltaic modules, mounting systems, cables, solar inverters and other electrical accessories.
Solar power is an important contributor to electricity generation in Italy, accounting for 8% of the total in 2017. As of 2022, the country has a total installed capacity of 22.56 GW. In 2019, Italy set a national goal of reaching 50 GW by 2030.
Solar power in France including overseas territories reached an installed capacity figure of 11.2 GW in 2020, and rose further to 17.1 GW at the end of 2022. Government plans announced in 2022 foresee solar PV capacity in France rising to 100 GW by 2050.
Solar power in South Africa includes photovoltaics (PV) as well as concentrated solar power (CSP). As of 2023, South Africa had over 2700 MW of installed PV solar power capacity in its grid, in addition to 500 MW of CSP. Installed capacity is expected to reach 8,400 MW by 2030.
Solar power in Switzerland has demonstrated consistent capacity growth since the early 2010s, influenced by government subsidy mechanisms such as the implementation of the feed-in tariff in 2009 and the enactment of the revised Energy Act in 2018. By the end of 2022, solar photovoltaic (PV) capacity had reached 4.7 GW, a notable increase from the 0.1 GW recorded in 2010. Concurrently, the contribution of solar power to electricity generation also rose, climbing from 0.1% in 2010 to 6.2% in 2022.
↑ "Snapshot of Global PV 1992–2014"(PDF). iea-pvps.org/index.php?id=32. International Energy Agency – Photovoltaic Power Systems Programme. 30 March 2015. Archived from the original on 7 April 2015.
1 2 3 4 5 6 7 8 "Energy Trends: UK renewables". Department of Energy & Climate Change. June 2021. p.Renewable electricity capacity and generation (ET 6.1 – quarterly). Retrieved 21 June 2021.
Companies with headquarters and/or registered office in the UK but no applicable energy operations within the country shown in italics1Ultimate parent company is not UK-based 2Integrated in the United States, no generation or supply activities in the UK
This page is based on this Wikipedia article Text is available under the CC BY-SA 4.0 license; additional terms may apply. Images, videos and audio are available under their respective licenses.