Space-based measurements of carbon dioxide

Last updated

Artist's conception of OCO-2, the second successful high precision (better than 0.3%) CO2 observing satellite. Orbiting Carbon Observatory (OCO)-2.jpg
Artist's conception of OCO-2, the second successful high precision (better than 0.3%) CO2 observing satellite.

Space-based measurements of carbon dioxide (CO2) are used to help answer questions about Earth's carbon cycle. There are a variety of active and planned instruments for measuring carbon dioxide in Earth's atmosphere from space. The first satellite mission designed to measure CO2 was the Interferometric Monitor for Greenhouse Gases (IMG) on board the ADEOS I satellite in 1996. This mission lasted less than a year. Since then, additional space-based measurements have begun, including those from two high-precision (better than 0.3% or 1 ppm) satellites (GOSAT and OCO-2). Different instrument designs may reflect different primary missions.

Contents

Purposes and highlights of findings

There are outstanding questions in carbon cycle science that satellite observations can help answer. The Earth system absorbs about half of all anthropogenic CO2 emissions. [1] However, it is unclear exactly how this uptake is partitioned to different regions across the globe. It is also uncertain how different regions will behave in terms of CO2 flux under a different climate. For example, a forest may increase CO2 uptake due to the fertilization or β-effect, [2] or it could release CO2 due to increased metabolism by microbes at higher temperatures. [3] These questions are difficult to answer with historically spatially and temporally limited data sets.

Even though satellite observations of CO2 are somewhat recent, they have been used for a number of different purposes, some of which are highlighted here:

Challenges

Remote sensing of trace gases has several challenges. Most techniques rely on observing infrared light reflected off Earth's surface. Because these instruments use spectroscopy, at each sounding footprint a spectrum is recorded—this means there is a significantly (about 1000×) more data to transfer than what would be required of just an RGB pixel. Changes in surface albedo and viewing angles may affect measurements, and satellites may employ different viewing modes over different locations; these may be accounted for in the algorithms used to convert raw into final measurements. As with other space-based instruments, space debris must be avoided to prevent damage.[ citation needed ]

Water vapor can dilute other gases in air and thus change the amount of CO2 in a column above the surface of the Earth, so often column-average dry-air mole fractions (XCO2) are reported instead. To calculate this, instruments may also measure O2, which is diluted similarly to other gases, or the algorithms may account for water and surface pressure from other measurements. [18] Clouds may interfere with accurate measurements so platforms may include instruments to measure clouds. Because of measurement imperfections and errors in fitting signals to obtain XCO2, space-based observations may also be compared with ground-based observations such as those from the TCCON. [19]

List of instruments

Instrument/satellitePrimary institution(s)Service datesApproximate usable
daily soundings
Approximate
sounding size
Public dataNotesRefs
HIRS-2/TOVS (NOAA-10) NOAA (U.S.)July 1987–
June 1991
100 × 100 kmNoMeasuring CO2 was not an original mission goal [20]
IMG (ADEOS I) NASDA (Japan)17 August 1996–
June 1997
508 × 8 kmNoFTS system [21]
SCIAMACHY (Envisat) ESA, IUP University of Bremen (Germany)1 March 2002–
May 2012
5,00030 × 60 kmYes [22] [23]
AIRS (Aqua) JPL (U.S.)4 May 2002–
ongoing
18,00090 × 90 kmYes [24] [25] [26]
IASI (MetOp) CNES/EUMETSAT (ESA)19 October 200620-39 km diameterYes (only a few days) [27] [28]
GOSAT JAXA (Japan)23 January 2009–
ongoing
10,00010.5 km diameterYes [29] First dedicated high precision (<0.3%) mission, also measures CH4 [30] [31]
OCO JPL (U.S.)24 February 2009100,0001.3 × 2.2 kmN/AFailed to reach orbit [32]
OCO-2 JPL (U.S.)2 July 2014–
ongoing
100,0001.3 × 2.2 kmYes [33] High precision (<0.3%) [34]
GHGSat-D (or Claire)GHGSat (Canada)21 June 2016–
ongoing
~2–5 images,
10,000+ pixels each
12 × 12 km,
50 m resolution image
available to selected partners only CubeSat and imaging spectrometer using Fabry-Pérot interferometer [35]
TanSat (or CarbonSat) CAS (China)21 December 2016–
ongoing
100,0001 × 2 kmYes (L1B radiances) [36] [37] [38]
GAS FTS aboard FY-3D CMA (China)15 November 2017–
ongoing [39]
15,00013 km diameterNo [40] [41]
GMI (GaoFen-5, (fr)) CAS (China)8 May 2018–
ongoing [42]
10.3 km diameterNoSpatial heterodyne [43] [44]
GOSAT-2 JAXA (Japan)29 October 2018–
ongoing [45]
10,000+9.7 km diameterYes (L1B radiances) [46] Will also measure CH4 and CO [47]
OCO-3 JPL (U.S.)4 May 2019–
ongoing [48]
100,000<4.5 × 4.5 kmYes [49] Mounted on the ISS [50]
MicroCarb CNES (France)expected 2022~30,0004.5 × 9 kmWill likely also measure CH4 [51]
GOSAT-3 JAXA (Japan)expected 2022
GeoCARB University of Oklahoma (U.S.)expected 2023~800,0003 × 6 kmFirst CO2-observing geosynchronous satellite, will also measure CH4 and CO [52] [53]

Partial column measurements

In addition to the total column measurements of CO2 down to the ground, there have been several limb sounders that have measured CO2 through the edge of Earth's upper atmosphere, and thermal instruments that measure the upper atmosphere during the day and night.

Conceptual Missions

There have been other conceptual missions which have undergone initial evaluations but have not been chosen to become a part of space-based observing systems. These include:

Related Research Articles

The mesopause is the point of minimum temperature at the boundary between the mesosphere and the thermosphere atmospheric regions. Due to the lack of solar heating and very strong radiative cooling from carbon dioxide, the mesosphere is the coldest region on Earth with temperatures as low as -100 °C. The altitude of the mesopause for many years was assumed to be at around 85 km (53 mi), but observations to higher altitudes and modeling studies in the last 10 years have shown that in fact there are two mesopauses - one at about 85 km and a stronger one at about 100 km (62 mi), with a layer of slightly warmer air between them.

<span class="mw-page-title-main">Radiative forcing</span> Difference between solar irradiance absorbed by the Earth and energy radiated back to space

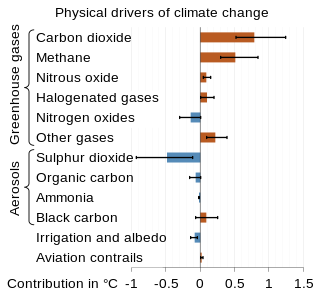
Radiative forcing is a concept used in climate science to quantify the change in energy balance in the Earth's atmosphere caused by various factors, such as concentrations of greenhouse gases, aerosols, and changes in solar radiation. In more technical terms, it is "the change in the net, downward minus upward, radiative flux due to a change in an external driver of climate change." These external drivers are distinguished from feedbacks and variability that are internal to the climate system, and that further influence the direction and magnitude of imbalance.

<span class="mw-page-title-main">Keeling Curve</span> Graph of atmospheric CO2 from 1958 to the present

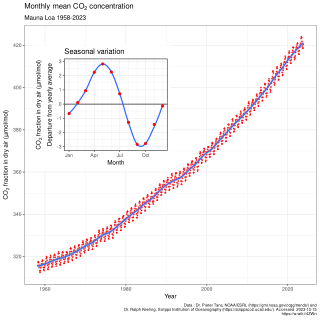
The Keeling Curve is a graph of the accumulation of carbon dioxide in the Earth's atmosphere based on continuous measurements taken at the Mauna Loa Observatory on the island of Hawaii from 1958 to the present day. The curve is named for the scientist Charles David Keeling, who started the monitoring program and supervised it until his death in 2005.

<span class="mw-page-title-main">Volcanic gas</span> Gases given off by active volcanoes

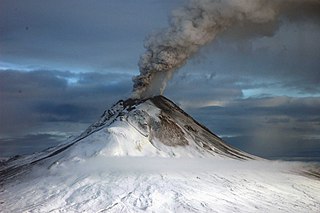
Volcanic gases are gases given off by active volcanoes. These include gases trapped in cavities (vesicles) in volcanic rocks, dissolved or dissociated gases in magma and lava, or gases emanating from lava, from volcanic craters or vents. Volcanic gases can also be emitted through groundwater heated by volcanic action.

<span class="mw-page-title-main">Atmosphere of Mars</span> Layer of gases surrounding planet Mars

The atmosphere of Mars is the layer of gases surrounding Mars. It is primarily composed of carbon dioxide (95%), molecular nitrogen (2.85%), and argon (2%). It also contains trace levels of water vapor, oxygen, carbon monoxide, hydrogen, and noble gases. The atmosphere of Mars is much thinner than Earth's. The average surface pressure is only about 610 pascals (0.088 psi) which is less than 1% of the Earth's value.

<span class="mw-page-title-main">Orbiting Carbon Observatory</span> Failed NASA climate satellite

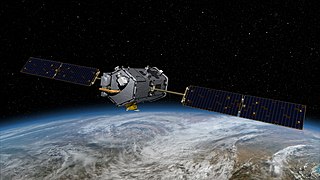
The Orbiting Carbon Observatory (OCO) is a NASA satellite mission intended to provide global space-based observations of atmospheric carbon dioxide. The original spacecraft was lost in a launch failure on 24 February 2009, when the payload fairing of the Taurus rocket which was carrying it failed to separate during ascent. The added mass of the fairing prevented the satellite from reaching orbit. It subsequently re-entered the atmosphere and crashed into the Indian Ocean near Antarctica. The replacement satellite, Orbiting Carbon Observatory-2, was launched 2 July 2014 aboard a Delta II rocket. The Orbiting Carbon Observatory-3, a stand-alone payload built from the spare OCO-2 flight instrument, was installed on the International Space Station's Kibō Exposed Facility in May 2019.

<span class="mw-page-title-main">Carbon dioxide in Earth's atmosphere</span> Atmospheric constituent and greenhouse gas

In Earth's atmosphere, carbon dioxide is a trace gas that plays an integral part in the greenhouse effect, carbon cycle, photosynthesis and oceanic carbon cycle. It is one of several greenhouse gases in the atmosphere of Earth. The current global average concentration of CO2 in the atmosphere is 421 ppm as of May 2022 (0.04%). This is an increase of 50% since the start of the Industrial Revolution, up from 280 ppm during the 10,000 years prior to the mid-18th century. The increase is due to human activity. Burning fossil fuels is the main cause of these increased CO2 concentrations and also the main cause of climate change. Other large anthropogenic sources include cement production, deforestation, and biomass burning.

Carbon monitoring as part of greenhouse gas monitoring refers to tracking how much carbon dioxide or methane is produced by a particular activity at a particular time. For example, it may refer to tracking methane emissions from agriculture, or carbon dioxide emissions from land use changes, such as deforestation, or from burning fossil fuels, whether in a power plant, automobile, or other device. Because carbon dioxide is the greenhouse gas emitted in the largest quantities, and methane is an even more potent greenhouse gas, monitoring carbon emissions is widely seen as crucial to any effort to reduce emissions and thereby slow climate change.

Fugitive emissions are leaks and other irregular releases of gases or vapors from a pressurized containment – such as appliances, storage tanks, pipelines, wells, or other pieces of equipment – mostly from industrial activities. In addition to the economic cost of lost commodities, fugitive emissions contribute to local air pollution and may cause further environmental harm. Common industrial gases include refrigerants and natural gas, while less common examples are perfluorocarbons, sulfur hexafluoride, and nitrogen trifluoride.

<span class="mw-page-title-main">Greenhouse gas</span> Gas in an atmosphere that absorbs and emits radiation at thermal infrared wavelengths

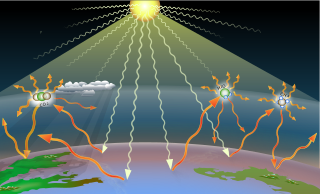
Greenhouse gases are the gases in the atmosphere that raise the surface temperature of planets such as the Earth. What distinguishes them from other gases is that they absorb the wavelengths of radiation that a planet emits, resulting in the greenhouse effect. The Earth is warmed by sunlight, causing its surface to radiate heat, which is then mostly absorbed by greenhouse gases. Without greenhouse gases in the atmosphere, the average temperature of Earth's surface would be about −18 °C (0 °F), rather than the present average of 15 °C (59 °F).

<span class="mw-page-title-main">Atmospheric methane</span> Methane in Earths atmosphere

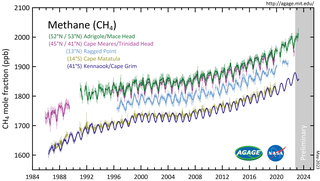
Atmospheric methane is the methane present in Earth's atmosphere. The concentration of atmospheric methane is increasing due to methane emissions, and is causing climate change. Methane is one of the most potent greenhouse gases. Methane's radiative forcing (RF) of climate is direct, and it is the second largest contributor to human-caused climate forcing in the historical period. Methane is a major source of water vapour in the stratosphere through oxidation; and water vapour adds about 15% to methane's radiative forcing effect. The global warming potential (GWP) for methane is about 84 in terms of its impact over a 20-year timeframe. and 28 in terms of its impact over a 100-year timeframe. The global temperature potential for methane is about 4 in terms of its impact over a 100-year timeframe.

<span class="mw-page-title-main">Greenhouse gas monitoring</span> Measurement of greenhouse gas emissions and levels

Greenhouse gas monitoring is the direct measurement of greenhouse gas emissions and levels. There are several different methods of measuring carbon dioxide concentrations in the atmosphere, including infrared analyzing and manometry. Methane and nitrous oxide are measured by other instruments. Greenhouse gases are measured from space such as by the Orbiting Carbon Observatory and networks of ground stations such as the Integrated Carbon Observation System.

<span class="mw-page-title-main">Total Carbon Column Observing Network</span>

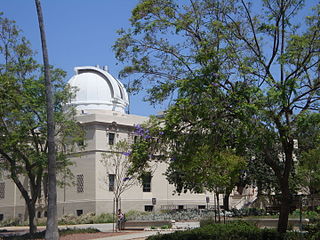
The Total Carbon Column Observing Network (TCCON) is a global network of instruments that measure the amount of carbon dioxide, methane, carbon monoxide, nitrous oxide and other trace gases in the Earth's atmosphere. The TCCON began in 2004 with the installation of the first instrument in Park Falls, Wisconsin, USA, and has since grown to 23 operational instruments worldwide, with 7 former sites.

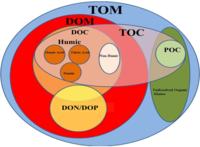
The atmospheric carbon cycle accounts for the exchange of gaseous carbon compounds, primarily carbon dioxide, between Earth's atmosphere, the oceans, and the terrestrial biosphere. It is one of the faster components of the planet's overall carbon cycle, supporting the exchange of more than 200 billion tons of carbon in and out of the atmosphere throughout the course of each year. Atmospheric concentrations of CO2 remain stable over longer timescales only when there exists a balance between these two flows. Methane, Carbon monoxide (CO), and other man-made compounds are present in smaller concentrations and are also part of the atmospheric carbon cycle.

<span class="mw-page-title-main">Orbiting Carbon Observatory 2</span> NASA climate satellite

Orbiting Carbon Observatory-2 (OCO-2) is an American environmental science satellite which launched on 2 July 2014. A NASA mission, it is a replacement for the Orbiting Carbon Observatory which was lost in a launch failure in 2009. It is the second successful high-precision CO2 observing satellite, after GOSAT.

Increasing methane emissions are a major contributor to the rising concentration of greenhouse gases in Earth's atmosphere, and are responsible for up to one-third of near-term global heating. During 2019, about 60% of methane released globally was from human activities, while natural sources contributed about 40%. Reducing methane emissions by capturing and utilizing the gas can produce simultaneous environmental and economic benefits.

Geostationary Carbon Cycle Observatory (GeoCarb) was an intended NASA Venture-class Earth observation mission that was designed to measure the carbon cycle. Originally intended to be mounted on a commercial geostationary communication satellite operated by SES S.A., a lack of hosting opportunities drove NASA to seek a standalone spacecraft to carry GeoCarb. GeoCarb was to be stationed over the Americas and make observations between 50° North and South latitudes. Its primary mission was to conduct observations of vegetation health and stress, as well as observe the processes that govern the carbon exchange of carbon dioxide, methane, and carbon monoxide between the land, atmosphere, and ocean.

<span class="mw-page-title-main">Orbiting Carbon Observatory 3</span>

The Orbiting Carbon Observatory-3 (OCO-3) is a NASA-JPL instrument designed to measure carbon dioxide in Earth's atmosphere. The instrument is mounted on the Japanese Experiment Module-Exposed Facility on board the International Space Station (ISS). OCO-3 was scheduled to be transported to space by a SpaceX Dragon from a Falcon 9 rocket on 30 April 2019, but the launch was delayed to 3 May, due to problems with the space station's electrical power system. This launch was further delayed to 4 May due to electrical issues aboard Of Course I Still Love You (OCISLY), the barge used to recover the Falcon 9’s first stage. OCO-3 was launched as part of CRS-17 on 4 May 2019 at 06:48 UTC. The nominal mission lifetime is ten years.

XCO2 is the column-averaged of carbon dioxide in the atmosphere, represented in parts per million (ppm). Rather than taking a single observation at the surface, an integration of atmospheric CO2 above a specific location is observed. The 'X' refers to the observation taking place from a satellite platform. CO2 observing satellites cannot observe green house gasses directly, but instead average the entire atmospheric column of CO2. These estimates from satellites need ground truthing to ensure that XCO2 retrievals are accurate, with an average accuracy from OCO 2 and GOSAT of 0.267 ± 1.56 ppm between September 2014 to December 2016.

References

  1. Schimel, David (November 2007). "Carbon cycle conundrums". Proceedings of the National Academy of Sciences. 104 (47): 18353–18354. Bibcode:2007PNAS..10418353S. doi: 10.1073/pnas.0709331104 . PMC   2141782 . PMID   17998533.
  2. Schimel, David; Stephens, Britton B.; Fisher, Joshua B. (January 2015). "Effect of increasing CO2 on the terrestrial carbon cycle". Proceedings of the National Academy of Sciences. 112 (2): 436–441. Bibcode:2015PNAS..112..436S. doi: 10.1073/pnas.1407302112 . PMC   4299228 . PMID   25548156.
  3. Cox, Peter M.; Pearson, David; Booth, Ben B.; et al. (February 2013). "Sensitivity of tropical carbon to climate change constrained by carbon dioxide variability" (PDF). Nature. 494 (7437): 341–344. Bibcode:2013Natur.494..341C. doi:10.1038/nature11882. PMID   23389447. S2CID   205232639.
  4. Kort, Eric A.; Frankenberg, Christian; Miller, Charles E.; et al. (September 2012). "Space-based observations of megacity carbon dioxide" (PDF). Geophysical Research Letters. 39 (17). L17806. Bibcode:2012GeoRL..3917806K. doi: 10.1029/2012GL052738 .
  5. Hammerling, Dorit M.; Michalak, Anna M.; O'Dell, Christopher; et al. (April 2012). "Global CO2 distributions over land from the Greenhouse Gases Observing Satellite (GOSAT)". Geophysical Research Letters. 39 (8): L08804. Bibcode:2012GeoRL..39.8804H. doi:10.1029/2012GL051203. hdl: 2060/20120011809 . S2CID   89616306.
  6. Hakkarainen, J.; Ialongo, I.; Tamminen, J. (November 2016). "Direct space-based observations of anthropogenic CO2 emission areas from OCO-2". Geophysical Research Letters. 43 (21): 11, 400–11, 406. Bibcode:2016GeoRL..4311400H. doi: 10.1002/2016GL070885 .
  7. Basu, S.; Guerlet, S.; Butz, A.; et al. (September 2013). "Global CO2 fluxes estimated from GOSAT retrievals of total column CO2". Atmospheric Chemistry and Physics. 13 (17): 8695–8717. Bibcode:2013ACP....13.8695B. doi: 10.5194/acp-13-8695-2013 .
  8. Deng, F.; Jones, D. B. A.; Henze, D. K.; et al. (April 2014). "Inferring regional sources and sinks of atmospheric CO2 from GOSAT XCO2 data". Atmospheric Chemistry and Physics. 14 (7): 3703–3727. Bibcode:2014ACP....14.3703D. doi: 10.5194/acp-14-3703-2014 .
  9. Wunch, D.; Wennberg, P. O.; Messerschmidt, J.; et al. (September 2013). "The covariation of Northern Hemisphere summertime CO2 with surface temperature in boreal regions". Atmospheric Chemistry and Physics. 13 (18): 9447–9459. Bibcode:2013ACP....13.9447W. doi: 10.5194/acp-13-9447-2013 .
  10. Keppel-Aleks, G.; Wennberg, P. O.; O'Dell, C. W.; et al. (April 2013). "Towards constraints on fossil fuel emissions from total column carbon dioxide". Atmospheric Chemistry and Physics. 13 (8): 4349–4357. Bibcode:2013ACP....13.4349K. doi: 10.5194/acp-13-4349-2013 .
  11. Ross, Adrian N.; Wooster, Martin J.; Boesch, Hartmut; et al. (August 2013). "First satellite measurements of carbon dioxide and methane emission ratios in wildfire plumes". Geophysical Research Letters. 40 (15): 4098–4102. Bibcode:2013GeoRL..40.4098R. doi:10.1002/grl.50733. hdl:2381/38907. S2CID   53691370.
  12. Silva, Sam J.; Arellano, Avelino F.; Worden, Helen M. (September 2013). "Toward anthropogenic combustion emission constraints from space-based analysis of urban CO2/CO sensitivity". Geophysical Research Letters. 40 (18): 4971–4976. Bibcode:2013GeoRL..40.4971S. doi: 10.1002/grl.50954 .
  13. Heymann, J.; et al. (February 2017). "CO2 emission of Indonesian fires in 2015 estimated from satellite-derived atmospheric CO2 concentrations". Geophysical Research Letters. 44 (3): 1537. Bibcode:2017GeoRL..44.1537H. doi:10.1002/2016GL072042. S2CID   132149226.
  14. Patra, Prabir Kumar; et al. (14 December 2016). Orbiting Carbon Observatory (OCO-2) tracks increase of carbon release to the atmosphere during the 2014-2016 El Niño. 2016 AGU Fall Meeting. 12–16 December 2016. San Francisco, California.
  15. Liu, Junjie; et al. (October 2017). "Contrasting carbon cycle responses of the tropical continents to the 2015–2016 El Niño". Science. 358 (6360). eaam5690. doi: 10.1126/science.aam5690 . PMID   29026011.
  16. Bowman, K. W.; et al. (October 2017). "Global and Brazilian Carbon Response to El Niño Modoki 2011-2010". Earth and Space Science. 4 (10): 637–660. arXiv: 1703.03778 . Bibcode:2017E&SS....4..637B. doi:10.1002/2016ea000204. S2CID   119375779.
  17. Nassar, R.; et al. (October 2017). "Quantifying CO2 Emissions from Individual Power Plants From Space". Geophysical Research Letters. 44 (19). Bibcode:2017GeoRL..4410045N. doi: 10.1002/2017GL074702 .
  18. Wunch, D.; Toon, G. C.; Blavier, J.-F. L.; et al. (May 2011). "The Total Carbon Column Observing Network". Philosophical Transactions of the Royal Society A: Mathematical, Physical and Engineering Sciences. 369 (1943): 2087–2112. Bibcode:2011RSPTA.369.2087W. doi: 10.1098/rsta.2010.0240 . PMID   21502178.
  19. Butz, A.; Guerlet, S.; Hasekamp, O.; et al. (July 2011). "Toward accurate CO2 and CH4 observations from GOSAT". Geophysical Research Letters. 38 (14). L14812. Bibcode:2011GeoRL..3814812B. doi: 10.1029/2011GL047888 .
  20. Chédin, A.; Serrar, S.; Scott, N. A.; et al. (September 2003). "First global measurement of midtropospheric CO2 from NOAA polar satellites: Tropical zone". Journal of Geophysical Research. 108 (D18): 4581. Bibcode:2003JGRD..108.4581C. doi: 10.1029/2003JD003439 .
  21. Kobayashi, Hirokazu; Shimota, Akiro; Kondo, Kayoko; et al. (November 1999). "Development and Evaluation of the Interferometric Monitor for Greenhouse Gases: a High-throughput Fourier-transform Infrared Radiometer for Nadir Earth Observation". Applied Optics. 38 (33): 6801–6807. Bibcode:1999ApOpt..38.6801K. doi:10.1364/AO.38.006801. PMID   18324219.
  22. "SCIAMACHY Data Products at IUP/IFE Bremen". IUP Bremen. Retrieved 28 January 2017.
  23. Buchwitz, M.; de Beek, R.; Burrows, J. P.; et al. (March 2005). "Atmospheric methane and carbon dioxide from SCIAMACHY satellite data: initial comparison with chemistry and transport models". Atmospheric Chemistry and Physics. 5 (4): 941–962. Bibcode:2005ACP.....5..941B. doi: 10.5194/acp-5-941-2005 .
  24. "CO2 Documents". AIRS Version 5 Documentation. NASA /Goddard Space Flight Center. 19 November 2015. Retrieved 11 February 2017.
  25. Olsen, Edward T.; Chahine, Moustafa T.; Chen, Luke L.; et al. (April 2008). Shen, Sylvia S; Lewis, Paul E (eds.). "Retrieval of mid-tropospheric CO2 directly from AIRS measurements". Proceedings of the SPIE. Algorithms and Technologies for Multispectral, Hyperspectral, and Ultraspectral Imagery XIV. 6966. 696613. Bibcode:2008SPIE.6966E..13O. doi:10.1117/12.777920. S2CID   53542643.
  26. Chahine, M. T.; Chen, Luke; Dimotakis, Paul; et al. (September 2008). "Satellite remote sounding of mid-tropospheric CO2". Geophysical Research Letters. 35 (17). L17807. Bibcode:2008GeoRL..3517807C. doi: 10.1029/2008GL035022 .
  27. "IASI Sounding Products". National Oceanic and Atmospheric Administration. Retrieved 22 October 2017.
  28. Liuzzia, G.; Masielloa, G.; Serioa, C.; et al. (October 2016). "Physical inversion of the full IASI spectra: Assessment of atmospheric parameters retrievals, consistency of spectroscopy and forward modelling". Journal of Quantitative Spectroscopy and Radiative Transfer. 182: 128–157. Bibcode:2016JQSRT.182..128L. doi: 10.1016/j.jqsrt.2016.05.022 .
  29. "GOSAT Data Archive Service (GDAS)". National Institute for Environmental Studies. Retrieved 28 January 2017.
  30. Kuze, Akihiko; Suto, Hiroshi; Nakajima, Masakatsu; et al. (December 2009). "Thermal and near infrared sensor for carbon observation Fourier-transform spectrometer on the Greenhouse Gases Observing Satellite for greenhouse gases monitoring". Applied Optics. 48 (35). 6716. Bibcode:2009ApOpt..48.6716K. doi:10.1364/AO.48.006716. PMID   20011012.
  31. Kuze, Akihiko; Suto, Hiroshi; Shiomi, Kei; et al. (June 2016). "Update on GOSAT TANSO-FTS performance, operations, and data products after more than 6 years in space". Atmospheric Measurement Techniques. 9 (6): 2445–2461. Bibcode:2016AMT.....9.2445K. doi: 10.5194/amt-9-2445-2016 .
  32. Overview of the Orbiting Carbon Observatory (OCO) Mishap Investigation Results For Public Release (PDF) (Report). NASA. Retrieved 5 November 2018.
  33. "CO2 Virtual Science Data Environment". NASA /Jet Propulsion Laboratory. Archived from the original on 12 February 2017. Retrieved 11 February 2017.
  34. Eldering, Annmarie; O'Dell, Chris W.; Wennberg, Paul O.; et al. (February 2017). "The Orbiting Carbon Observatory-2: First 18 months of science data products". Atmospheric Measurement Techniques Discussions. 10 (2): 549–563. Bibcode:2017AMT....10..549E. doi: 10.5194/amt-10-549-2017 .
  35. "GHGSat Global Emissions Monitoring". GHGSat. Retrieved 11 February 2017.
  36. "FENGYUN Satellite Data Center". National Satellite Meteorological Center. Retrieved 27 October 2017.
  37. Liu, Yi; Yang, DongXu; Cai, ZhaoNan (May 2013). "A retrieval algorithm for TanSat XCO2 observation: Retrieval experiments using GOSAT data". Chinese Science Bulletin. 58 (13): 1520–1523. Bibcode:2013ChSBu..58.1520L. doi: 10.1007/s11434-013-5680-y . S2CID   55268547.
  38. Liu, Jia (22 December 2016). "China Launches Satellite to Monitor Global Carbon Emissions". Chinese Academy of Sciences. Xinhua. Retrieved 11 February 2017.
  39. Clark, Stephen (14 November 2017). "Chinese weather satellite launched into polar orbit". Spaceflight Now. Retrieved 11 May 2018.
  40. "Satellite: FY-3D". WMO Observing Systems Capability Analysis and Review Tool. Retrieved 22 October 2017.
  41. "China successfully launched FY-3D polar orbiting meteorological satellite". China Meteorological Administration. Retrieved 16 November 2017.
  42. Barbosa, Rui (8 May 2018). "Chinese weather satellite launched into polar orbit". NASAspaceflight.com. Retrieved 11 May 2018.
  43. Chen, Liangfu (2016). Mission Overview GaoFen-5 (PDF). CEOS-ACC-12 meeting. 13–15 October 2016. Seoul, Korea.
  44. Liu, Yi (2017). CO2 Monitoring from Space: TanSat and GF-5/GMI Mission Status (PDF). The 9th GEOSS Asia-Pacific Symposium. 11–13 January 2017. Tokyo, Japan.
  45. "Launch Results of the H-IIA F40 Encapsulating GOSAT-2 and KhalifaSat". Japan Aerospace Exploration Agency. 29 October 2018. Retrieved 5 November 2018.
  46. "GOSAT-2 Product Archive". National Institute for Environmental Studies. Retrieved 25 May 2020.
  47. Matsunaga, T.; Maksyutov, S.; Morino, I.; et al. (2016). The Status of NIES GOSAT-2 Project and NIES Satellite Observation Center (PDF). 12th International Workshop on Greenhouse Gas Measurements from Space. 7–9 June 2016. Kyoto, Japan.
  48. Potter, Sean (4 May 2019). "SpaceX Dragon Heads to Space Station with NASA Science, Cargo". nasa.gov. NASA. Retrieved 4 August 2019.
  49. "GES Disc Search, OCO-3". NASA. Retrieved 25 May 2020.
  50. Eldering, Annmarie; Worden, John (October 2016). OCO-3 Science and Status for CEOS (PDF) (Report). Committee on Earth Observation Satellites.
  51. Buisson, Francois; Pradines, Didier; Pascal, Veronique; et al. (9 June 2016). An Introduction to MicroCarb, First European Program for CO2 Monitoring (PDF). 12th International Workshop on Greenhouse Gas Measurements from Space, 7–9 June 2016, Kyoto, Japan.
  52. Polonsky, I. N.; O'Brien, D. M.; Kumer, J. B.; et al. (April 2014). "Performance of a geostationary mission, geoCARB, to measure CO2, CH4 and CO column-averaged concentrations". Atmospheric Measurement Techniques. 7 (4): 959–981. Bibcode:2014AMT.....7..959P. doi: 10.5194/amt-7-959-2014 .
  53. Moore, Berrien III (8 June 2017). GeoCARB, Geostationary Carbon Observatory (PDF). 13th International Workshop on Greenhouse Gas Measurements from Space. 6–8 June 2017. Helsinki, Finland.
  54. "SABER: A Pioneer in Atmospheric Science". NASA Langley Research Center. 2001. Retrieved 28 August 2019.
  55. "ACE: Atmospheric Chemistry Experiment". University of Waterloo. Retrieved 28 August 2019.
  56. "Solar Occultation For Ice Experiment". GATS, Inc. 2010. Retrieved 28 August 2019.
  57. Wang, J. S.; Kawa, S. R.; Eluszkiewicz, J.; et al. (December 2014). "A regional CO2 observing system simulation experiment for the ASCENDS satellite mission". Atmospheric Chemistry and Physics. 14 (23): 12897–12914. Bibcode:2014ACP....1412897W. doi: 10.5194/acp-14-12897-2014 .
  58. Key, Richard; Sander, Stanley; Eldering, Annmarie; et al. (2012). The Geostationary Fourier Transform Spectrometer. 2012 IEEE Aerospace Conference. 3–10 March 2012. Big Sky, Montana. doi:10.1109/AERO.2012.6187164.
  59. "AIM-North The Atmospheric Imaging Mission for Northern regions". AIM-North.ca. Retrieved 11 May 2018.
  60. Nassar, R.; McLinden, C.; Sioris, C.; et al. (2019). "The Atmospheric Imaging Mission for Northern Regions: AIM-North". Canadian Journal of Remote Sensing. 45 (3–4): 781–811. Bibcode:2019CaJRS..45..423N. doi: 10.1080/07038992.2019.1643707 .
  61. Bovensmann, H.; Buchwitz, M.; Burrows, J. P.; Reuter, M.; Krings, T.; Gerilowski, K.; Schneising, O.; Heymann, J.; Tretner, A.; Erzinger, J. (2010). "A remote sensing technique for global monitoring of power plant CO2 emissions from space and related applications". Atmospheric Measurement Techniques. 3 (4): 423–442. Bibcode:2010AMT.....3..781B. doi: 10.5194/amt-3-781-2010 . ISSN   1867-8548.