
Spectroscopy is the field of study that measures and interprets the electromagnetic spectra that result from the interaction between electromagnetic radiation and matter as a function of the wavelength or frequency of the radiation. Matter waves and acoustic waves can also be considered forms of radiative energy, and recently gravitational waves have been associated with a spectral signature in the context of the Laser Interferometer Gravitational-Wave Observatory (LIGO).
Fourier-transform spectroscopy is a measurement technique whereby spectra are collected based on measurements of the coherence of a radiative source, using time-domain or space-domain measurements of the radiation, electromagnetic or not. It can be applied to a variety of types of spectroscopy including optical spectroscopy, infrared spectroscopy, nuclear magnetic resonance (NMR) and magnetic resonance spectroscopic imaging (MRSI), mass spectrometry and electron spin resonance spectroscopy.
Interferometry is a technique which uses the interference of superimposed waves to extract information. Interferometry typically uses electromagnetic waves and is an important investigative technique in the fields of astronomy, fiber optics, engineering metrology, optical metrology, oceanography, seismology, spectroscopy, quantum mechanics, nuclear and particle physics, plasma physics, biomolecular interactions, surface profiling, microfluidics, mechanical stress/strain measurement, velocimetry, optometry, and making holograms.
Mass spectrometry (MS) is an analytical technique that is used to measure the mass-to-charge ratio of ions. The results are presented as a mass spectrum, a plot of intensity as a function of the mass-to-charge ratio. Mass spectrometry is used in many different fields and is applied to pure samples as well as complex mixtures.
This is an index of articles relating to electronics and electricity or natural electricity and things that run on electricity and things that use or conduct electricity.

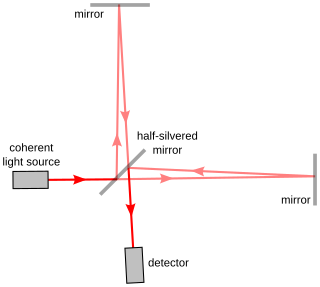
The Michelson interferometer is a common configuration for optical interferometry and was invented by the 19/20th-century American physicist Albert Abraham Michelson. Using a beam splitter, a light source is split into two arms. Each of those light beams is reflected back toward the beamsplitter which then combines their amplitudes using the superposition principle. The resulting interference pattern that is not directed back toward the source is typically directed to some type of photoelectric detector or camera. For different applications of the interferometer, the two light paths can be with different lengths or incorporate optical elements or even materials under test.

X-ray spectroscopy is a general term for several spectroscopic techniques for characterization of materials by using x-ray radiation.
Fourier-transform ion cyclotron resonance mass spectrometry is a type of mass analyzer (or mass spectrometer) for determining the mass-to-charge ratio (m/z) of ions based on the cyclotron frequency of the ions in a fixed magnetic field. The ions are trapped in a Penning trap (a magnetic field with electric trapping plates), where they are excited (at their resonant cyclotron frequencies) to a larger cyclotron radius by an oscillating electric field orthogonal to the magnetic field. After the excitation field is removed, the ions are rotating at their cyclotron frequency in phase (as a "packet" of ions). These ions induce a charge (detected as an image current) on a pair of electrodes as the packets of ions pass close to them. The resulting signal is called a free induction decay (FID), transient or interferogram that consists of a superposition of sine waves. The useful signal is extracted from this data by performing a Fourier transform to give a mass spectrum.

Near-field scanning optical microscopy (NSOM) or scanning near-field optical microscopy (SNOM) is a microscopy technique for nanostructure investigation that breaks the far field resolution limit by exploiting the properties of evanescent waves. In SNOM, the excitation laser light is focused through an aperture with a diameter smaller than the excitation wavelength, resulting in an evanescent field on the far side of the aperture. When the sample is scanned at a small distance below the aperture, the optical resolution of transmitted or reflected light is limited only by the diameter of the aperture. In particular, lateral resolution of 6 nm and vertical resolution of 2–5 nm have been demonstrated.

Attenuated total reflection (ATR) is a sampling technique used in conjunction with infrared spectroscopy which enables samples to be examined directly in the solid or liquid state without further preparation.

A nondispersive infrared sensor is a simple spectroscopic sensor often used as a gas detector. It is non-dispersive in the fact that no dispersive element is used to separate out the broadband light into a narrow spectrum suitable for gas sensing. The majority of NDIR sensors use a broadband lamp source and an optical filter to select a narrow band spectral region that overlaps with the absorption region of the gas of interest. In this context narrow may be 50-300nm bandwidth. Modern NDIR sensors may use Microelectromechanical systems (MEMs) or mid IR LED sources, with or without an optical filter.
Fellgett's advantage or the multiplex advantage is an improvement in signal-to-noise ratio (SNR) that is gained when taking multiplexed measurements rather than direct measurements. The name is derived from P. B. Fellgett, who first made the observation as part of his PhD. When measuring a signal whose noise is dominated by detector noise, a multiplexed measurement such as the signal generated by a Fourier transform spectrometer can produce a relative improvement in SNR, compared to an equivalent scanning monochromator, of the order of the square root of m, where m is the number of sample points comprising the spectrum.
Optical heterodyne detection is a method of extracting information encoded as modulation of the phase, frequency or both of electromagnetic radiation in the wavelength band of visible or infrared light. The light signal is compared with standard or reference light from a "local oscillator" (LO) that would have a fixed offset in frequency and phase from the signal if the latter carried null information. "Heterodyne" signifies more than one frequency, in contrast to the single frequency employed in homodyne detection.

Fourier-transform infrared spectroscopy (FTIR) is a technique used to obtain an infrared spectrum of absorption or emission of a solid, liquid, or gas. An FTIR spectrometer simultaneously collects high-resolution spectral data over a wide spectral range. This confers a significant advantage over a dispersive spectrometer, which measures intensity over a narrow range of wavelengths at a time.
Angle-resolved low-coherence interferometry (a/LCI) is an emerging biomedical imaging technology which uses the properties of scattered light to measure the average size of cell structures, including cell nuclei. The technology shows promise as a clinical tool for in situ detection of dysplastic, or precancerous tissue.

A white light scanner (WLS) is a device for performing surface height measurements of an object using coherence scanning interferometry (CSI) with spectrally-broadband, "white light" illumination. Different configurations of scanning interferometer may be used to measure macroscopic objects with surface profiles measuring in the centimeter range, to microscopic objects with surface profiles measuring in the micrometer range. For large-scale non-interferometric measurement systems, see structured-light 3D scanner.
Incoherent broad band cavity enhanced absorption spectroscopy (IBBCEAS), sometimes called broadband cavity enhanced extinction spectroscopy (IBBCEES), measures the transmission of light intensity through a stable optical cavity consisting of high reflectance mirrors (typically R>99.9%). The technique is realized using incoherent sources of radiation e.g. Xenon arc lamps, LEDs or supercontinuum (SC) lasers, hence the name.
The operation of a photon scanning tunneling microscope (PSTM) is analogous to the operation of an electron scanning tunneling microscope, with the primary distinction being that PSTM involves tunneling of photons instead of electrons from the sample surface to the probe tip. A beam of light is focused on a prism at an angle greater than the critical angle of the refractive medium in order to induce total internal reflection within the prism. Although the beam of light is not propagated through the surface of the refractive prism under total internal reflection, an evanescent field of light is still present at the surface.
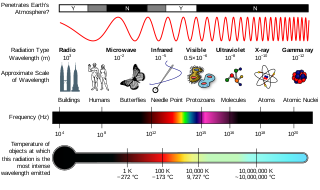
In the physical sciences, the term spectrum was introduced first into optics by Isaac Newton in the 17th century, referring to the range of colors observed when white light was dispersed through a prism. Soon the term referred to a plot of light intensity or power as a function of frequency or wavelength, also known as a spectral density plot.

Anisotropic terahertz microspectroscopy (ATM) is a spectroscopic technique in which molecular vibrations in an anisotropic material are probed with short pulses of terahertz radiation whose electric field is linearly polarized parallel to the surface of the material. The technique has been demonstrated in studies involving single crystal sucrose, fructose, oxalic acid, and molecular protein crystals in which the spatial orientation of molecular vibrations are of interest.