Parts of this article (those related to charts) need to be updated. Please help update this article to reflect recent events or newly available information.(May 2021)
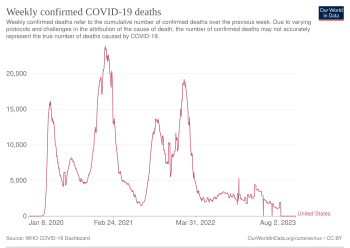
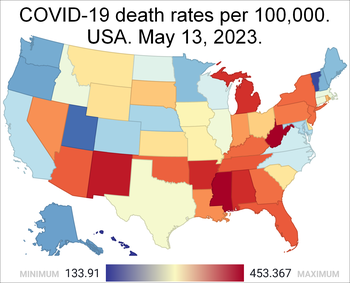
Weekly confirmed COVID-19 deathsMap of cumulative COVID-19 death rates by US state.
The CDC publishes official numbers of COVID-19 cases in the United States. The CDC estimates that, between February 2020 and September 2021, only 1 in 1.3 COVID-19 deaths were attributed to COVID-19.[2] The true COVID-19 death toll in the United States would therefore be higher than official reports, as modeled by a paper published in The Lancet Regional Health – Americas.[3] One way to estimate COVID-19 deaths that includes unconfirmed cases is to use the excess mortality, which is the overall number of deaths that exceed what would normally be expected.[4] From March 1, 2020, through the end of 2020, there were 522,368 excess deaths in the United States, or 22.9% more deaths than would have been expected in that time period.[5]
In February 2020, at the beginning of the pandemic, a shortage of tests made it impossible to confirm all possible COVID-19 cases[6] and resulting deaths, so the early numbers were likely undercounts.[7][8][9][10]
The following numbers are based on CDC data, which is incomplete.
Measuring case and mortality rates
Deceased persons in a 53-foot "mobile morgue" outside a hospital in Hackensack, New Jersey on April 27, 2020
Updated:January 15, 2024 · History of cases: United States
↑ Nationality and location of original infection may vary.
↑ Reported confirmed and probable cases. Actual case numbers are probably higher. Currently, 35 jurisdictions regularly update this metric
↑ Currently 36 jurisdictions regularly update this metric
↑ "–" denotes that no data or only partial data currently available for that state, not that the value is zero.
↑ Cumulative hospitalizations from positive cases reported from the state or the primary source. If a state only reports total cases from suspect COVID-19 cases, then cumulative hospitalizations from suspect cases are used. Data may be partial.
1 2 3 4 5 6 7 8 9 10 11 12 No longer reported explicitly: maintains weekly update on the metric and it remains possible to calculate the cumulative, but due to either the lack of data for a long period of time or the change in reporting methods, such calculated count becomes arbitrary. Hence, the data recorded in the chart is no longer updated
↑ Case and death figures in this chart for Florida include residents and non-residents.
↑ This figure is an estimate from the Texas Department of State Health Services.
In early 2020, deaths from all causes exceeded the seasonal average,[79] and data from early 2020 suggest additional deaths that were not counted in official reported coronavirus mortality statistics.[80] Until February 28, 2020, CDC testing protocols allowed tests only for people who had traveled to China.[81] In most U.S. locations, testing for some time was performed only on symptomatic people with a history of travel to Wuhan or with close contact to such people.[82][83][84] The numbers were reported every Monday, Wednesday, and Friday and were split into categories: individual travelers, people who contracted the disease from other people within the U.S., and repatriated citizens who returned to the U.S. from crisis locations, such as Wuhan, where the disease originated, and the cruise ship Diamond Princess.[85]
By March 26, 2020, the United States, with the world's third-largest population, surpassed China and Italy as the country with the world's highest number of confirmed cases.[86] By April 25, the U.S. had more than 905,000 confirmed coronavirus cases and nearly 52,000 deaths, giving it a mortality rate around 5.7 percent. (In comparison, Spain's mortality rate was 10.2 percent and Italy's was 13.5 percent.)[87][88]
In April 2020, more than 10,000 American deaths had occurred in nursing homes. Most nursing homes did not have easy access to testing, making the actual number unknown.[89] President Trump established a Coronavirus Commission for Safety and Quality in Nursing Homes.[90][91] Subsequently, a number of states including Maryland[92] and New Jersey[93] reported their own estimates of deaths at nursing homes, ranging from twenty to fifty percent of the states' total deaths. A PNAS report in September 2020 confirmed that the virus is much more dangerous for the elderly than the young, noting that about 70% of all U.S. COVID-19 deaths had occurred to those over the age of 70.[94]
As of early August 2020, among the 45 countries that had over 50,000 cases, the U.S. had the eighth highest number of deaths per-capita. Its case fatality ratio, however, was significantly better where it ranked 24th in the world, with 3.3% of its cases resulting in death.[95] Several studies suggested that the number of infections was far higher than officially reported, and thus that the infection fatality rate was far lower than the case fatality rate.[96][97]
The CDC estimates that 40% of people infected never show symptoms (i.e. are asymptomatic),[98] although there is a 75% chance they can still spread the disease. And while children have a lower risk of becoming ill or dying, the CDC warns that they can still function as asymptomatic carriers and transmit the virus to adults.[98] The American Academy of Pediatrics's weekly report[99] from when states started reporting to September 17, 2020, tracked 587,948 child COVID-19 cases, 5,016 child hospitalizations, and 109 child deaths.[100]
Epidemiologists depend on accurate reporting of cases and deaths to advise government response,[101] and some have questioned the reliability of the numbers of confirmed cases.[102] Rates differ among U.S. states, and there are also racial and economic disparities.[103][104][105] After a group of epidemiologists requested revisions in how the CDC counts cases and deaths, the CDC in mid-April 2020 updated its guidance for counting COVID-19 cases and deaths to recommend that U.S. states report both confirmed and probable ones, though the decision is left to each state.[106]
On September 25, 2020, The Lancet published the largest study at the time to measure COVID-19 antibody levels in the US population, finding that less than ten percent of the U.S. population had been exposed.[107][108][109] The study was published at a time when, according to Newsweek, "some U.S. officials have floated the concept of herd immunity as a possible strategy to manage the national outbreak,"[110] and according to the lead author of the study, Stanford Center for Tubulointerstitial Kidney Disease director Shuchi Anand, "this study does not support that there is herd immunity."[111] The research also uncovered racial and economic disparities in populations with COVID-19 antibodies[112][103] and highlighted the need for public health intervention to address the disparities.[104][105] At the time of the publication of the study, Anand announced that researchers would monitor the study participants for months to help determine the effectiveness of COVID-19 mitigation tactics.[110][112][108]
According to the Center for Systems Science and Engineering (CSSE) at Johns Hopkins University as of 19:21 Eastern Standard Time (EST) on 7 August 2021, the total COVID-19 cases in the US has crossed the 35.73 million mark, with the death toll reaching 616,712.[114]
Graphs are unavailable due to technical issues. There is more info on Phabricator and on MediaWiki.org.
Deaths per day
Number of new daily deaths attributed to COVID-19, with a 21-day centered moving average:[115]
Graphs are unavailable due to technical issues. There is more info on Phabricator and on MediaWiki.org.
Weekly all-cause deaths
Weekly predicted deaths, non-COVID excess, and COVID-related excess deaths in the U.S. based on CDC data as of April10,2023[update] which is "Predicted (weighted)" (rather than tabulated) and commonly takes 60 days to fully collate.[116] As such, the data are split and the fields indicated by (*) are not confirmed, including both the 60-day window and any data from the CDC that had numerical inconsistencies (e.g. predicted + excess ≠ observed.) Also, key actions and milestones in the progression of the outbreak are annotated, selectively drawn from COVID-19 pandemic in the United States: Timeline.
Graphs are unavailable due to technical issues. There is more info on Phabricator and on MediaWiki.org.
Hospitalizations
Daily hospital and ICU occupancy numbers, as of January3,2023[update]:[117]
Graphs are unavailable due to technical issues. There is more info on Phabricator and on MediaWiki.org.
Deaths by age
Number of COVID-19 deaths by age as of April 11, 2023:[118][119]
Graphs are unavailable due to technical issues. There is more info on Phabricator and on MediaWiki.org.
Provisional COVID-19 deaths in the United States by age as of April 11, 2023
Age group
Death count
% of deaths
All ages
1,125,044
100%
Under 1y
471
<0.1%
1-4y
258
<0.1%
5-14y
479
<0.1%
15-24y
2,970
0.3%
25-34y
12,210
1%
35-44y
29,787
3%
45-54y
70,753
7%
55-64y
157,966
15%
65-74y
252,945
23%
75-84y
293,622
26%
85y and over
303,583
26%
Deaths by sex
Number of COVID-19 deaths by sex and age as of April 12, 2023:[120]
Graphs are unavailable due to technical issues. There is more info on Phabricator and on MediaWiki.org.
Graphs are unavailable due to technical issues. There is more info on Phabricator and on MediaWiki.org.
Deaths by state
COVID-19 deaths per million of the populations of each state, along with the District of Columbia and Puerto Rico,[121] as of February 9, 2023:
Graphs are unavailable due to technical issues. There is more info on Phabricator and on MediaWiki.org.
When the data was adjusted to take into account age and co-morbidities, Arizona had the highest rate of Covid-related deaths in the country (581 deaths per 100,000 people). Washington, D.C. (526 per 100,000) and New Mexico (521 per 100,000) were the second and third worst states. Hawaii, on the other hand, had the lowest adjusted Covid death rate at 147 deaths per 100,000 people. It was followed by New Hampshire (215 per 100,000) and Maine (281 per 100,000).[122]
Data for all state charts sourced from the NY Times COVID Data, as of January3,2023[update].[115] (This reference tends to include confirmed and suspected cases. This leads to some disparity with other sources).
> 6,000,000 positive test individuals
Graphs are unavailable due to technical issues. There is more info on Phabricator and on MediaWiki.org.
2,000,000–6,000,000 positive test individuals
Graphs are unavailable due to technical issues. There is more info on Phabricator and on MediaWiki.org.
1,000,000–2,000,000 positive test individuals
Graphs are unavailable due to technical issues. There is more info on Phabricator and on MediaWiki.org.
400,000–1,000,000 positive test individuals
Graphs are unavailable due to technical issues. There is more info on Phabricator and on MediaWiki.org.
<400,000 positive test individuals
Graphs are unavailable due to technical issues. There is more info on Phabricator and on MediaWiki.org.
Death projections
On March 31, 2020, the CDC projected that eventually 100,000–240,000 Americans would die of coronavirus.[123] The lower end of the estimate was reached within two months after the CDC made its projection,[124] and the upper end was surpassed in November 2020.[125] It is hard to say if the projections were accurate as some of the time they were, while others were very much off, however it was hard to predict the amount of deaths when new variants like the Omicron variant and the Delta variant were rising.
The CDC uses an ensemble forecast, meaning it receives predictions from multiple sources and aggregates them to make its own forecast. As of December 2020, the CDC included 37 modeling groups in its ensemble forecast and was predicting the death toll 4 weeks in advance.[126]
Examples:
At the end of May 2020, the CDC correctly projected the death toll would surpass 115,000 by June 20.[127][128]
At the end of July 2020, the CDC correctly projected the death toll would surpass 168,000 by August 22.[129]
In mid-October 2020, the CDC correctly projected the death toll would reach 230,000–250,000 by mid-November.[129]
In mid-February 2021, when the death toll had already reached 470,000,[130] the IHME projected that the death toll would reach 600,000 by June 1.[131] However, the death rate dropped during this time period and the total death toll on June 1 was not as high as expected, having reached only about 592,000.[132] The total of 600,000 was reached two weeks later.[133]
In mid-September 2021, when the death toll had already reached 670,000, the IHME projected that the death toll would reach 775,000 by the end of the year.[134] That number was reached by the end of November 2021.[135]
On January 12, 2022, when the death toll had already reached 842,000, a CDC ensemble forecast predicted that 62,000 people would die over the next four weeks.[136]
At the start of January 2023, when the US death toll had accumulated to over 1,120,000, the IHME projected that the death toll would reach 1,130,000 by April 1.[137]
Comparisons
Epidemics of similar size (the number is the U.S. death toll):
The Centers for Disease Control and Prevention (CDC) is the national public health agency of the United States. It is a United States federal agency under the Department of Health and Human Services, and is headquartered in Atlanta, Georgia.
This is a general overview and status of places affected by severe acute respiratory syndrome coronavirus 2 (SARS-CoV-2), the virus which causes coronavirus disease 2019 (COVID-19) and is responsible for the COVID-19 pandemic. The first human cases of COVID-19 were identified in Wuhan, the capital of the province of Hubei in China in December 2019.
Coronavirus disease 2019 (COVID-19) is a contagious disease caused by the virus SARS-CoV-2. The first known case was identified in Wuhan, China, in December 2019. The disease quickly spread worldwide, resulting in the COVID-19 pandemic.
In the United States, the worldwide pandemic of coronavirus disease 2019 (COVID-19) caused by severe acute respiratory syndrome coronavirus 2 (SARS-CoV-2) has resulted in 103,436,829 confirmed cases with 1,170,784 all-time deaths, the most of any country, and the 20th-highest per capita worldwide. The COVID-19 pandemic ranks first on the list of disasters in the United States by death toll; it was the third-leading cause of death in the U.S. in 2020, behind heart disease and cancer. From 2019 to 2020, U.S. life expectancy dropped by 3years for Hispanic and Latino Americans, 2.9years for African Americans, and 1.2years for white Americans. These effects persisted as U.S. deaths due to COVID-19 in 2021 exceeded those in 2020, and life expectancy continued to fall from 2020 to 2021.
The first cases of the COVID-19 pandemic of coronavirus disease 2019 in North America were reported in the United States on 23 January 2020. Cases were reported in all North American countries after Saint Kitts and Nevis confirmed a case on 25 March, and in all North American territories after Bonaire confirmed a case on 16 April.
The COVID-19 pandemic in Cameroon was a part of the worldwide pandemic of coronavirus disease 2019 caused by severe acute respiratory syndrome coronavirus 2. The virus was confirmed to have reached Cameroon on 6 March 2020.
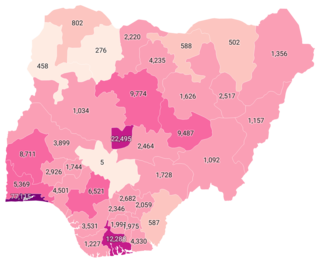
The COVID-19 pandemic in Nigeria was a part of the worldwide pandemic of coronavirus disease 2019 caused by severe acute respiratory syndrome coronavirus 2. The first confirmed case in Nigeria was announced on 27 February 2020, when an Italian national in Lagos tested positive for the virus. On 9 March 2020, a second case of the virus was reported in Ewekoro, Ogun State, a Nigerian citizen who came into contact with the Italian national.
The COVID-19 pandemic in Ivory Coast was a part of the worldwide pandemic of coronavirus disease 2019 caused by severe acute respiratory syndrome coronavirus 2. The virus was confirmed to have reached Ivory Coast in March 2020.
The COVID-19 pandemic in Burkina Faso was a part of the ongoing worldwide pandemic of coronavirus disease 2019 caused by severe acute respiratory syndrome coronavirus 2. The virus was confirmed to have reached Burkina Faso on 9 March 2020. The death of Rose Marie Compaoré, a member of the National Assembly of Burkina Faso, on 18 March marked the first recorded fatality due to COVID-19 in Sub-Saharan Africa.
The COVID-19 pandemic in Sudan was a part of the worldwide pandemic of coronavirus disease 2019 caused by severe acute respiratory syndrome coronavirus 2. The virus was confirmed to have reached Sudan in March 2020.
The COVID-19 pandemic in Djibouti was a part of the worldwide pandemic of coronavirus disease 2019 caused by severe acute respiratory syndrome coronavirus 2. The virus spread to Djibouti in March 2020. It is a novel infectious disease caused by severe acute respiratory syndrome coronavirus 2. Model-based simulations for Djibouti indicate that the 95% confidence interval for the time-varying reproduction number R t has been rising since August 2020 and exceeded 1.0 until April 2021.
The COVID-19 pandemic in Madagascar is part of the ongoing worldwide pandemic of coronavirus disease 2019 caused by severe acute respiratory syndrome coronavirus 2. On 20 March 2020, the first case in Madagascar was confirmed in Antananarivo.
The COVID-19 pandemic in Benin was a part of the ongoing worldwide pandemic of coronavirus disease 2019 caused by severe acute respiratory syndrome coronavirus 2. The virus was confirmed to have reached Benin in March 2020.
The COVID-19 pandemic in Cape Verde is part of the worldwide pandemic of coronavirus disease 2019 caused by severe acute respiratory syndrome coronavirus 2. The virus was confirmed to have reached Cape Verde in March 2020.
The COVID-19 pandemic in The Gambia was a part of the worldwide pandemic of coronavirus disease 2019 caused by severe acute respiratory syndrome coronavirus 2. The virus was confirmed to have reached The Gambia in March 2020.
The COVID-19 pandemic in Tanzania was a part of the ongoing worldwide pandemic of coronavirus disease 2019 caused by severe acute respiratory syndrome coronavirus 2. The COVID-19 pandemic was confirmed to have reached Tanzania in March 2020.
The COVID-19 pandemic in São Tomé and Príncipe is part of the worldwide pandemic of coronavirus disease 2019 caused by severe acute respiratory syndrome coronavirus 2. The virus was confirmed to have reached São Tomé and Príncipe on 6 April 2020. The first death was recorded on 30 April.
The COVID-19 pandemic in Tuvalu is part of the ongoing worldwide pandemic of coronavirus disease 2019 caused by severe acute respiratory syndrome coronavirus 2. The virus was confirmed to have reached Tuvalu on 20 May 2022. As of 31 August 2022, a total of 25,591 vaccine doses have been administered.
The COVID-19 pandemic in the Republic of the Congo was a part of the worldwide pandemic of coronavirus disease 2019 caused by severe acute respiratory syndrome coronavirus 2. The virus was confirmed to have reached the Republic of the Congo in March 2020.
COVID-19 surveillance involves monitoring the spread of the coronavirus disease in order to establish the patterns of disease progression. The World Health Organization (WHO) recommends active surveillance, with focus of case finding, testing and contact tracing in all transmission scenarios. COVID-19 surveillance is expected to monitor epidemiological trends, rapidly detect new cases, and based on this information, provide epidemiological information to conduct risk assessment and guide disease preparedness.
References
↑ COVID-19 Deaths per 100K. U.S. News & World Report. Run your cursor over the map to see the dates and data for each state. "The data on this page is courtesy of USAFacts – a nonprofit, nonpartisan civic initiative – and includes information from the Centers for Disease Control and Prevention and state and local health departments. See a detailed methodology at the USAFacts website."
Roberts, Jeff J. (April 3, 2020). "Can the private sector provide better coronavirus data? Experts are skeptical". Fortune. Retrieved April 10, 2020. Confirmed coronavirus cases in the U.S. crossed 200,000 on Thursday, but experts agree the actual number of infected people is much higher. The lack of reliable data—a persistent problem since the pandemic began—has made it impossible to determine the actual size of the outbreak, hampering the U.S. response.
↑ "Coronavirus Disease (COVID-19)". Delaware Division of Public Health, State of Delaware's Latest Status. November 15, 2023. Retrieved November 20, 2023.
↑ "COVID-19: Maine Data". Maine Center for Disease Control & Prevention: Division of Disease Surveillance. December 24, 2020. Retrieved November 26, 2023.
↑ "Monotoring COVID-19 in Nevada". State of Nevada Department of Health and Human Services: Office of Analytics. December 24, 2020. Retrieved November 23, 2023.
This page is based on this Wikipedia article Text is available under the CC BY-SA 4.0 license; additional terms may apply. Images, videos and audio are available under their respective licenses.