
In statistics, cluster sampling is a sampling plan used when mutually homogeneous yet internally heterogeneous groupings are evident in a statistical population. It is often used in marketing research.
In statistics, sampling bias is a bias in which a sample is collected in such a way that some members of the intended population have a lower or higher sampling probability than others. It results in a biased sample of a population in which all individuals, or instances, were not equally likely to have been selected. If this is not accounted for, results can be erroneously attributed to the phenomenon under study rather than to the method of sampling.
Observational error is the difference between a measured value of a quantity and its true value. In statistics, an error is not necessarily a "mistake". Variability is an inherent part of the results of measurements and of the measurement process.

Statistics is the discipline that concerns the collection, organization, analysis, interpretation, and presentation of data. In applying statistics to a scientific, industrial, or social problem, it is conventional to begin with a statistical population or a statistical model to be studied. Populations can be diverse groups of people or objects such as "all people living in a country" or "every atom composing a crystal". Statistics deals with every aspect of data, including the planning of data collection in terms of the design of surveys and experiments.
In statistics, survey sampling describes the process of selecting a sample of elements from a target population to conduct a survey. The term "survey" may refer to many different types or techniques of observation. In survey sampling it most often involves a questionnaire used to measure the characteristics and/or attitudes of people. Different ways of contacting members of a sample once they have been selected is the subject of survey data collection. The purpose of sampling is to reduce the cost and/or the amount of work that it would take to survey the entire target population. A survey that measures the entire target population is called a census. A sample refers to a group or section of a population from which information is to be obtained

In statistics, stratified sampling is a method of sampling from a population which can be partitioned into subpopulations.
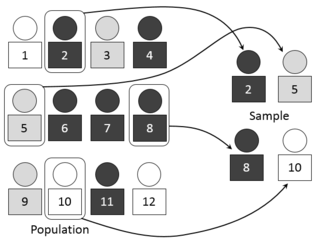
In statistics, quality assurance, and survey methodology, sampling is the selection of a subset of individuals from within a statistical population to estimate characteristics of the whole population. Statisticians attempt to collect samples that are representative of the population in question. Sampling has lower costs and faster data collection than measuring the entire population and can provide insights in cases where it is infeasible to measure an entire population.
Statistical bias is a systematic tendency which causes differences between results and facts. The bias exists in numbers of the process of data analysis, including the source of the data, the estimator chosen, and the ways the data was analyzed. Bias may have a serious impact on results, for example, to investigate people's buying habits. If the sample size is not large enough, the results may not be representative of the buying habits of all the people. That is, there may be discrepancies between the survey results and reality. Therefore, understanding the source of statistical bias can help to assess whether the observed results are close to actuality.
Questionnaire construction refers to the design of a questionnaire to gather statistically useful information about a given topic. When properly constructed and responsibly administered, questionnaires can provide valuable data about any given subject.
Survey methodology is "the study of survey methods". As a field of applied statistics concentrating on human-research surveys, survey methodology studies the sampling of individual units from a population and associated techniques of survey data collection, such as questionnaire construction and methods for improving the number and accuracy of responses to surveys. Survey methodology targets instruments or procedures that ask one or more questions that may or may not be answered.
In statistics, a sampling frame is the source material or device from which a sample is drawn. It is a list of all those within a population who can be sampled, and may include individuals, households or institutions.
In statistics, missing data, or missing values, occur when no data value is stored for the variable in an observation. Missing data are a common occurrence and can have a significant effect on the conclusions that can be drawn from the data.
Participation bias or non-response bias is a phenomenon in which the results of elections, studies, polls, etc. become non-representative because the participants disproportionately possess certain traits which affect the outcome. These traits mean the sample is systematically different from the target population, potentially resulting in biased estimates.
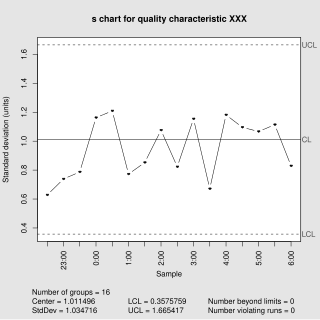
In statistical quality control, the and s chart is a type of control chart used to monitor variables data when samples are collected at regular intervals from a business or industrial process. This is connected to traditional statistical quality control (SQC) and statistical process control (SPC). However, Woodall noted that "I believe that the use of control charts and other monitoring methods should be referred to as “statistical process monitoring,” not “statistical process control (SPC).”"
Administrative error is an error resulting from improper administration or execution of a survey. Such errors can be caused by carelessness, confusion, neglect, omission or another blunder.
In statistics, non-sampling error is a catch-all term for the deviations of estimates from their true values that are not a function of the sample chosen, including various systematic errors and random errors that are not due to sampling. Non-sampling errors are much harder to quantify than sampling errors.
Coverage error is a type of non-sampling error that occurs when there is not a one-to-one correspondence between the target population and the sampling frame from which a sample is drawn. This can bias estimates calculated using survey data. For example, a researcher may wish to study the opinions of registered voters by calling residences listed in a telephone directory. Undercoverage may occur if not all voters are listed in the phone directory. Overcoverage could occur if some voters have more than one listed phone number. Bias could also occur if some phone numbers listed in the directory do not belong to registered voters. In this example, undercoverage, overcoverage, and bias due to inclusion of unregistered voters in the sampling frame are examples of coverage error.
With the application of probability sampling in the 1930s, surveys became a standard tool for empirical research in social sciences, marketing, and official statistics. The methods involved in survey data collection are any of a number of ways in which data can be collected for a statistical survey. These are methods that are used to collect information from a sample of individuals in a systematic way. First there was the change from traditional paper-and-pencil interviewing (PAPI) to computer-assisted interviewing (CAI). Now, face-to-face surveys (CAPI), telephone surveys (CATI), and mail surveys are increasingly replaced by web surveys.
Judith T. Lessler is an American statistician and expert on survey methodology, particularly on surveys relating to health and epidemiology.