In machine learning, a common task is the study and construction of algorithms that can learn from and make predictions on data.[1] Such algorithms function by making data-driven predictions or decisions,[2] through building a mathematical model from input data. These input data used to build the model are usually divided into multiple data sets. In particular, three data sets are commonly used in different stages of the creation of the model: training, validation, and testing sets.
The model is initially fit on a training data set,[3] which is a set of examples used to fit the parameters (e.g. weights of connections between neurons in artificial neural networks) of the model.[4] The model (e.g. a naive Bayes classifier) is trained on the training data set using a supervised learning method, for example using optimization methods such as gradient descent or stochastic gradient descent. In practice, the training data set often consists of pairs of an input vector (or scalar) and the corresponding output vector (or scalar), where the answer key is commonly denoted as the target (or label). The current model is run with the training data set and produces a result, which is then compared with the target, for each input vector in the training data set. Based on the result of the comparison and the specific learning algorithm being used, the parameters of the model are adjusted. The model fitting can include both variable selection and parameter estimation.
Successively, the fitted model is used to predict the responses for the observations in a second data set called the validation data set.[3] The validation data set provides an unbiased evaluation of a model fit on the training data set while tuning the model's hyperparameters[5] (e.g. the number of hidden units—layers and layer widths—in a neural network[4]). Validation data sets can be used for regularization by early stopping (stopping training when the error on the validation data set increases, as this is a sign of over-fitting to the training data set).[6] This simple procedure is complicated in practice by the fact that the validation data set's error may fluctuate during training, producing multiple local minima. This complication has led to the creation of many ad-hoc rules for deciding when over-fitting has truly begun.[6]
Finally, the test data set is a data set used to provide an unbiased evaluation of a final model fit on the training data set.[5] If the data in the test data set has never been used in training (for example in cross-validation), the test data set is also called a holdout data set. The term "validation set" is sometimes used instead of "test set" in some literature (e.g., if the original data set was partitioned into only two subsets, the test set might be referred to as the validation set).[5]
Deciding the sizes and strategies for data set division in training, test and validation sets is very dependent on the problem and data available.[7]
Training data set
Simplified example of training a neural network in object detection: The network is trained by multiple images that are known to depict starfish and sea urchins, which are correlated with "nodes" that represent visual features. The starfish match with a ringed texture and a star outline, whereas most sea urchins match with a striped texture and oval shape. However, the instance of a ring textured sea urchin creates a weakly weighted association between them.
Subsequent run of the network on an input image (left):[8] The network correctly detects the starfish. However, the weakly weighted association between ringed texture and sea urchin also confers a weak signal to the latter from one of two intermediate nodes. In addition, a shell that was not included in the training gives a weak signal for the oval shape, also resulting in a weak signal for the sea urchin output. These weak signals may result in a false positive result for sea urchin. In reality, textures and outlines would not be represented by single nodes, but rather by associated weight patterns of multiple nodes.
A training data set is a data set of examples used during the learning process and is used to fit the parameters (e.g., weights) of, for example, a classifier.[9][10]
For classification tasks, a supervised learning algorithm looks at the training data set to determine, or learn, the optimal combinations of variables that will generate a good predictive model.[11] The goal is to produce a trained (fitted) model that generalizes well to new, unknown data.[12] The fitted model is evaluated using “new” examples from the held-out data sets (validation and test data sets) to estimate the model’s accuracy in classifying new data.[5] To reduce the risk of issues such as over-fitting, the examples in the validation and test data sets should not be used to train the model.[5]
Most approaches that search through training data for empirical relationships tend to overfit the data, meaning that they can identify and exploit apparent relationships in the training data that do not hold in general.
When a training set is continuously expanded with new data, then this is incremental learning.
Validation data set
A validation data set is a data set of examples used to tune the hyperparameters (i.e. the architecture) of a model. It is sometimes also called the development set or the "dev set".[13] An example of a hyperparameter for artificial neural networks includes the number of hidden units in each layer.[9][10] It, as well as the testing set (as mentioned below), should follow the same probability distribution as the training data set.
In order to avoid overfitting, when any classification parameter needs to be adjusted, it is necessary to have a validation data set in addition to the training and test data sets. For example, if the most suitable classifier for the problem is sought, the training data set is used to train the different candidate classifiers, the validation data set is used to compare their performances and decide which one to take and, finally, the test data set is used to obtain the performance characteristics such as accuracy, sensitivity, specificity, F-measure, and so on. The validation data set functions as a hybrid: it is training data used for testing, but neither as part of the low-level training nor as part of the final testing.
The basic process of using a validation data set for model selection (as part of training data set, validation data set, and test data set) is:[10][14]
Since our goal is to find the network having the best performance on new data, the simplest approach to the comparison of different networks is to evaluate the error function using data which is independent of that used for training. Various networks are trained by minimization of an appropriate error function defined with respect to a training data set. The performance of the networks is then compared by evaluating the error function using an independent validation set, and the network having the smallest error with respect to the validation set is selected. This approach is called the hold out method. Since this procedure can itself lead to some overfitting to the validation set, the performance of the selected network should be confirmed by measuring its performance on a third independent set of data called a test set.
An application of this process is in early stopping, where the candidate models are successive iterations of the same network, and training stops when the error on the validation set grows, choosing the previous model (the one with minimum error).
Test data set
A test data set is a data set that is independent of the training data set, but that follows the same probability distribution as the training data set. If a model fit to the training data set also fits the test data set well, minimal overfitting has taken place (see figure below). A better fitting of the training data set as opposed to the test data set usually points to over-fitting.
A test set is therefore a set of examples used only to assess the performance (i.e. generalization) of a fully specified classifier.[9][10] To do this, the final model is used to predict classifications of examples in the test set. Those predictions are compared to the examples' true classifications to assess the model's accuracy.[11]
In a scenario where both validation and test data sets are used, the test data set is typically used to assess the final model that is selected during the validation process. In the case where the original data set is partitioned into two subsets (training and test data sets), the test data set might assess the model only once (e.g., in the holdout method).[15] Note that some sources advise against such a method.[12] However, when using a method such as cross-validation, two partitions can be sufficient and effective since results are averaged after repeated rounds of model training and testing to help reduce bias and variability.[5][12]
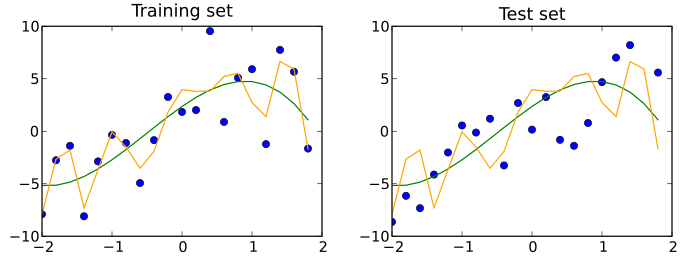
A training set (left) and a test set (right) from the same statistical population are shown as blue points. Two predictive models are fit to the training data. Both fitted models are plotted with both the training and test sets. In the training set, the MSE of the fit shown in orange is 4 whereas the MSE for the fit shown in green is 9. In the test set, the MSE for the fit shown in orange is 15 and the MSE for the fit shown in green is 13. The orange curve severely overfits the training data, since its MSE increases by almost a factor of four when comparing the test set to the training set. The green curve overfits the training data much less, as its MSE increases by less than a factor of 2.
Confusion in terminology
Testing is trying something to find out about it ("To put to the proof; to prove the truth, genuineness, or quality of by experiment" according to the Collaborative International Dictionary of English) and to validate is to prove that something is valid ("To confirm; to render valid" Collaborative International Dictionary of English). With this perspective, the most common use of the terms test set and validation set is the one here described. However, in both industry and academia, they are sometimes used interchanged, by considering that the internal process is testing different models to improve (test set as a development set) and the final model is the one that needs to be validated before real use with an unseen data (validation set). "The literature on machine learning often reverses the meaning of 'validation' and 'test' sets. This is the most blatant example of the terminological confusion that pervades artificial intelligence research."[16] Nevertheless, the important concept that must be kept is that the final set, whether called test or validation, should only be used in the final experiment.
Cross-validation
In order to get more stable results and use all valuable data for training, a data set can be repeatedly split into several training and a validation data sets. This is known as cross-validation. To confirm the model's performance, an additional test data set held out from cross-validation is normally used.
It is possible to use cross-validation on training and validation sets, and within each training set have further cross-validation for a test set for hyperparameter tuning. This is known as nested cross-validation.
Causes of error
Comic strip demonstrating a fictional erroneous computer output (making a coffee 5 million degrees, from a previous definition of "extra hot"). This can be classified as both a failure in logic and a failure to include various relevant environmental conditions.
Omissions in the training of algorithms are a major cause of erroneous outputs.[17] Types of such omissions include:[17]
Particular circumstances or variations were not included.
Obsolete data
Ambiguous input information
Inability to change to new environments
Inability to request help from a human or another AI system when needed
An example of an omission of particular circumstances is a case where a boy was able to unlock the phone because his mother registered her face under indoor, nighttime lighting, a condition which was not appropriately included in the training of the system.[17][18]
Usage of relatively irrelevant input can include situations where algorithms use the background rather than the object of interest for object detection, such as being trained by pictures of sheep on grasslands, leading to a risk that a different object will be interpreted as a sheep if located on a grassland.[17]
↑ Bishop, Christopher M. (2006). Pattern Recognition and Machine Learning. New York: Springer. p.vii. ISBN0-387-31073-8. Pattern recognition has its origins in engineering, whereas machine learning grew out of computer science. However, these activities can be viewed as two facets of the same field, and together they have undergone substantial development over the past ten years.
This page is based on this Wikipedia article Text is available under the CC BY-SA 4.0 license; additional terms may apply. Images, videos and audio are available under their respective licenses.