Utah's 2nd congressional district

Last updated

Utah's 2nd congressional district
Utah's 2nd congressional district (since 2023).svg
Utah's 2nd congressional district
Interactive map of district boundaries since January 3, 2023
Representative
  Celeste Maloy
RCedar City
Population (2022)849,661
Median household
income
$80,789 [1]
Ethnicity
Cook PVI R+11 [2]

Utah's 2nd congressional district currently serves Salt Lake City and the largely rural western and southern portions of Utah, including Saint George and Tooele. The district is currently represented by Republican Celeste Maloy, who was elected to the seat after she defeated Democrat Kathleen Riebe in the November 21, 2023 special election, caused by the resignation of incumbent Chris Stewart (R) on September 15, 2023. With a Cook Partisan Voting Index rating of R+11, it is the least Republican district in Utah, a state with an all-Republican congressional delegation. [2]

Contents

Recent statewide election results

Results under current lines (since 2023)
YearOfficeResult
2016 President Trump 46.8% - 30.7%
2020 President Trump 56.0% - 39.1%
Results under old lines (2013-2023) [3] [4]
Results under old lines (2003-2013) [5]

List of members representing the district

District borders are periodically redrawn and some district residences may no longer be in the current 2nd district.

Until 1913, Utah only elected from the former at-large district.

MemberPartyYearsCong
ress
Electoral historyLocation
District established March 4, 1913
JacobJohnson.jpg
Jacob Johnson
(Spring City)
Republican March 4, 1913 –
March 3, 1915
63rd Elected in 1912.
Lost party renomination.
James Henry Mays.jpg
James Henry Mays
(Salt Lake City)
Democratic March 4, 1915 –
March 3, 1921
64th
65th
66th
Elected in 1914.
Re-elected in 1916.
Re-elected in 1918.
Retired.
ElmerOLeatherwood.jpg
Elmer O. Leatherwood
(Salt Lake City)
Republican March 4, 1921 –
December 24, 1929
67th
68th
69th
70th
71st
Elected in 1920.
Re-elected in 1922.
Re-elected in 1924.
Re-elected in 1926.
Re-elected in 1928.
Died.
VacantDecember 24, 1929 –
November 4, 1930
71st
Frederick C. Loofboutow (Utah Congressman).jpg
Frederick C. Loofbourow
(Salt Lake City)
Republican November 4, 1930 –
March 3, 1933
71st
72nd
Elected to finish Leatherwood's term.
Elected the same day to the next term.
Lost re-election.
J. Will Robinson (Utah Congressman).jpg
J. W. Robinson
(Provo)
Democratic March 4, 1933 –
January 3, 1947
73rd
74th
75th
76th
77th
78th
79th
Elected in 1932.
Re-elected in 1934.
Re-elected in 1936.
Re-elected in 1938.
Re-elected in 1940.
Re-elected in 1944.
Lost re-election.
William A. Dawson.jpg
William A. Dawson
(Layton)
Republican January 3, 1947 –
January 3, 1949
80th Elected in 1946.
Lost re-election.
Reva Bosone.jpg
Reva Beck Bosone
(Salt Lake City)
Democratic January 3, 1949 –
January 3, 1953
81st
82nd
Elected in 1948.
Re-elected in 1950.
Lost re-election.
William A. Dawson.jpg
William A. Dawson
(Salt Lake City)
Republican January 3, 1953 –
January 3, 1959
83rd
84th
85th
Elected in 1952.
Re-elected in 1954.
Re-elected in 1956.
Lost re-election.
David Sjodahl King circa 1950.jpg
David S. King
(Salt Lake City)
Democratic January 3, 1959 –
January 3, 1963
86th
87th
Elected in 1958.
Re-elected in 1960.
Retired to run for U.S. Senator.
ShermanPLloyd.jpg
Sherman P. Lloyd
(Salt Lake City)
Republican January 3, 1963 –
January 3, 1965
88th Elected in 1962.
Retired to run for U.S. Senator.
David Sjodahl King circa 1950.jpg
David S. King
(Salt Lake City)
Democratic January 3, 1965 –
January 3, 1967
89th Elected in 1964.
Lost re-election.
ShermanPLloyd.jpg
Sherman P. Lloyd
(Salt Lake City)
Republican January 3, 1967 –
January 3, 1973
90th
91st
92nd
Elected in 1966.
Re-elected in 1968.
Re-elected in 1970.
Lost re-election.
Wayne Owens.png
Wayne Owens
(Salt Lake City)
Democratic January 3, 1973 –
January 3, 1975
93rd Elected in 1972.
Retired to run for U.S. Senator.
Allan Turner Howe.png
Allan Turner Howe
(Salt Lake City)
Democratic January 3, 1975 –
January 3, 1977
94th Elected in 1974.
Lost re-election.
David Daniel Marriott.jpg
David Daniel Marriott
(Salt Lake City)
Republican January 3, 1977 –
January 3, 1985
95th
96th
97th
98th
Elected in 1976.
Re-elected in 1978.
Re-elected in 1980.
Re-elected in 1982.
Retired to run for Governor of Utah.
David Smith Monson.jpg
David Smith Monson
(Salt Lake City)
Republican January 3, 1985 –
January 3, 1987
99th Elected in 1984.
Retired.
Wayne Owens 100th Congress 1987.jpg
Wayne Owens
(Salt Lake City)
Democratic January 3, 1987 –
January 3, 1993
100th
101st
102nd
Re-elected in 1986.
Re-elected in 1988.
Re-elected in 1990.
Retired to run for U.S. Senator.
Karenshepherd.jpg
Karen Shepherd
(Salt Lake City)
Democratic January 3, 1993 –
January 3, 1995
103rd Elected in 1992.
Lost re-election.
1993–2003:
[ data missing ]
Enid G. Mickelsen.jpg
Enid Greene
(Salt Lake City)
Republican January 3, 1995 –
January 3, 1997
104th Elected in 1994.
Retired.
Merrillcook.jpg
Merrill Cook
(Salt Lake City)
Republican January 3, 1997 –
January 3, 2001
105th
106th
Elected in 1996.
Re-elected in 1998.
Lost renomination.
Mathesonbio.jpg
Jim Matheson
(Salt Lake City)
Democratic January 3, 2001 –
January 3, 2013
107th
108th
109th
110th
111th
112th
Elected in 2000.
Re-elected in 2002.
Re-elected in 2004.
Re-elected in 2006.
Re-elected in 2008.
Re-elected in 2010.
Redistricted to the 4th district .
2003–2013:
Utah's 2nd congressional district.gif
Chris Stewart, official portrait, 113th Congress.jpg
Chris Stewart
(Farmington)
Republican January 3, 2013 –
September 15, 2023
113th
114th
115th
116th
117th
118th
Elected in 2012.
Re-elected in 2014.
Re-elected in 2016.
Re-elected in 2018.
Re-elected in 2020.
Re-elected in 2022.
Resigned.
2013–2023:
Utah US Congressional District 2 (since 2013).tif
2023–present:
Utah's 2nd congressional district with inset (since 2023).svg
VacantSeptember 15, 2023 –
November 28, 2023
118th
Celeste Maloy 118th Congress.jpeg
Celeste Maloy
(Cedar City)
Republican November 28, 2023 – present
118th Elected to finish Stewart's term.

Election results

1912

Note: The 1912 election consisted of an all-party election to the two at-large seats. Howell was elected to the first at-large seat, while Johnson was elected to the second at-large seat.

1912 United States House of Representatives elections [6]
PartyCandidateVotes%
Republican Joseph Howell 43,133 19.45
Republican Jacob Johnson 42,047 18.96
Democratic Mathonihah Thomas37,19216.77
Democratic Tollman D. Johnson36,64016.52
Progressive S.H. Love22,35810.08
Progressive Lewis Larson21,9349.89
Socialist Murray E. King8,9714.05
Socialist William M. Knerr8,9534.04
Socialist Labor Elias Anderson5050.23
Total votes221,733 100.0
Republican win (new seat)

1914

1914 United States House of Representatives elections [7]
PartyCandidateVotes%
Democratic James Henry Mays 25,617 47.49
Republican Elmer O. Leatherwood 25,45947.20
Socialist A.H. Kempton2,8615.31
Total votes53,937 100.0
Democratic gain from Republican

1916

1916 United States House of Representatives elections [8]
PartyCandidateVotes%
Democratic James Henry Mays (Incumbent) 39,847 56.87
Republican Charles R. Mabey 27,77839.65
Socialist Murray E. King2,4403.48
Total votes70,065 100.0
Democratic hold

1918

1918 United States House of Representatives elections [9]
PartyCandidateVotes%
Democratic James Henry Mays (Incumbent) 23,931 58.68
Republican William Spry 16,13439.56
Socialist A.H. Kempton7191.76
Total votes40,784 100.0
Democratic hold

1920

1920 United States House of Representatives elections [10]
PartyCandidateVotes%
Republican Elmer O. Leatherwood 39,239 54.82
Democratic Mathonihah Thomas28,20139.40
Farmer–Labor Marvin P. Bales2,4373.40
Socialist C.T. Stoney1,6962.38
Total votes71,573 100.0
Republican gain from Democratic

1922

1922 United States House of Representatives elections [11]
PartyCandidateVotes%
Republican Elmer O. Leatherwood (Incumbent) 28,591 50.43
Democratic David C. Dunbar26,14546.12
Farmer–Labor E. G. Locke1,9593.45
Total votes56,695 100.0
Republican hold

1924

1924 United States House of Representatives elections [12]
PartyCandidateVotes%
Republican Elmer O. Leatherwood (Incumbent) 41,888 56.66
Democratic James H. Waters32,04543.34
Total votes73,933 100.0
Republican hold

1926

1926 United States House of Representatives elections [13]
PartyCandidateVotes%
Republican Elmer O. Leatherwood (Incumbent) 42,073 60.18
Democratic William R. Wallace Jr.27,00638.63
Socialist Otto E. Parsons8351.19
Total votes69,914 100.0
Republican hold

1928

1928 United States House of Representatives elections [14]
PartyCandidateVotes%
Republican Elmer O. Leatherwood (Incumbent) 46,866 50.22
Democratic Joshua H. Paul46,02549.31
Socialist T. F. Eynon4390.47
Total votes93,330 100.0
Republican hold

1930 (special)

1930 Utah's 2nd congressional district special election [15]
PartyCandidateVotes%
Republican Frederick C. Loofbourow 35,349 44.13
Democratic Joshua H. Paul33,91542.34
Liberty George N. Lawrence10,59113.22
Socialist Otto E. Parsons2530.32
Total votes80,108 100.0
Republican hold

1930

1930 United States House of Representatives elections [16]
PartyCandidateVotes%
Republican Frederick C. Loofbourow 35,106 44.29
Democratic Joshua H. Paul33,61842.41
Liberty George N. Lawrence10,30313.00
Socialist Otto E. Parsons2390.30
Total votes79,266 100.0
Republican hold

1932

1932 United States House of Representatives elections [17]
PartyCandidateVotes%
Democratic J. W. Robinson 62,400 57.08
Republican Frederick C. Loofbourow (Incumbent)46,91942.92
Total votes109,319 100.0
Democratic gain from Republican

1934

1934 United States House of Representatives elections [18]
PartyCandidateVotes%
Democratic J. W. Robinson (Incumbent) 58,175 62.30
Republican Frederick C. Loofbourow 34,00736.42
Communist Carl Bjork7880.84
Socialist A. L. Porter4050.43
Total votes93,375 100.0
Democratic hold

1936

1936 United States House of Representatives elections [19]
PartyCandidateVotes%
Democratic J. W. Robinson (Incumbent) 81,119 69.75
Republican A. V. Watkins34,85529.97
Socialist Joseph L. Hansen 3180.28
Total votes116,292 100.0
Democratic hold

1938

1938 United States House of Representatives elections [20]
PartyCandidateVotes%
Democratic J. W. Robinson (Incumbent) 58,456 62.31
Republican Dean F. Brayton35,35937.69
Total votes93,815 100.0
Democratic hold

1940

1940 United States House of Representatives elections [21]
PartyCandidateVotes%
Democratic J. W. Robinson (Incumbent) 86,874 63.32
Republican A. Sherman Christenson50,33236.68
Total votes137,206 100.0
Democratic hold

1942

1942 United States House of Representatives elections [22]
PartyCandidateVotes%
Democratic J. W. Robinson (Incumbent) 43,582 55.75
Republican Reed E. Vetterli34,58644.25
Total votes78,168 100.0
Democratic hold

1944

1944 United States House of Representatives elections [23]
PartyCandidateVotes%
Democratic J. W. Robinson (Incumbent) 89,844 62.27
Republican Quayle Cannon Jr.54,44037.73
Total votes144,284 100.0
Democratic hold

1946

1946 United States House of Representatives elections [24]
PartyCandidateVotes%
Republican William A. Dawson 56,402 52.71
Democratic J. W. Robinson (Incumbent)50,59847.29
Total votes107,000 100.0
Republican gain from Democratic

1948

1948 United States House of Representatives elections [25]
PartyCandidateVotes%
Democratic Reva Beck Bosone 92,770 57.46
Republican William A. Dawson (Incumbent)68,69342.54
Total votes161,463 100.0
Democratic gain from Republican

1950

1950 United States House of Representatives elections [26]
PartyCandidateVotes%
Democratic Reva Beck Bosone (Incumbent) 84,283 53.40
Republican Ivy Baker Priest 73,53546.60
Total votes157,818 100.0
Democratic hold

1952

1952 United States House of Representatives elections [27]
PartyCandidateVotes%
Republican William A. Dawson 105,296 52.55
Democratic Reva Beck Bosone (Incumbent)95,08447.45
Total votes200,380 100.0
Republican gain from Democratic

1954

1954 United States House of Representatives elections [28]
PartyCandidateVotes%
Republican William A. Dawson (Incumbent) 90,864 57.16
Democratic Reva Beck Bosone 68,09042.84
Total votes158,954 100.0
Republican hold

1956

1956 United States House of Representatives elections [29]
PartyCandidateVotes%
Republican William A. Dawson (Incumbent) 119,683 57.64
Democratic Oscar W. McConkie Jr. 87,97042.36
Total votes207,653 100.0
Republican hold

1958

1958 United States House of Representatives elections [30]
PartyCandidateVotes%
Democratic David S. King 91,213 51.11
Republican William A. Dawson (Incumbent)87,23448.89
Total votes178,447 100.0
Democratic gain from Republican

1960

1960 United States House of Representatives elections [31]
PartyCandidateVotes%
Democratic David S. King (Incumbent) 120,771 50.82
Republican Sherman P. Lloyd 116,88149.18
Total votes237,652 100.0
Democratic hold

1962

1962 United States House of Representatives elections [32]
PartyCandidateVotes%
Republican Sherman P. Lloyd 108,385 53.92
Democratic Bruce Sterling Jenkins 92,63146.08
Total votes201,016 100.0
Republican gain from Democratic

1964

1964 United States House of Representatives elections [33]
PartyCandidateVotes%
Democratic David S. King 149,754 57.54
Republican Thomas G. Judd110,51242.46
Total votes260,266 100.0
Democratic gain from Republican

1966

1966 United States House of Representatives elections [34]
PartyCandidateVotes%
Republican Sherman P. Lloyd 96,426 61.25
Democratic David S. King (Incumbent)61,00138.75
Total votes157,427 100.0
Republican gain from Democratic

1968

1968 United States House of Representatives elections [35]
PartyCandidateVotes%
Republican Sherman P. Lloyd (Incumbent) 130,127 61.65
Democratic Galen J. Ross80,94838.35
Total votes211,075 100.0
Republican hold

1970

1970 United States House of Representatives elections [36]
PartyCandidateVotes%
Republican Sherman P. Lloyd (Incumbent) 97,549 52.27
Democratic Adolph Herman Nance87,00046.61
American Independent Stephen D. Marsh2,0941.12
Total votes186,643 100.0
Republican hold

1972

1972 United States House of Representatives elections [37]
PartyCandidateVotes%
Democratic Wayne Owens 132,832 48.89
Republican Sherman P. Lloyd (Incumbent)107,18539.45
American Bruce R. Bangerter31,68511.66
Total votes271,702 100.0
Democratic gain from Republican

1974

1974 United States House of Representatives elections [38]
PartyCandidateVotes%
Democratic Allan Howe 105,739 49.48
Republican Stephen Harmsen100,25946.92
American Roben J. Schafer6,4823.03
Libertarian Karl J. Bray1,2180.57
Total votes213,698 100.0
Democratic hold

1976

1976 United States House of Representatives elections [39]
PartyCandidateVotes%
Republican David Daniel Marriott 144,861 52.43
Democratic Allan Howe (Incumbent)110,93140.15
Independent Darrell McCarty (as a write-in)20,5087.42
Total votes276,300 100.0
Republican gain from Democratic

1978

1978 United States House of Representatives elections [40]
PartyCandidateVotes%
Republican David Daniel Marriott (Incumbent) 121,492 62.26
Democratic Edwin Brown Firmage68,89935.30
American Independent Lawrence Rey Tophman1,9400.99
Independent Bruce Bangerter1,5120.77
Independent William C. Hoyle1,3230.68
Total votes195,166 100.0
Republican hold

1980

1980 United States House of Representatives elections [41]
PartyCandidateVotes%
Republican David Daniel Marriott (Incumbent) 194,885 67.02
Democratic Arthur L. Monson87,96730.25
Independent Stan Larsen5,4111.86
American Steven Ray Montgomery1,5200.52
Socialist Workers David P. Hurst9820.34
Total votes290,765 100.0
Republican hold

1982

1982 United States House of Representatives elections [42]
PartyCandidateVotes%
Republican David Daniel Marriott (Incumbent) 92,109 53.84
Democratic Frances Farley 78,98146.16
Total votes171,090 100.0
Republican hold

1984

1984 United States House of Representatives elections [43]
PartyCandidateVotes%
Republican David Smith Monson 105,540 49.37
Democratic Frances Farley105,04449.13
Libertarian Hugh A. Butler1,4560.68
Independent James Waters9620.45
American Maryellen Gardner7910.37
Total votes213,793 100.0
Republican hold

1986

1986 United States House of Representatives elections [44]
PartyCandidateVotes%
Democratic Wayne Owens 76,921 55.18
Republican M. Tom Shimizu60,96743.74
Libertarian Stephen Carmichael Carr1,3020.93
Socialist Workers Scott Alan Breen2000.14
Total votes139,390 100.0
Democratic gain from Republican

1988

1988 United States House of Representatives elections [45]
PartyCandidateVotes%
Democratic Wayne Owens (Incumbent) 112,129 57.40
Republican Richard Snelgrove80,21241.06
Libertarian Michael Lee2,9971.54
Total votes195,338 100.0
Democratic hold

1990

1990 United States House of Representatives elections [46]
PartyCandidateVotes%
Democratic Wayne Owens (Incumbent) 85,167 57.60
Republican Genevieve Atwood58,86939.81
Independent Lawrence Rey Topham3,4242.31
Socialist Workers Eleanor Garcia4110.28
Total votes147,871 100.0
Democratic hold

1992

1992 United States House of Representatives elections [47]
PartyCandidateVotes%
Democratic Karen Shepherd 127,738 50.50
Republican Enid Greene 118,03746.66
Independent A. Peter Crane6,2742.48
Socialist Workers Eileen Koschak6500.26
Total votes252,969 100.0
Democratic hold

1994

1994 United States House of Representatives elections [48]
PartyCandidateVotes%
Republican Enid Greene 85,507 45.83
Democratic Karen Shepherd (Incumbent)66,91135.86
Independent Merrill Cook 34,16718.31
Total votes186,585 100.0
Republican gain from Democratic

1996

1996 United States House of Representatives elections [49]
PartyCandidateVotes%
Republican Merrill Cook 129,963 54.99
Democratic Rocky Anderson 100,28342.44
Independent American Arly H. Pedersen3,0701.30
Natural Law Catherine Carter2,9811.26
Write-in240.01
Total votes236,321 100.0
Republican hold

1998

1998 United States House of Representatives elections [50]
PartyCandidateVotes%
Republican Merrill Cook (Incumbent) 93,718 52.76
Democratic Lily Eskelsen 77,19843.46
Independent Ken Larsen 3,9982.25
Libertarian Brian E. Swim1,3900.78
Independent American Arly H. Pedersen8130.46
Natural Law Robert C. Lesh5240.29
Total votes177,641 100.0
Republican hold

2000

2000 United States House of Representatives elections [51]
PartyCandidateVotes%
Democratic Jim Matheson 145,021 55.86
Republican Derek W. Smith107,11441.26
Independent American Bruce Bangerter4,7041.81
Libertarian Peter Pixton2,1650.83
Independent Steven Alberts Voris5970.23
Total votes259,601 100.0
Democratic gain from Republican

2002

2002 United States House of Representatives elections [52]
PartyCandidateVotes%
Democratic Jim Matheson (Incumbent) 110,764 49.43
Republican John Swallow 109,12348.69
Green Patrick S. Diehl2,5891.16
Libertarian Ron Copier1,6220.72
Total votes224,098 100.0
Democratic hold

2004

2004 United States House of Representatives elections [53]
PartyCandidateVotes%
Democratic Jim Matheson (Incumbent) 187,250 54.76
Republican John Swallow 147,77843.21
Constitution Jeremy Paul Petersen3,5411.04
Green Patrick S. Diehl2,1890.64
Personal Choice Ronald R. Amos1,2100.35
Total votes341,968 100.0
Democratic hold

2006

2006 United States House of Representatives elections [54]
PartyCandidateVotes%
Democratic Jim Matheson (Incumbent) 133,231 59.00
Republican LaVar Christensen 84,23437.30
Constitution W. David Perry3,3951.50
Green Bob Brister3,3381.48
Libertarian Austin Sherwood Lett1,6200.72
Total votes225,818 100.0
Democratic hold

2008

2008 United States House of Representatives elections [55]
PartyCandidateVotes%
Democratic Jim Matheson (Incumbent) 220,666 63.36
Republican Bill Dew120,08334.47
Libertarian Matthew Arndt4,5761.31
Constitution Dennis Ray Emery3,0000.86
Total votes348,325 100.0
Democratic hold

2010

2010 United States House of Representatives elections [56]
PartyCandidateVotes%
Democratic Jim Matheson (Incumbent) 127,151 50.49
Republican Morgan Philpot 116,00146.06
Constitution Randall Hinton4,5781.82
Independent Dave Glissmeyer2,3910.95
Independent Wayne L. Hill1,7260.69
Total votes251,847 100.0
Democratic hold

2012

2012 United States House of Representatives elections [57]
PartyCandidateVotes%
Republican Chris Stewart 154,523 62.17
Democratic Jay Seegmiller 83,17633.47
Constitution Jonathan D. Garrard5,0512.03
Independent Joseph Andrade2,9711.20
Independent Charles E. Kimball2,8241.14
Total votes248,545 100.0
Republican gain from Democratic

2014

2014 United States House of Representatives elections [58]
PartyCandidateVotes%
Republican Chris Stewart (Incumbent) 88,915 60.82
Democratic Luz Robles 47,58532.55
Constitution Shaun McCausland4,5093.08
Independent American Wayne L. Hill3,3282.28
Independent Bill Barron1,7341.19
Write-In Warren Rogers1170.08
Total votes146,188 100.0
Republican hold

2016

2016 United States House of Representatives elections [59]
PartyCandidateVotes%
Republican Chris Stewart (Incumbent) 170,524 61.60
Democratic Charlene Albarran93,77833.88
Constitution Paul J. McCollaum Jr.12,5174.52
Total votes276,819 100.0
Republican hold

2018

2018 United States House of Representatives elections [60]
PartyCandidateVotes%
Republican Chris Stewart (Incumbent) 151,489 56.10
Democratic Shireen Ghorbani 105,05138.90
Libertarian Jeffrey Whipple13,5045.00
Total votes270,044 100.0
Republican hold

2020

2020 United States House of Representatives elections
PartyCandidateVotes%
Republican Chris Stewart (Incumbent) 208,997 59.0
Democratic Kael Weston 129,76236.6
Libertarian Rob Latham15,4654.4
Total votes354,224 100.0
Republican hold

2022

2022 United States House of Representatives elections [61]
PartyCandidateVotes%
Republican Chris Stewart (incumbent) 154,883 59.71
Democratic Nicholas Mitchell88,22434.01
United Utah Jay McFarland8,6223.32
Constitution Cassie Easley7,6702.96
Total votes259,399 100
Republican hold

2023

2023 Utah's 2nd congressional district special election
PartyCandidateVotes%±%
Republican Celeste Maloy 89,866 57.07 −2.64
Democratic Kathleen Riebe 52,94933.62−0.39
Libertarian Bradley Green4,5282.88N/A
Constitution Cassie Easley3,6782.34−0.62
United Utah January Walker2,8561.81−1.51
Independent Perry Myers2,2761.45N/A
Independent Joseph Buchman1,2810.81N/A
Write-in 390.02N/A
Total votes157,473 100.00
Republican hold

See also

Related Research Articles

<span class="mw-page-title-main">Texas's 15th congressional district</span> U.S. House district for Texas

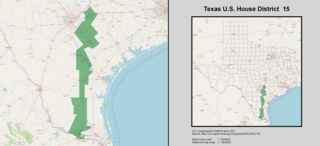
Texas's 15th congressional district of the United States House of Representatives includes a thin section of the far south of the state of Texas. The district's current Representative is Republican Monica De La Cruz. Elected in 2022, de la Cruz is the first Republican and woman to represent the district.

<span class="mw-page-title-main">New Mexico's 1st congressional district</span> U.S. House district for New Mexico

New Mexico's 1st congressional district of the United States House of Representatives serves the central area of New Mexico, including most of Bernalillo County, all of Torrance County, and parts of Sandoval, Santa Fe and Valencia counties. It includes almost three-fourths of Albuquerque. The district has a notable Native American presence, encompassing several pueblos including the Pueblo of Laguna and Sandia Pueblo, and the Tohajiilee Navajo Reservation outside Albuquerque. The seat is currently represented by Democrat Melanie Stansbury. With a Cook Partisan Voting Index rating of D+5, it is the most Democratic district in New Mexico, a state with an all-Democratic congressional delegation.

<span class="mw-page-title-main">New Mexico's 2nd congressional district</span> U.S. House district for New Mexico

New Mexico's 2nd congressional district serves the southern half of New Mexico, including Las Cruces, and the southern fourth of Albuquerque. It is currently represented by Democrat Gabe Vasquez.

Utah's 1st congressional district serves the northern area of Utah, including the cities of Ogden, Logan, Park City, Layton, Clearfield, Salt Lake City, and the northern half of the Great Salt Lake.

Ohio's 2nd congressional district is a district in southern Ohio. It is currently represented by Republican Brad Wenstrup.

New Jersey's 2nd congressional district, based in Southern New Jersey, is represented by Republican Jeff Van Drew. He was first elected as a Democrat in 2018, but announced on December 19, 2019, that he would be switching parties. The district, which is New Jersey's largest geographically, is a Republican-leaning seat that has shifted to the right since the late 2010s.

<span class="mw-page-title-main">Maryland's 5th congressional district</span> U.S. House district for Maryland

Maryland's 5th congressional district comprises all of Charles, St. Mary's, and Calvert counties, as well as portions of Prince George's and Anne Arundel counties. The district is currently represented by Democrat Steny Hoyer, who from 2007 to 2011 and from 2019 to 2023 was House Majority Leader.

Alabama's 4th congressional district is a U.S. congressional district in Alabama, which elects a representative to the United States House of Representatives. It encompasses the counties of Franklin, Colbert, Marion, Lamar, Fayette, Walker, Winston, Cullman, Lawrence, Marshall, Etowah, and DeKalb. It also includes parts of Jackson and Tuscaloosa counties, as well as parts of the Decatur Metropolitan Area and the Huntsville-Decatur Combined Statistical Area.

Ohio's 12th congressional district is a United States congressional district in central Ohio, covering Athens County, Coshocton County, Fairfield County, Guernsey County, Knox County, Licking County, Morgan County, Muskingum County and Perry County along with parts of Delaware, Holmes and Tuscarawas counties. The district includes communities east of Columbus including Zanesville, Cambridge, and Mount Vernon. It is currently represented by Troy Balderson, a member of the Republican Party. Balderson took office following a special election held on August 7, 2018, to replace Rep. Pat Tiberi, who had resigned on January 15, 2018. Balderson was then re-elected in the 2018 general election two months later.

<span class="mw-page-title-main">Pennsylvania's 1st congressional district</span> U.S. House district for Pennsylvania

Pennsylvania's first congressional district includes all of Bucks County and a sliver of Montgomery County in southeastern Pennsylvania. It has been represented by Brian Fitzpatrick since 2019.

Washington's 5th congressional district encompasses the Eastern Washington counties of Ferry, Stevens, Pend Oreille, Lincoln, Spokane, Whitman, Walla Walla, Columbia, Garfield, and Asotin, along with parts of Adams and Franklin. It is centered on Spokane, the state's second largest city.

Utah's 3rd congressional district is a congressional district in the United States House of Representatives. It is located in southern and eastern Utah and includes the cities of Orem and Provo.

Michigan's 7th congressional district is a United States congressional district in Southern Michigan and portions of Central Michigan. From 2004 to 2013 it consisted of all of Branch, Eaton, Hillsdale, Jackson, and Lenawee counties, and included most of Calhoun and a large portion of western and northern Washtenaw counties. The current district, which was created in 2022, is centered around Lansing, Michigan's state capital, and includes all of Clinton, Shiawassee, Ingham, and Livingston counties, as well as portions of Eaton and Oakland counties.

<span class="mw-page-title-main">Virginia's 6th congressional district</span> U.S. House district for Virginia

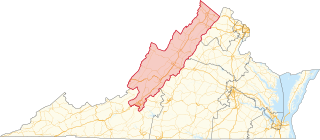
Virginia's sixth congressional district is a United States congressional district in the Commonwealth of Virginia. It covers much of the west-central portion of the state, including Roanoke and most of the Shenandoah Valley. The current representative is Ben Cline (R), who has held the seat since the 2019 retirement of incumbent Republican Bob Goodlatte.

<span class="mw-page-title-main">Oklahoma's 5th congressional district</span> U.S. House district for Oklahoma

Oklahoma's 5th congressional district is a congressional district in the U.S. state of Oklahoma. It borders all of the other congressional districts in the state except the 1st district. It is densely populated and covers most of Oklahoma County and all of Lincoln, Pottawatomie and Seminole counties, as well as parts of Canadian and Logan counties. With a Cook Partisan Voting Index rating of R+12, it is the least Republican district in Oklahoma, a state with an all-Republican congressional delegation.

Michigan's 8th congressional district is a United States congressional district in Central Michigan. The district was first created in 1873, after redistricting following the 1870 census. From 2003 to 2013, it consisted of all of Clinton, Ingham, and Livingston counties, and included the southern portion of Shiawassee and the northern portion of Oakland counties. From 2013 to 2023, the district no longer covered Clinton or Shiawassee counties and instead covered more of Oakland County, including Rochester. In 2023, the district was redrawn to be centered on the city of Flint, and includes all of Saginaw and Bay counties, almost all of Genesee County, and portions of Midland and Tuscola counties.

<span class="mw-page-title-main">Montana's 1st congressional district</span> U.S. House district for Montana

Montana's 1st congressional district is a congressional district in the United States House of Representatives that was apportioned after the 2020 United States census. The first candidates ran in the 2022 elections for a seat in the 118th United States Congress.

<span class="mw-page-title-main">Montana's 2nd congressional district</span> U.S. House district for Montana

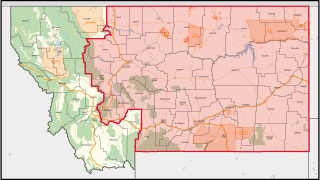
Montana's second congressional district is a congressional district in the United States House of Representatives that was apportioned after the 2020 United States census. The first candidates ran in the 2022 elections for a seat in the 118th United States Congress.

<span class="mw-page-title-main">Idaho's 2nd congressional district</span> U.S. House district for Idaho

Idaho's 2nd congressional district is one of two congressional districts in the U.S. state of Idaho, in the eastern portion of the state. Beginning with the 2012 election, the district expanded westward and now includes most of Boise, the state capital and largest city. The district is currently represented by Mike Simpson, a Republican of Idaho Falls. A former dentist in Blackfoot, he was first elected in 1998; the seat opened when his predecessor Mike Crapo successfully ran for the U.S. Senate.

<span class="mw-page-title-main">Idaho's 1st congressional district</span> U.S. House district for Idaho

Idaho's 1st congressional district is one of two congressional districts in the U.S. state of Idaho. It comprises the western portion of the state. The 1st district is currently represented by Russ Fulcher, a Republican from Meridian, who was first elected in 2018, and re-elected in 2020 and 2022.

References

  1. "My Congressional District".
  2. 1 2 "2022 Cook PVI: District Map and List". Cook Political Report. Retrieved January 10, 2023.
  3. "Daily Kos Elections 2008, 2012 & 2016 presidential election results for congressional districts used in 2018 elections - Google Drive". docs.google.com.
  4. "Presidential Election Results, by district" via Daily Kos.
  5. "Presidential Election Results, by district". December 15, 2008 via swingstateproject.com.
  6. 1912 Election Results
  7. 1914 Election Results
  8. 1916 Election Results
  9. 1918 Election Results
  10. 1920 Election Results
  11. 1922 Election Results
  12. 1924 Election Results
  13. 1926 Election Results
  14. 1928 Election Results
  15. 1930 Special Election Results
  16. 1930 Election Results
  17. 1932 Election Results
  18. 1934 Election Results
  19. 1936 Election Results
  20. 1938 Election Results
  21. 1940 Election Results
  22. 1942 Election Results
  23. 1944 Election Results
  24. 1946 Election Results
  25. 1948 Election Results
  26. 1950 Election Results
  27. 1952 Election Results
  28. 1954 Election Results
  29. 1956 Election Results
  30. 1958 Election Results
  31. 1960 Election Results
  32. 1962 Election Results
  33. 1964 Election Results
  34. 1966 Election Results
  35. 1968 Election Results
  36. 1970 Election Results
  37. 1972 Election Results
  38. 1974 Election Results
  39. 1976 Election Results
  40. 1978 Election Results
  41. 1980 Election Results
  42. 1982 Election Results
  43. 1984 Election Results
  44. 1986 Election Results
  45. 1988 Election Results
  46. 1990 Election Results
  47. 1992 Election Results
  48. 1994 Election Results
  49. 1996 Election Results
  50. 1998 Election Results
  51. 2000 Election Results
  52. 2002 Election Results
  53. 2004 Election Results
  54. 2006 Election Results
  55. 2008 Election Results
  56. 2010 Election Results
  57. 2012 Election Results
  58. 2014 Election Results
  59. 2016 Election Results
  60. 2018 Election Results
  61. "US Congressional District 2". Utah Election Preliminary Results. Retrieved December 14, 2022.

38°N110°W / 38°N 110°W / 38; -110