2002 United States House of Representatives elections

Last updated

2002 United States House of Representatives elections
Flag of the United States (Pantone).svg
  2000 November 5, 2002 2004  

All 435 seats in the United States House of Representatives
218 seats needed for a majority
 Majority partyMinority party
  Dennis Hastert 109th pictorial photo.jpg Dick Gephardt portrait (tighter crop).jpg
Leader Dennis Hastert Dick Gephardt
(retired as leader)
Party Republican Democratic
Leader sinceJanuary 3, 1999January 3, 1995
Leader's seat Illinois 14th Missouri 3rd
Last election221 seats, 47.6%212 seats, 47.1%
Seats won229205
Seat changeIncrease2.svg 8Decrease2.svg 7
Popular vote37,332,55233,795,885
Percentage50.0%45.2%
SwingIncrease2.svg 2.4%Decrease2.svg 1.9%

 Third party
 
Party Independent
Last election2 seats
Seats won1
Seat changeDecrease2.svg 1
Popular vote398,398
Percentage0.5%
SwingDecrease2.svg 0.2%

US House 2002 Map.svg
Results:
     Democratic hold     Democratic gain
     Republican hold     Republican gain
     Independent hold

Speaker before election

Dennis Hastert
Republican

Elected Speaker

Dennis Hastert
Republican

The 2002 United States House of Representatives elections were held on November 5, 2002, in the middle of President George Walker Bush's first term, to elect U.S. Representatives to serve in the 108th United States Congress. This was the first congressional election using districts drawn up during the 2000 United States redistricting cycle on the basis of the 2000 census.

Contents

Although it was a midterm election under a Republican president, the Republican Party gained a net eight seats, solidifying their majority. This was the largest Republican majority since 1995. This was one of three midterm elections in which the party of the incumbent president did not lose seats either in the House or in the Senate (the other such mid-term elections were in 1934 and 1998). Some speculate that this may have been due to increased support for the President's party in the wake of the September 11 attacks. [1] It was the most recent midterm election in which the president's party did not lose control of the House.

Results

Federal


2291205
RepublicanIDemocratic

Summary of the November 5, 2002 United States House of Representatives election results

Political PartiesSeatsPopular vote
2000 2002Net
change
StrengthVote %Change
Republican Party 221229Increase2.svg 852.6%37,332,55250.0%+2.4%
Democratic Party 212205Decrease2.svg 747.1%33,795,88545.2%-1.9%
Libertarian Party ----1,050,7761.4%-0.2%
Independent 21Decrease2.svg 10.2%398,3980.5%-0.2%
Green Party ----297,1870.4%+0.1%
Constitution Party ----129,7480.2%+0.1%
Conservative Party ----48,9640.1%-
Others----1,653,0452.2%+0.4%
Total4354340100.0%74,706,555100.0%-

Source: Election Statistics - Office of the Clerk

Popular vote
Republican
49.97%
Democratic
45.24%
Libertarian
1.41%
Green
0.40%
Others
2.98%
House seats
Republican
52.64%
Democratic
47.13%
Independent
0.23%

Maps

Retirements

In the November general elections, 35 incumbents did not seek re-election, either to retire or to seek other positions.

Democrats

13 Democrats did not seek re-election.

  1. Florida 17 : Carrie Meek retired.
  2. Illinois 5 : Rod Blagojevich retired to run for Governor of Illinois.
  3. Indiana 2 : Tim Roemer retired when redistricted from the 3rd district.
  4. Maine 2 : John Baldacci retired to run successfully for Governor of Maine.
  5. Michigan 5 : James A. Barcia retired to run for Michigan Senate.
  6. Michigan 10 : David Bonior retired to run for Governor of Michigan.
  7. New York 28 : John J. LaFalce retired when redistricted from the 29th district.
  8. North Carolina 1 : Eva Clayton retired.
  9. Pennsylvania 13 : Robert A. Borski Jr. retired when redistricted from the 3rd district.
  10. Pennsylvania 14 : William J. Coyne retired.
  11. Tennessee 5 : Bob Clement retired to run for U.S. Senator.
  12. Texas 25 : Ken Bentsen Jr. retired to run for U.S. Senator.
  13. Wisconsin 4 : Tom Barrett retired to run for Governor of Wisconsin.

Republicans

22 Republicans did not seek re-election.

  1. Alabama 1 : Sonny Callahan retired.
  2. Alabama 3 : Bob Riley retired to run for Governor of Alabama.
  3. Arizona 2 : Bob Stump retired when redistricted from the 3rd district.
  4. California 39 : Steve Horn retired when redistricted from the 38th district.
  5. Colorado 4 : Bob Schaffer retired.
  6. Florida 13 : Dan Miller retired.
  7. Georgia 3 : Saxby Chambliss retired to run for U.S. Senator.
  8. Iowa 5 : Greg Ganske retired to run for U.S. Senator.
  9. Louisiana 5 : John Cooksey retired to run for U.S. Senator.
  10. Maryland 2 : Bob Ehrlich retired to run for Governor of Maryland.
  11. New Hampshire 1 : John E. Sununu retired to run for U.S. Senator.
  12. New Jersey 5 : Marge Roukema retired.
  13. New Mexico 2 : Joe Skeen retired.
  14. New York 19 : Benjamin Gilman retired when redistricted from the 20th district.
  15. Oklahoma 3 : Wes Watkins retired.
  16. Oklahoma 4 : J. C. Watts retired.
  17. South Carolina 3 : Lindsey Graham retired to run for U.S. Senator.
  18. South Dakota at-large : John Thune retired to run for U.S. Senator.
  19. Tennessee 4 : Van Hilleary retired to run for Governor of Tennessee.
  20. Tennessee 7 : Ed Bryant retired to run for U.S. Senator.
  21. Texas 26 : Dick Armey retired.
  22. Utah 1 : James V. Hansen retired.

Resignation and expulsion

2 seats opened early due to a resignation and an expulsion. Neither were filled until the November elections.

Democrats

One Democrat resigned and one was expelled.

  1. Ohio 3 : Tony P. Hall resigned September 9, 2002, to become U.S. Ambassador to the Food and Agriculture Organization.
  2. Ohio 17 : Jim Traficant was expelled July 24, 2002 for criminal conviction.

Republicans

No Republicans resigned.

Incumbents defeated

In primary elections

Democrats

Six Democrats lost renomination.

  1. Alabama 7 : Earl Hilliard lost renomination to Artur Davis, who then won the general election.
  2. California 18 : Gary Condit lost renomination to Dennis Cardoza, who then won the general election.
  3. Georgia 4 : Cynthia McKinney lost renomination to Denise Majette, who then won the general election.
  4. Michigan 15 : Lynn N. Rivers lost renomination in a redistricting race to John Dingell, who then won the general election.
  5. Ohio 17 : Thomas C. Sawyer lost renomination to Tim Ryan, who then won the general election.
  6. Pennsylvania 12 : Frank Mascara lost renomination in a redistricting race to John Murtha, who then won the general election.

Republicans

Two Republicans lost renomination.

  1. Georgia 7 : Bob Barr lost renomination in a redistricting race to John Linder, who then won the general election.
  2. Indiana 4 : Brian D. Kerns lost renomination in a redistricting race to Steve Buyer, who then won the general election.

In the general election

Democrats

Five Democrats lost re-election to Republicans.

  1. Connecticut 5 : James H. Maloney lost a redistricting race to Nancy Johnson.
  2. Florida 5 : Karen Thurman lost to Ginny Brown-Waite.
  3. Illinois 19 : David D. Phelps lost a redistricting race to John Shimkus.
  4. Minnesota 2 : Bill Luther lost to John Kline.
  5. Mississippi 3 : Ronnie Shows lost a redistricting race to Chip Pickering.

Republicans

Three Republicans lost re-election to Democrats.

  1. Maryland 8 : Connie Morella lost to Chris Van Hollen.
  2. New York 1 : Felix Grucci lost to Tim Bishop.
  3. Pennsylvania 17 : George Gekas lost a redistricting race to Tim Holden.

Open seats that changed parties

Democratic seats won by Republicans

Three Democratic seats were won by Republicans.

  1. Indiana 2 : Won by Chris Chocola.
  2. Michigan 10 : Won by Candice Miller.
  3. Ohio 3 : Won by Mike Turner.

Republican seats won by Democrats

Five Republican seats were won by Democrats.

  1. California 39 : Won by Linda Sánchez.
  2. Georgia 3 : Won by Jim Marshall.
  3. Louisiana 5 : Won by Rodney Alexander.
  4. Maryland 2 : Won by Dutch Ruppersberger.
  5. Tennessee 4 : Won by Lincoln Davis.

Open seats that parties held

Democratic seats held by Democrats

Democrats held five of their open seats.

  1. Florida 17 : Won by Kendrick Meek.
  2. Illinois 5 : Won by Rahm Emanuel.
  3. North Carolina 1 : Won by Frank Ballance.
  4. Tennessee 5 : Won by Jim Cooper.
  5. Texas 25 : Won by Chris Bell.

Republican seats held by Republicans

Republicans held fourteen of their open seats.

  1. Alabama 1 : Won by Jo Bonner.
  2. Alabama 3 : Won by Mike Rogers.
  3. Arizona 2 : Won by Trent Franks.
  4. Colorado 4 : Won by Marilyn Musgrave.
  5. Florida 13 : Won by Katherine Harris.
  6. Iowa 5 : Won by Steve King.
  7. New Hampshire 1 : Won by Jeb Bradley.
  8. New Jersey 5 : Won by Scott Garrett.
  9. New Mexico 2 : Won by Steve Pearce.
  10. Oklahoma 4 : Won by Tom Cole.
  11. South Carolina 3 : Won by Gresham Barrett.
  12. Tennessee 7 : Won by Marsha Blackburn.
  13. Texas 26 : Won by Michael C. Burgess.
  14. Utah 1 : Won by Rob Bishop.

Newly created seats

Of the 435 districts created in the 2000 redistricting, sixteen had no incumbent representative.

Democratic gain

Three Democrats were elected in newly created seats.

  1. Arizona 7 : Won by Raúl Grijalva.
  2. Georgia 13 : Won by David Scott.
  3. North Carolina 13 : Won by Brad Miller.

Republican gain

Thirteen Republicans were elected in newly created seats.

  1. Arizona 1 : Won by Rick Renzi.
  2. California 21 : Won by Devin Nunes.
  3. Colorado 7 : Won by Bob Beauprez.
  4. Florida 24 : Won by Tom Feeney.
  5. Florida 25 : Won by Mario Diaz-Balart.
  6. Georgia 11 : Won by Phil Gingrey.
  7. Georgia 12 : Won by Max Burns.
  8. Michigan 11 : Won by Thad McCotter.
  9. Nevada 3 : Won by Jon Porter.
  10. Pennsylvania 6 : Won by Jim Gerlach.
  11. Pennsylvania 18 : Won by Tim Murphy.
  12. Texas 5 : Won by Jeb Hensarling.
  13. Texas 31 : Won by John Carter.

Closest races

Thirty-eight races were decided by 10% or lower. [2]

DistrictWinnerMargin
Colorado 7th Republican0.07%
Louisiana 5th Democratic (flip)0.56%
Utah 2nd Democratic0.74%
Georgia 3rd Democratic (flip)1.02%
New York 1st Democratic (flip)1.64%
Florida 5th Republican (flip)1.66%
Alabama 3rd Republican2.11%
Pennsylvania 6th Republican2.73%
Pennsylvania 17th Democratic2.82%
Kentucky 3rd Republican3.22%
Georgia 11th Republican3.28%
Kansas 3rd Democratic3.29%
Arizona 1st Republican3.57%
Kentucky 4th Democratic3.57%
Pennsylvania 13th Democratic3.61%
Texas 17th Democratic3.97%
Maine 2nd Democratic4.02%
Maryland 8th Democratic (flip)4.22%
Texas 23rd Republican4.33%
Texas 11th Democratic4.44%
Indiana 2nd Republican (flip)4.68%
North Dakota at-large Democratic4.82%
Washington 2nd Democratic5.00%
Indiana 9th Democratic5.02%
Indiana 8th Republican5.29%
Tennessee 4th Democratic (flip)5.59%
Iowa 2nd Republican6.45%
Oklahoma 4th Republican7.66%
South Dakota at-large Republican7.83%
California 18th Democratic7.89%
Connecticut 2nd Republican8.18%
Iowa 3rd Democratic8.37%
Maryland 2nd Democratic (flip)8.59%
Indiana 7th Democratic8.99%
North Carolina 8th Republican9.01%
Florida 13th Republican9.57%
Illinois 19th Republican9.58%
Oregon 5th Democratic9.65%

Special elections

Two special elections were held for members to serve the remainder of the term ending January 3, 2003.

DistrictIncumbentThis race
MemberPartyFirst electedResultsCandidates
Oklahoma 1 Steve Largent Republican 1994 (Special) Incumbent resigned to run for Governor of Oklahoma.
New member elected January 8, 2002.
Republican hold.
Winner was subsequently re-elected in November.
Hawaii 2 Patsy Mink Democratic 1964
1976 (Retired)
1990 (Special)
Incumbent died September 28, 2002, but was posthumously re-elected, see below.
New member elected November 30, 2002.
Democratic hold.
Winner was subsequently re-elected in a special election on January 4, 2003 for the next term.

Alabama

DistrictIncumbentThis race
MemberPartyFirst electedResultsCandidates
Alabama 1 Sonny Callahan Republican 1984 Incumbent retired.
New member elected.
Republican hold.
  • Green check.svgY Jo Bonner (Republican) 60.5%
  • Judy McCain Belk (Democratic) 37.8%
  • Dick Coffee (Libertarian) 1.7%
Alabama 2 Terry Everett Republican 1992 Incumbent re-elected.
Alabama 3 Bob Riley Republican 1996 Incumbent retired to run for Governor of Alabama.
New member elected.
Republican hold.
Alabama 4 Robert Aderholt Republican 1996 Incumbent re-elected.
  • Green check.svgY Robert Aderholt (Republican) 86.7%
  • Tony Hughes McLendon (Libertarian) 13.0%
Alabama 5 Robert E. Cramer Democratic 1990 Incumbent re-elected.
  • Green check.svgY Robert E. Cramer (Democratic) 73.3%
  • Stephen P. Engel (Republican) 24.7%
  • Alan F. Barksdale (Libertarian) 1.9%
Alabama 6 Spencer Bachus Republican 1992 Incumbent re-elected.
  • Green check.svgY Spencer Bachus (Republican) 89.8%
  • J. Holden McAllister (Libertarian) 9.9%
Alabama 7 Earl Hilliard Democratic 1992 Incumbent lost renomination.
New member elected.
Democratic hold.
  • Green check.svgY Artur Davis (Democratic) 92.4%
  • Lauren Orth McCay (Libertarian) 7.3%

Alaska

DistrictIncumbentThis race
MemberPartyFirst electedResultsCandidates
Alaska at-large Don Young Republican 1973 (Special) Incumbent re-elected.
  • Green check.svgY Don Young (Republican) 74.51%
  • Clifford Mark Greene (Democratic) 17.28%
  • Russell F. DeForest (Green) 6.34%
  • Rob Clift (Libertarian) 1.67%

Arizona

The state gained two seats in reapportionment.

DistrictIncumbentThis race
MemberPartyFirst electedResultsCandidates
Arizona 1 None (District created)New district.
New member elected.
Republican gain.
  • Green check.svgY Rick Renzi (Republican) 49.2%
  • George Cordova (Democratic) 45.6%
  • Edwin Porr (Libertarian) 5.2%
Arizona 2 Bob Stump
Redistricted from the 3rd district
Republican 1976 [lower-alpha 1] Incumbent retired.
New member elected.
Republican hold.
  • Green check.svgY Trent Franks (Republican) 59.9%
  • Randy Camacho (Democratic) 36.6%
  • Edward R. Carlson (Libertarian) 3.5%
Arizona 3 John Shadegg
Redistricted from the 4th district
Republican 1994 Incumbent re-elected.
  • Green check.svgY John Shadegg (Republican) 67.3%
  • Charles Hill (Democratic) 30.3%
  • Mark Yannone (Libertarian) 2.4%
Arizona 4 Ed Pastor
Redistricted from the 2nd district
Democratic 1990 Incumbent re-elected.
  • Green check.svgY Ed Pastor (Democratic) 67.4%
  • Jonathan Barnert (Republican) 27.8%
  • Amy Gibbons (Libertarian) 4.8%
Arizona 5 J. D. Hayworth
Redistricted from the 6th district
Republican 1994 Incumbent re-elected.
  • Green check.svgY J. D. Hayworth (Republican) 61.2%
  • Craig Columbus (Democratic) 36.3%
  • Warren Severin (Libertarian) 2.6%
Arizona 6 Jeff Flake
Redistricted from the 1st district
Republican 2000 Incumbent re-elected.
  • Green check.svgY Jeff Flake (Republican) 65.9%
  • Deborah Thomas (Democratic) 31.6%
  • Andy Wagner (Libertarian) 2.5%
Arizona 7 None (District created)New district.
New member elected.
Democratic gain.
  • Green check.svgY Raúl Grijalva (Democratic) 59.0%
  • Ross Hieb (Republican) 37.1%
  • John Nemeth (Libertarian) 3.9%
Arizona 8 Jim Kolbe
Redistricted from the 5th district
Republican 1984 Incumbent re-elected.
  • Green check.svgY Jim Kolbe (Republican) 63.3%
  • Mary Judge Ryan (Democratic) 33.6%
  • Joe Duarte (Libertarian) 3.1%

Arkansas

DistrictIncumbentThis race
MemberPartyFirst electedResultsCandidates
Arkansas 1 Marion Berry Democratic 1996 Incumbent re-elected.
Arkansas 2 Vic Snyder Democratic 1996 Incumbent re-elected.
  • Green check.svgY Vic Snyder (Democratic) 92.9%
  • Ed Garner (Independent) 7.1%
Arkansas 3 John Boozman Republican 2001 Incumbent re-elected.
  • Green check.svgY John Boozman (Republican) 98.9%
  • George Lyne (Independent) 1.1%
Arkansas 4 Mike Ross Democratic 2000 Incumbent re-elected.

California

The state gained one seat in reapportionment.

DistrictIncumbentThis race
MemberPartyFirst electedResultsCandidates
California 1 Mike Thompson Democratic 1998 Incumbent re-elected.
  • Green check.svgY Mike Thompson (Democratic) 64.07%
  • Lawrence R. Wiesner (Republican) 32.4%
  • Kevin Bastian (Libertarian) 3.53%
California 2 Wally Herger Republican 1988 Incumbent re-elected.
  • Green check.svgY Wally Herger (Republican) 65.79%
  • Mike Johnson (Democratic) 29.31%
  • Patrice Thiessen (Natural Law) 2.72%
  • Charles R. Martin (Libertarian) 2.19%
California 3 Doug Ose Republican 1998 Incumbent re-elected.
  • Green check.svgY Doug Ose (Republican) 62.45%
  • Howard Beeman (Democratic) 34.44%
  • Douglas Arthur Tuma (Libertarian) 3.1%
California 4 John Doolittle Republican 1990 Incumbent re-elected.
  • Green check.svgY John Doolittle (Republican) 64.77%
  • Mark Norberg (Democratic) 31.89%
  • Allen M. Roberts (Libertarian) 3.17%
California 5 Bob Matsui Democratic 1978 Incumbent re-elected.
  • Green check.svgY Bob Matsui (Democratic) 71.47%
  • Richard Frankhuizen (Republican) 26.41%
  • Timothy Roloff (Libertarian) 3.12%
California 6 Lynn Woolsey Democratic 1992 Incumbent re-elected.
  • Green check.svgY Lynn Woolsey (Democratic) 66.69%
  • Paul L. Erickson (Republican) 29.61%
  • Richard O. Barton (Libertarian) 2.36%
  • Jeff Rainforth (Reform) 1.35%
California 7 George Miller Democratic 1974 Incumbent re-elected.
  • Green check.svgY George Miller (Democratic) 70.71%
  • Charles R. Hargrave (Republican) 26.44%
  • Scott A. Wilson (Libertarian) 2.85%
California 8 Nancy Pelosi Democratic 1987 (Special) Incumbent re-elected.
  • Green check.svgY Nancy Pelosi (Democratic) 79.58%
  • G. Michael German (Republican) 12.5%
  • Jay Pond (Green) 6.25%
  • Ira Spivack (Libertarian) 1.66%
California 9 Barbara Lee Democratic 1998 Incumbent re-elected.
  • Green check.svgY Barbara Lee (Democratic) 81.41%
  • Jerald Udinsky (Republican) 15.18%
  • James Eyer (Libertarian) 3.41%
California 10 Ellen Tauscher Democratic 1996 Incumbent re-elected.
  • Green check.svgY Ellen Tauscher (Democratic) 75.59%
  • Sonia E. Alonso Harden (Libertarian) 24.41%
California 11 Richard Pombo Republican 1992 Incumbent re-elected.
  • Green check.svgY Richard Pombo (Republican) 60.31%
  • Elaine Shaw (Democratic) 39.69%
California 12 Tom Lantos Democratic 1980 Incumbent re-elected.
  • Green check.svgY Tom Lantos (Democratic) 68.13%
  • Michael Moloney (Republican) 24.76%
  • Maad Abu-Ghazalah (Libertarian) 7.1%
California 13 Pete Stark Democratic 1972 Incumbent re-elected.
  • Green check.svgY Pete Stark (Democratic) 71.06%
  • Syed Mahmood (Republican) 22.06%
  • Mark Stroberg (Libertarian) 3.04%
  • Don J. Grundmann (American Independent) 2.28%
  • John Bambey (Reform) 1.56%
California 14 Anna Eshoo Democratic 1992 Incumbent re-elected.
  • Green check.svgY Anna Eshoo (Democratic) 68.18%
  • Joe Nixon (Republican) 28.16%
  • Andrew Carver (Libertarian) 3.66%
California 15 Mike Honda Democratic 2000 Incumbent re-elected.
  • Green check.svgY Mike Honda (Democratic) 65.77%
  • Linda Rae Hermann (Republican) 31.01%
  • Jeff Landauer (Libertarian) 3.22%
California 16 Zoe Lofgren Democratic 1994 Incumbent re-elected.
  • Green check.svgY Zoe Lofgren (Democratic) 67.02%
  • Douglas Adams McNea (Republican) 29.8%
  • Dennis Michael Umphress (Libertarian) 3.18%
California 17 Sam Farr Democratic 1993 (Special) Incumbent re-elected.
  • Green check.svgY Sam Farr (Democratic) 68.07%
  • Clint Engler (Republican) 27.02%
  • Ray Glock-Grueneich (Green) 3.27%
  • Jascha Lee (Libertarian) 1.62%
California 18 Gary Condit Democratic 1989 (Special) Incumbent lost renomination.
New member elected.
Democratic hold.
  • Green check.svgY Dennis Cardoza (Democratic) 51.26%
  • Dick Monteith (Republican) 43.37%
  • Kevin Cripe (American Independent) 3.32%
  • Linda De Groat (Libertarian) 2%
California 19 George Radanovich Republican 1994 Incumbent re-elected.
  • Green check.svgY George Radanovich (Republican) 67.31%
  • John Veen (Democratic) 30.04%
  • Patrick Lee McHargue (Libertarian) 1.66%
California 20 Cal Dooley Democratic 1990 Incumbent re-elected.
  • Green check.svgY Cal Dooley (Democratic) 63.7%
  • Andre Minuth (Republican) 34.28%
  • Varrin Swearingen (Libertarian) 2.03%
California 21 None (District created)New district.
New member elected.
Republican gain.
  • Green check.svgY Devin Nunes (Republican) 70.49%
  • David LaPere (Democratic) 26.24%
  • Jonathan Richter (Libertarian) 3.28%
California 22 Bill Thomas
Redistricted from the 21st district
Republican 1978 Incumbent re-elected.
  • Green check.svgY Bill Thomas (Republican) 73.33%
  • Jaime Corvera (Democratic) 23.73%
  • Frank Coates (Libertarian) 2.94%
California 23 Lois Capps
Redistricted from the 22nd district
Democratic 1998 Incumbent re-elected.
  • Green check.svgY Lois Capps (Democratic) 59.03%
  • Beth Rogers (Republican) 38.59%
  • James Hill (Libertarian) 2.38%
California 24 Elton Gallegly
Redistricted from the 23rd district
Republican 1986 Incumbent re-elected.
  • Green check.svgY Elton Gallegly (Republican) 65.18%
  • Fern Rudin (Democratic) 31.76%
  • Gary Harber (Libertarian) 3.06%
California 25 Buck McKeon Republican 1992 Incumbent re-elected.
  • Green check.svgY Buck McKeon (Republican) 64.97%
  • Robert Conaway (Democratic) 31.1%
  • Frank Consolo (Libertarian) 3.93%
California 26 David Dreier
Redistricted from the 28th district
Republican 1980 Incumbent re-elected.
  • Green check.svgY David Dreier (Republican) 63.77%
  • Marjorie Musser Mikels (Democratic) 33.49%
  • Randall Weissbuch (Libertarian) 2.73%
California 27 Brad Sherman
Redistricted from the 24th district
Democratic 1996 Incumbent re-elected.
  • Green check.svgY Brad Sherman (Democratic) 61.96%
  • Robert Levy (Republican) 38.04%
California 28 Howard Berman
Redistricted from the 26th district
Democratic 1982 Incumbent re-elected.
  • Green check.svgY Howard Berman (Democratic) 71.4%
  • David Hernandez Jr. (Republican) 23.16%
  • Kelley Ross (Libertarian) 5.45%
California 29 Adam Schiff
Redistricted from the 27th district
Democratic 2000 Incumbent re-elected.
  • Green check.svgY Adam Schiff (Democratic) 62.56%
  • Jim Scileppi (Republican) 33.42%
  • Ted Brown (Libertarian) 4.02%
California 30 Henry Waxman
Redistricted from the 29th district
Democratic 1974 Incumbent re-elected.
  • Green check.svgY Henry Waxman (Democratic) 70.37%
  • Tony Goss (Republican) 29.63%
California 31 Xavier Becerra
Redistricted from the 30th district
Democratic 1992 Incumbent re-elected.
  • Green check.svgY Xavier Becerra (Democratic) 81.15%
  • Luis Vega (Republican) 18.85%
California 32 Hilda Solis
Redistricted from the 31st district
Democratic 2000 Incumbent re-elected.
  • Green check.svgY Hilda Solis (Democratic) 68.79%
  • Emma Fischbeck (Republican) 27.46%
  • Michael McGuire (Libertarian) 3.74%
California 33 Diane Watson
Redistricted from the 32nd district
Democratic 2001 (Special) Incumbent re-elected.
  • Green check.svgY Diane Watson (Democratic) 82.55%
  • Andrew Kim (Republican) 14.1%
  • Charles Tate (Libertarian) 3.35%
California 34 Lucille Roybal-Allard
Redistricted from the 33rd district
Democratic 1992 Incumbent re-elected.
California 35 Maxine Waters Democratic 1990 Incumbent re-elected.
  • Green check.svgY Maxine Waters (Democratic) 77.51%
  • Ross Moen (Republican) 19.37%
  • Gordon Michael Mego (AIndependent) 3.12%
California 36 Jane Harman Democratic 1992
1998 (Retired)
2000
Incumbent re-elected.
  • Green check.svgY Jane Harman (Democratic) 61.35%
  • Stuart Johnson (Republican) 35.01%
  • Mark McSpadden (Libertarian) 3.63%
California 37 Juanita Millender-McDonald Democratic 1996 Incumbent re-elected.
California 38 Grace Napolitano
Redistricted from the 34th district
Democratic 1998 Incumbent re-elected.
  • Green check.svgY Grace Napolitano (Democratic) 71.11%
  • Alex Burrola (Republican) 26.27%
  • Al Cuperus (Libertarian) 2.61%
California 39 Steve Horn
Redistricted from the 38th district
Republican 1992 Incumbent retired.
New member elected.
Democratic gain.
  • Green check.svgY Linda Sánchez (Democratic) 54.81%
  • Tim Escobar (Republican) 40.82%
  • Richard G. Newhouse (Libertarian) 4.37%
California 40 Ed Royce
Redistricted from the 39th district
Republican 1992 Incumbent re-elected.
  • Green check.svgY Ed Royce (Republican) 67.64%
  • Christina Avalos (Democratic) 29.47%
  • Chuck McGlawn (Libertarian) 2.89%
California 41 Jerry Lewis
Redistricted from the 40th district
Republican 1978 Incumbent re-elected.
  • Green check.svgY Jerry Lewis (Republican) 67.38%
  • Keith Johnson (Democratic) 29.63%
  • Kevin Craig (Libertarian) 2.99%
California 42 Gary Miller
Redistricted from the 41st district
Republican 1998 Incumbent re-elected.
  • Green check.svgY Gary Miller (Republican) 67.8%
  • Richard Waldron (Democratic) 28.98%
  • Donald Yee (Libertarian) 3.22%
California 43 Joe Baca
Redistricted from the 42nd district
Democratic 1999 (Special) Incumbent re-elected.
  • Green check.svgY Joe Baca (Democratic) 66.39%
  • Wendy Neighbor (Republican) 30.47%
  • Ethel Mohler (Libertarian) 3.14%
California 44 Ken Calvert
Redistricted from the 43rd district
Republican 1992 Incumbent re-elected.
  • Green check.svgY Ken Calvert (Republican) 63.66%
  • Louis Vandenberg (Democratic) 31.56%
  • Phill Courtney (Green) 4.78%
California 45 Mary Bono
Redistricted from the 44th district
Republican 1998 Incumbent re-elected.
  • Green check.svgY Mary Bono (Republican) 65.23%
  • Elle Kurpiewski (Democratic) 32.72%
  • Rod Miller-Boyer (Libertarian) 2.05%
California 46 Dana Rohrabacher
Redistricted from the 45th district
Republican 1988 Incumbent re-elected.
  • Green check.svgY Dana Rohrabacher (Republican) 61.73%
  • Gerrie Schipske (Democratic) 34.54%
  • Keith Gann (Libertarian) 3.68%
California 47 Loretta Sanchez
Redistricted from the 46th district
Democratic 1996 Incumbent re-elected.
  • Green check.svgY Loretta Sanchez (Democratic) 60.56%
  • Jeff Chavez (Republican) 34.69%
  • Paul Marsden (Libertarian) 4.2%
California 48 Christopher Cox
Redistricted from the 47th district
Republican 1988 Incumbent re-elected.
  • Green check.svgY Christopher Cox (Republican) 68.44%
  • John Graham (Democratic) 28.44%
  • Joe Michael Cobb (Libertarian) 3.12%
California 49 Darrell Issa
Redistricted from the 48th district
Republican 2000 Incumbent re-elected.
  • Green check.svgY Darrell Issa (Republican) 77.22%
  • Karl Dietrich (Libertarian) 21.95%
California 50 Duke Cunningham
Redistricted from the 51st district
Republican 1990 Incumbent re-elected.
  • Green check.svgY Duke Cunningham (Republican) 64.33%
  • Del Stewart (Democratic) 32.34%
  • Richard Fontanesi (Libertarian) 3.33%
California 51 Bob Filner
Redistricted from the 50th district
Democratic 1992 Incumbent re-elected.
  • Green check.svgY Bob Filner (Democratic) 57.93%
  • Maria Garcia (Republican) 39.33%
  • Jeffrey Keup (Libertarian) 2.74%
California 52 Duncan L. Hunter Republican 1980 Incumbent re-elected.
  • Green check.svgY Duncan L. Hunter (Republican) 70.15%
  • Peter Moore-Kochlacs (Democratic) 25.75%
  • Michael Benoit (Libertarian) 4.1%
California 53 Susan Davis
Redistricted from the 49th district
Democratic 2000 Incumbent re-elected.
  • Green check.svgY Susan Davis (Democratic) 62.19%
  • Bill VanDeWeghe (Republican) 37.78%

Colorado

The state gained one seat in reapportionment.

DistrictIncumbentThis race
MemberPartyFirst electedResultsCandidates
Colorado 1 Diana DeGette Democratic 1996 Incumbent re-elected.
  • Green check.svgY Diana DeGette (Democratic) 66.28%
  • Ken Chlouber (Republican) 29.59%
  • Ken Seaman (Green) 1.90%
  • Kent Leonard (Libertarian) 1.53%
Colorado 2 Mark Udall Democratic 1998 Incumbent re-elected.
  • Green check.svgY Mark Udall (Democratic) 60.09%
  • Sandy Hume (Republican) 36.77%
  • Norm Olsen (Libertarian) 1.74%
Colorado 3 Scott McInnis Republican 1992 Incumbent re-elected.
  • Green check.svgY Scott McInnis (Republican) 65.80%
  • Dennis Berckefeldt (Democratic) 31.27%
  • Brent Shroyer (Libertarian) 2.00%
Colorado 4 Bob Schaffer Republican 1996 Incumbent retired.
New member elected.
Republican hold.
Colorado 5 Joel Hefley Republican 1986 Incumbent re-elected.
Colorado 6 Tom Tancredo Republican 1998 Incumbent re-elected.
  • Green check.svgY Tom Tancredo (Republican) 66.88%
  • Lance Wright (Democratic) 30.03%
  • Adam Katz (Libertarian) 3.08%
Colorado 7 None (District created)New district.
New member elected.
Republican gain.
  • Green check.svgY Bob Beauprez (Republican) 47.31%
  • Mike Feeley (Democratic) 47.24%
  • Dave Chandler (Green) 1.89%
  • Victor Good (Natural Law) 1.81%
  • Bud Martin (Libertarian) 1.68%

Connecticut

The state lost one seat in reapportionment.

DistrictIncumbentThis race
MemberPartyFirst electedResultsCandidates
Connecticut 1 John B. Larson Democratic 1998 Incumbent re-elected.
  • Green check.svgY John B. Larson (Democratic) 66.79%
  • Phil Steele (Republican) 33.20%
Connecticut 2 Rob Simmons Republican 2000 Incumbent re-elected.
Connecticut 3 Rosa DeLauro Democratic 1990 Incumbent re-elected.
Connecticut 4 Chris Shays Republican 1987 Incumbent re-elected.
  • Green check.svgY Chris Shays (Republican) 64.43%
  • Stephanie Sanchez (Democratic) 35.57%
Connecticut 5 James H. Maloney Democratic 1996 Incumbent lost re-election.
Democratic loss.
  • Green check.svgY Nancy Johnson (Republican) 54.25%
  • James H. Maloney (Democratic) 43.26%
  • Joseph Zdonczyk (Constitution) 1.77%
  • Walter Gengarelly (Libertarian) 0.72%
Nancy Johnson
Redistricted from the 6th district
Republican 1982 Incumbent re-elected.

Delaware

DistrictIncumbentThis race
MemberPartyFirst electedResultsCandidates
Delaware at-large Mike Castle Republican 1992 Incumbent re-elected.
  • Green check.svgY Mike Castle (Republican) 72.07%
  • Michael Miller (Democratic) 26.71%
  • Brad C. Thomas (Libertarian) 1.22%

Florida

The state gained two seats in reapportionment.

DistrictIncumbentThis race
MemberPartyFirst electedResultsCandidates
Florida 1 Jeff Miller Republican 2001 (Special) Incumbent re-elected.
  • Green check.svgY Jeff Miller (Republican) 74.59%
  • Bert Oram (Democratic) 25.40%
Florida 2 Allen Boyd Democratic 1996 Incumbent re-elected.
  • Green check.svgY Allen Boyd (Democratic) 66.90%
  • Tom McGurk (Republican) 33.10%
Florida 3 Corrine Brown Democratic 1992 Incumbent re-elected.
Florida 4 Ander Crenshaw Republican 2000 Incumbent re-elected.
Florida 5 Karen Thurman Democratic 1992 Incumbent lost re-election.
New member elected.
Republican gain.
Florida 6 Cliff Stearns Republican 1988 Incumbent re-elected.
  • Green check.svgY Cliff Stearns (Republican) 65.36%
  • David Bruderly (Democratic) 34.64%
Florida 7 John Mica Republican 1992 Incumbent re-elected.
  • Green check.svgY John Mica (Republican) 59.58%
  • Wayne Hogan (Democratic) 40.42%
Florida 8 Ric Keller Republican 2000 Incumbent re-elected.
  • Green check.svgY Ric Keller (Republican) 65.14%
  • Eddie Diaz (Democratic) 34.86%
Florida 9 Michael Bilirakis Republican 1982 Incumbent re-elected.
Florida 10 Bill Young Republican 1970 Incumbent re-elected.
Florida 11 Jim Davis Democratic 1996 Incumbent re-elected.
Florida 12 Adam Putnam Republican 2000 Incumbent re-elected.
Florida 13 Dan Miller Republican 1992 Incumbent retired.
New member elected.
Republican hold.
Florida 14 Porter Goss Republican 1988 Incumbent re-elected.
Florida 15 Dave Weldon Republican 1994 Incumbent re-elected.
  • Green check.svgY Dave Weldon (Republican) 63.15%
  • Jim Tso (Democratic) 36.85%
Florida 16 Mark Foley Republican 1994 Incumbent re-elected.
  • Green check.svgY Mark Foley (Republican) 78.88%
  • Jack McLain (Constitution) 21.12%
Florida 17 Carrie Meek Democratic 1992 Incumbent retired.
New member elected.
Democratic hold.
Florida 18 Ileana Ros-Lehtinen Republican 1989 Incumbent re-elected.
  • Green check.svgY Ileana Ros-Lehtinen (Republican) 69.11%
  • Ray Chote (Democratic) 28.61%
  • Orin Opperman (Independent) 2.29%
Florida 19 Robert Wexler Democratic 1996 Incumbent re-elected.
  • Green check.svgY Robert Wexler (Democratic) 72.16%
  • Jack Merkl (Republican) 27.84%
Florida 20 Peter Deutsch Democratic 1992 Incumbent re-elected.
Florida 21 Lincoln Díaz-Balart Republican 1992 Incumbent re-elected.
Florida 22 Clay Shaw Republican 1980 Incumbent re-elected.
Florida 23 Alcee Hastings Democratic 1992 Incumbent re-elected.
  • Green check.svgY Alcee Hastings (Democratic) 77.49%
  • Charles Laurie (Republican) 22.51%
Florida 24 None (District created)New district.
New member elected.
Republican gain.
  • Green check.svgY Tom Feeney (Republican) 61.84%
  • Harry Jacobs (Democratic) 38.16%
Florida 25 None (District created)New district.
New member elected.
Republican gain.

Georgia

The state gained two seats in reapportionment.

DistrictIncumbentThis race
MemberPartyFirst electedResultsCandidates
Georgia 1 Jack Kingston Republican 1992 Incumbent re-elected.
  • Green check.svgY Jack Kingston (Republican) 72.14%
  • Don Smart (Democratic) 27.86%
Georgia 2 Sanford Bishop Democratic 1992 Incumbent re-elected.
Georgia 3 Saxby Chambliss
Redistricted from the 8th district
Republican 1994 Incumbent retired to run for U.S. senator.
New member elected.
Democratic gain.
  • Green check.svgY Jim Marshall (Democratic) 50.51%
  • Calder Clay III (Republican) 49.49%
Georgia 4 Cynthia McKinney Democratic 1992 Incumbent lost renomination.
New member elected.
Democratic hold.
  • Green check.svgY Denise Majette (Democratic) 77.03%
  • Cynthia Van Auken (Republican) 22.97%
Georgia 5 John Lewis Democratic 1986 Incumbent re-elected.
Georgia 6 Johnny Isakson Republican 1999 (Special) Incumbent re-elected.
  • Green check.svgY Johnny Isakson (Republican) 79.87%
  • Jeff Weisberger (Democratic) 20.13%
Georgia 7 Bob Barr Republican 1994 Incumbent lost renomination.
Republican loss.
  • Green check.svgY John Linder (Republican) 78.92%
  • Michael Berlon (Democratic) 21.08%
John Linder
Redistricted from the 11th district
Republican 1992 Incumbent re-elected.
Georgia 8 Mac Collins
Redistricted from the 3rd district
Republican 1992 Incumbent re-elected.
  • Green check.svgY Mac Collins (Republican) 78.33%
  • Angelos Petrakopoulos (Democratic) 21.67%
Georgia 9 Charlie Norwood
Redistricted from the 10th district
Republican 1994 Incumbent re-elected.
  • Green check.svgY Charlie Norwood (Republican) 72.84%
  • Barry Gordon Irwin (Democratic) 27.16%
Georgia 10 Nathan Deal
Redistricted from the 9th district
Republican 1992 [lower-alpha 2] Incumbent re-elected.
Georgia 11 None (District created)New district.
New member elected.
Republican gain
  • Green check.svgY Phil Gingrey (Republican) 51.64%
  • Roger Kahn (Democratic) 48.36%
Georgia 12 None (District created)New district.
New member elected.
Republican gain.
  • Green check.svgY Max Burns (Republican) 55.19%
  • Charles "Champ" Walker (Democratic) 44.81%
Georgia 13 None (District created)New district.
New member elected.
Democratic gain.
  • Green check.svgY David Scott (Democratic) 59.63%
  • Clay Cox (Republican) 40.37%

Hawaii

DistrictIncumbentThis race
MemberPartyFirst electedResultsCandidates
Hawaii 1 Neil Abercrombie Democratic 1986 (Special)
1988 (Lost renomination)
1990
Incumbent re-elected.
  • Green check.svgY Neil Abercrombie (Democratic) 72.85%
  • Mark Terry (Republican) 24.92%
  • James Bracken (Libertarian) 2.23%
Hawaii 2 Patsy Mink Democratic 1964
1976 (Retired)
1990 (Special)
Incumbent died but was re-elected posthumously.
  • Green check.svgY Patsy Mink (Democratic) 56.16%
  • Bob McDermott (Republican) 39.98%
  • Jeff Mallan (Libertarian) 2.63%
  • Nicholas Bedworth (Natural Law) 1.23%

Idaho

DistrictIncumbentThis race
MemberPartyFirst electedResultsCandidates
Idaho 1 Butch Otter Republican 2000 Incumbent re-elected.
  • Green check.svgY Butch Otter (Republican) 58.57%
  • Betty Richardson (Democratic) 38.94%
  • Steve Gothard (Libertarian) 2.49%
Idaho 2 Mike Simpson Republican 1998 Incumbent re-elected.
  • Green check.svgY Mike Simpson (Republican) 68.18%
  • Edward Kinghorn (Democratic) 29.05%
  • John "Lack" Lewis (Libertarian) 2.77%

Illinois

The state lost one seat in reapportionment.

DistrictIncumbentThis race
MemberPartyFirst electedResultsCandidates
Illinois 1 Bobby Rush Democratic 1992 Incumbent re-elected.
Illinois 2 Jesse Jackson Jr. Democratic 1995 (Special) Incumbent re-elected.
Illinois 3 Bill Lipinski Democratic 1982 Incumbent re-elected.
Illinois 4 Luis Gutiérrez Democratic 1992 Incumbent re-elected.
  • Green check.svgY Luis Gutiérrez (Democratic) 79.68%
  • Tony Lopez-Cisneros (Republican) 15.12%
  • Maggie Kohls (Libertarian) 5.20%
Illinois 5 Rod Blagojevich Democratic 1996 Incumbent retired to run for Governor of Illinois.
New member elected.
Democratic hold.
  • Green check.svgY Rahm Emanuel (Democratic) 66.81%
  • Mark Augusti (Republican) 28.86%
  • Frank Gonzalez (Libertarian) 4.34%
Illinois 6 Henry Hyde Republican 1974 Incumbent re-elected.
  • Green check.svgY Henry Hyde (Republican) 65.09%
  • Tom Berry (Democratic) 34.91%
Illinois 7 Danny K. Davis Democratic 1996 Incumbent re-elected.
  • Green check.svgY Danny K. Davis (Democratic) 83.21%
  • Mark Tunney (Republican) 15.25%
  • Martin Pankau (Libertarian) 1.53%
Illinois 8 Phil Crane Republican 1969 (Special) Incumbent re-elected.
Illinois 9 Jan Schakowsky Democratic 1998 Incumbent re-elected.
Illinois 10 Mark Kirk Republican 2000 Incumbent re-elected.
  • Green check.svgY Mark Kirk (Republican) 68.81%
  • Hank Perritt (Democratic) 31.19%
Illinois 11 Jerry Weller Republican 1994 Incumbent re-elected.
  • Green check.svgY Jerry Weller (Republican) 64.32%
  • Keith Van Duyne (Democratic) 35.68%
Illinois 12 Jerry Costello Democratic 1988 Incumbent re-elected.
  • Green check.svgY Jerry Costello (Democratic) 69.25%
  • David Sadler (Republican) 30.75%
Illinois 13 Judy Biggert Republican 1998 Incumbent re-elected.
  • Green check.svgY Judy Biggert (Republican) 70.26%
  • Thomas Mason (Democratic) 29.74%
Illinois 14 Dennis Hastert Republican 1986 Incumbent re-elected.
  • Green check.svgY Dennis Hastert (Republican) 74.14%
  • Laurence Quick (Democratic) 25.86%
Illinois 15 Tim Johnson Republican 2000 Incumbent re-elected.
  • Green check.svgY Tim Johnson (Republican) 65.2%
  • Joshua Hartke (Democratic) 31.0%
  • Carl Estabrook (Green) 3.8%
Illinois 16 Don Manzullo Republican 1992 Incumbent re-elected.
  • Green check.svgY Don Manzullo (Republican) 70.61%
  • John Kutsch (Democratic) 29.39%
Illinois 17 Lane Evans Democratic 1982 Incumbent re-elected.
  • Green check.svgY Lane Evans (Democratic) 62.42%
  • Peter Calderone (Republican) 37.58%
Illinois 18 Ray LaHood Republican 1994 Incumbent re-elected.
Illinois 19 David D. Phelps Democratic 1998 Incumbent lost re-election.
Democratic loss.
John Shimkus
Redistricted from the 20th district [5]
Republican 1996 Incumbent re-elected.

Indiana

The state lost one seat in reapportionment.

DistrictIncumbentThis race
MemberPartyFirst electedResultsCandidates
Indiana 1 Pete Visclosky Democratic 1984 Incumbent re-elected.
  • Green check.svgY Pete Visclosky (Democratic) 66.94%
  • Mark Leyva (Republican) 31.02%
  • Timothy Brennan (Libertarian) 2.04%
Indiana 2 Tim Roemer
Redistricted from the 3rd district
Democratic 1990 Incumbent retired.
New member elected.
Republican gain.
Indiana 3 Mark Souder
Redistricted from the 4th district
Republican 1994 Incumbent re-elected.
  • Green check.svgY Mark Souder (Republican) 63.14%
  • Jay Rigdon (Democratic) 34.45%
  • Mike Donlan (Libertarian) 2.41%
Indiana 4 Steve Buyer
Redistricted from the 5th district
Republican 1992 Incumbent re-elected.
  • Green check.svgY Steve Buyer (Republican) 71.36%
  • Bill Abbott (Democratic) 26.15%
  • Jerry Susong (Libertarian) 2.49%
Brian D. Kerns
Redistricted from the 7th district
Republican 2000 Incumbent lost renomination.
Republican loss.
Indiana 5 Dan Burton
Redistricted from the 6th district
Republican 1982 Incumbent re-elected.
  • Green check.svgY Dan Burton (Republican) 71.97%
  • Katherine Fox Carr (Democratic) 25.18%
  • Christopher Adkins (Libertarian) 2.85%
Indiana 6 Mike Pence
Redistricted from the 2nd district
Republican 2000 Incumbent re-elected.
  • Green check.svgY Mike Pence (Republican) 63.79%
  • Mel Fox (Democratic) 34.40%
  • Doris Robertson (Libertarian) 1.80%
Indiana 7 Julia Carson
Redistricted from the 10th district
Democratic 1996 Incumbent re-elected.
Indiana 8 John Hostettler Republican 1994 Incumbent re-elected.
  • Green check.svgY John Hostettler (Republican) 51.31%
  • Bryan Hartke (Democratic) 46.02%
  • Pam Williams (Libertarian) 2.67%
Indiana 9 Baron Hill Democratic 1998 Incumbent re-elected.
  • Green check.svgY Baron Hill (Democratic) 51.15%
  • Mike Sodrel (Republican) 46.13%
  • Jeff Melton (Green) 1.45%
  • Al Cox (Libertarian) 1.26%

Iowa

DistrictIncumbentThis race
MemberPartyFirst electedResultsCandidates
Iowa 1 Jim Nussle
Redistricted from the 2nd district
Republican 1990 Incumbent re-elected.
  • Green check.svgY Jim Nussle (Republican) 57.15%
  • Ann Hutchinson (Democratic) 42.65%
Iowa 2 Jim Leach
Redistricted from the 1st district
Republican 1976 Incumbent re-elected.
  • Green check.svgY Jim Leach (Republican) 52.19%
  • Julie Thomas (Democratic) 45.74%
  • Kevin Litten (Libertarian) 2.02%
Iowa 3 Leonard Boswell Democratic 1996 Incumbent re-elected.
  • Green check.svgY Leonard Boswell (Democratic) 53.41%
  • Stan Thompson (Republican) 45.04%
  • Jeffrey Smith (Libertarian) 1.24%
Iowa 4 Tom Latham
Redistricted from the 5th district
Republican 1994 Incumbent re-elected.
  • Green check.svgY Tom Latham (Republican) 54.76%
  • John Norris (Democratic) 43.07%
  • Terry Wilson (Libertarian) 1.40%
  • Jim Hennager (Libertarian) 0.73%
Iowa 5 Greg Ganske
Redistricted from the 4th district
Republican 1994 Incumbent retired to run for U.S. senator.
New member elected.
Republican hold.

Kansas

DistrictIncumbentThis race
MemberPartyFirst electedResultsCandidates
Kansas 1 Jerry Moran Republican 1996 Incumbent re-elected.
  • Green check.svgY Jerry Moran (Republican) 91.09%
  • Jack Warner (Libertarian) 8.91%
Kansas 2 Jim Ryun Republican 1996 Incumbent re-elected.
  • Green check.svgY Jim Ryun (Republican) 60.42%
  • Dan Lykins (Democratic) 37.52%
  • Art Clack (Libertarian) 2.06%
Kansas 3 Dennis Moore Democratic 1998 Incumbent re-elected.
  • Green check.svgY Dennis Moore (Democratic) 50.18%
  • Adam Taff (Republican) 46.89%
  • Dawn Bly (Ref.) 2.30%
  • Douglas Martin (Libertarian) 0.62%
Kansas 4 Todd Tiahrt Republican 1994 Incumbent re-elected.
  • Green check.svgY Todd Tiahrt (Republican) 60.58%
  • Carlos Nolla (Democratic) 37.00%
  • Maike Warren (Libertarian) 2.42%

Kentucky

DistrictIncumbentThis race
MemberPartyFirst electedResultsCandidates
Kentucky 1 Ed Whitfield Republican 1994 Incumbent re-elected.
  • Green check.svgY Ed Whitfield (Republican) 62.25%
  • Klint Alexander (Democratic) 34.75%
Kentucky 2 Ron Lewis Republican 1994 Incumbent re-elected.
  • Green check.svgY Ron Lewis (Republican) 69.64%
  • David Williams (Democratic) 29.17%
  • Robert Guy Dyer (Libertarian) 1.18%
Kentucky 3 Anne Northup Republican 1996 Incumbent re-elected.
Kentucky 4 Ken Lucas Democratic 1998 Incumbent re-elected.
  • Green check.svgY Ken Lucas (Democratic) 51.11%
  • Geoff Davis (Republican) 47.54%
  • John Grote (Libertarian) 1.34%
Kentucky 5 Hal Rogers Republican 1980 Incumbent re-elected.
  • Green check.svgY Hal Rogers (Republican) 78.29%
  • Sidney Jane Bailey (Democratic) 21.71%
Kentucky 6 Ernie Fletcher Republican 1998 Incumbent re-elected.

Louisiana

DistrictIncumbentThis race
MemberPartyFirst electedResultsCandidates
Louisiana 1 David Vitter Republican 1999 (Special) Incumbent re-elected.
  • Green check.svgY David Vitter (Republican) 81.47%
  • Monica Monica (Republican) 11.22%
  • Robert Namer (Republican) 4.00%
  • Ian Hawxhurst (Libertarian) 3.30%
Louisiana 2 William J. Jefferson Democratic 1990 Incumbent re-elected.
  • Green check.svgY William J. Jefferson (Democratic) 63.53%
  • Irma Muse Dixon (Democratic) 20.03%
  • Silky Sullivan (Republican) 10.86%
  • Clarence "Buddy" Hunt (Democratic) 2.91%
  • Wayne Clement (Libertarian) 2.67%
Louisiana 3 Billy Tauzin Republican 1980 [lower-alpha 3] Incumbent re-elected.
  • Green check.svgY Billy Tauzin (Republican) 86.68%
  • William Beier (Libertarian) 8.62%
  • David Iwancio (Independent) 4.69%
Louisiana 4 Jim McCrery Republican 1988 Incumbent re-elected.
Louisiana 5 John Cooksey Republican 1996 Incumbent retired to run for senator.
New member elected.
Democratic gain.
Louisiana 6 Richard Baker Republican 1986 Incumbent re-elected.
  • Green check.svgY Richard Baker (Republican) 84.04%
  • Rick Moscatello (Libertarian) 15.96%
Louisiana 7 Chris John Democratic 1996 Incumbent re-elected.
  • Green check.svgY Chris John (Democratic) 86.82%
  • Michael Harris (Independent) 13.18%

Maine

DistrictIncumbentThis race
MemberPartyFirst electedResultsCandidates
Maine 1 Tom Allen Democratic 1996 Incumbent re-elected.
Maine 2 John Baldacci Democratic 1994 Incumbent retired to run for Governor of Maine.
New member elected.
Democratic hold.

Maryland

DistrictIncumbentThis race
MemberPartyFirst electedResultsCandidates
Maryland 1 Wayne Gilchrest Republican 1990 Incumbent re-elected.
Maryland 2 Robert Ehrlich Republican 1994 Incumbent retired to run for Governor of Maryland.
New member elected.
Democratic gain.
Maryland 3 Ben Cardin Democratic 1986 Incumbent re-elected.
  • Green check.svgY Ben Cardin (Democratic) 65.72%
  • Scott Conwell (Republican) 34.18%
Maryland 4 Albert Wynn Democratic 1992 Incumbent re-elected.
  • Green check.svgY Albert Wynn (Democratic) 78.57%
  • John Kimble (Republican) 20.82%
Maryland 5 Steny Hoyer Democratic 1981 (Special) Incumbent re-elected.
  • Green check.svgY Steny Hoyer (Democratic) 69.27%
  • Joseph Crawford (Republican) 30.52%
Maryland 6 Roscoe Bartlett Republican 1992 Incumbent re-elected.
  • Green check.svgY Roscoe Bartlett (Republican) 66.11%
  • Donald DeArmon (Democratic) 33.80%
Maryland 7 Elijah Cummings Democratic 1996 Incumbent re-elected.
Maryland 8 Connie Morella Republican 1986 Incumbent lost re-election.
New member elected.
Democratic gain.

Massachusetts

DistrictIncumbentThis race
MemberPartyFirst electedResultsCandidates
Massachusetts 1 John Olver Democratic 1991 (Special) Incumbent re-elected.
  • Green check.svgY John Olver (Democratic) 67.56%
  • Matthew Kinnaman (Republican) 32.38%
Massachusetts 2 Richard Neal Democratic 1988 Incumbent re-elected.
Massachusetts 3 Jim McGovern Democratic 1996 Incumbent re-elected.
Massachusetts 4 Barney Frank Democratic 1980 Incumbent re-elected.
Massachusetts 5 Marty Meehan Democratic 1992 Incumbent re-elected.
  • Green check.svgY Marty Meehan (Democratic) 60.15%
  • Charles McCarthy (Republican) 34.03%
  • Ilana Freedman (Libertarian) 5.76%
Massachusetts 6 John F. Tierney Democratic 1996 Incumbent re-elected.
  • Green check.svgY John F. Tierney (Democratic) 68.27%
  • Mark C. Smith (Republican) 31.63%
Massachusetts 7 Ed Markey Democratic 1976 Incumbent re-elected.
Massachusetts 8 Mike Capuano Democratic 1998 Incumbent re-elected.
Massachusetts 9 Stephen F. Lynch Democratic 2001 (Special) Incumbent re-elected.
Massachusetts 10 Bill Delahunt Democratic 1996 Incumbent re-elected.
  • Green check.svgY Bill Delahunt (Democratic) 69.20%
  • Luis Gonzaga (Republican) 30.74%

Michigan

The state lost one seat in reapportionment.

DistrictIncumbentThis race
MemberPartyFirst electedResultsCandidates
Michigan 1 Bart Stupak Democratic 1992 Incumbent re-elected.
  • Green check.svgY Bart Stupak (Democratic) 67.67%
  • Don Hooper (Republican) 31.10%
  • John W. Loosemore (Libertarian) 1.23%
Michigan 2 Pete Hoekstra Republican 1992 Incumbent re-elected.
  • Green check.svgY Pete Hoekstra (Republican) 70.40%
  • Jeffrey Wrisley (Democratic) 27.70%
  • Laurie Aleck (Libertarian) 1.20%
Michigan 3 Vern Ehlers Republican 1993 (Special) Incumbent re-elected.
  • Green check.svgY Vern Ehlers (Republican) 69.97%
  • Kathryn Lynnes (Democratic) 28.32%
  • Tom Quinn (Libertarian) 1.19%
  • Richard Lucey (Reform) 0.51%
Michigan 4 Dave Camp Republican 1990 Incumbent re-elected.
  • Green check.svgY Dave Camp (Republican) 68.21%
  • Lawrence Hollenbeck (Democratic) 30.17%
  • Sterling Johnson (Green) 1.03%
  • Albert Chia Jr. (Libertarian) 0.58%
Michigan 5 James A. Barcia Democratic 1992 Incumbent retired to run for state senator.
Democratic loss.
  • Green check.svgY Dale E. Kildee (Democratic) 91.56%
  • Clint Foster (Libertarian) 5.39%
  • Harley Mikkelson (Green) 2.99%
Dale E. Kildee
Redistricted from the 9th district
Democratic 1976 Incumbent re-elected.
Michigan 6 Fred Upton Republican 1986 Incumbent re-elected.
  • Green check.svgY Fred Upton (Republican) 69.17%
  • Gary Giguere Jr. (Democratic) 29.31%
  • Harley Mikkelson (Reform) 1.52%
Michigan 7 Nick Smith Republican 1992 Incumbent re-elected.
  • Green check.svgY Nick Smith (Republican) 59.66%
  • Mike Simpson (Democratic) 38.61%
  • Kenneth L. Proctor (Libertarian) 1.73%
Michigan 8 Mike Rogers Republican 2000 Incumbent re-elected.
  • Green check.svgY Mike Rogers (Republican) 67.88%
  • Frank D. McAlpine (Democratic) 30.75%
  • Thomas Yeutter (Libertarian) 1.37%
Michigan 9 Joe Knollenberg
Redistricted from the 11th district
Republican 1992 Incumbent re-elected.
  • Green check.svgY Joe Knollenberg (Republican) 58.10%
  • David Fink (Democratic) 39.88%
  • Robert W. Schubring (Libertarian) 2.03%
Michigan 10 David Bonior Democratic 1976 Incumbent retired to run for Governor of Michigan.
New member elected.
Republican gain.
  • Green check.svgY Candice Miller (Republican) 63.31%
  • Carl Marlinga (Democratic) 35.52%
  • Renae Coon (Democratic) 1.17%
Michigan 11 None (District created)New district.
New member elected.
Republican gain.
  • Green check.svgY Thad McCotter (Republican) 57.19%
  • Kevin Kelley (Democratic) 39.66%
  • William Boyd (Green) 1.93%
  • Dan Malone (US Taxpayers) 1.23%
Michigan 12 Sander Levin Democratic 1982 Incumbent re-elected.
  • Green check.svgY Sander Levin (Democratic) 68.26%
  • Harvey Dean (Republican) 29.78%
  • Dick Gach (Libertarian) 1.30%
  • Steven Revis (US Taxpayers) 0.66%
Michigan 13 Carolyn Cheeks Kilpatrick
Redistricted from the 15th district
Democratic 1996 Incumbent re-elected.
Michigan 14 John Conyers Democratic 1964 Incumbent re-elected.
  • Green check.svgY John Conyers (Democratic) 83.21%
  • Dave Stone (Republican) 15.20%
  • Francis Schorr (Libertarian) 0.88%
  • John D. Litle (Green) 0.71%
Michigan 15 John Dingell
Redistricted from the 16th district
Democratic 1955 (Special) Incumbent re-elected.
  • Green check.svgY John Dingell (Democratic) 72.21%
  • Martin Kaltenbach (Republican) 25.72%
  • Gregory Scott Stempfle (Libertarian) 2.07%
Lynn N. Rivers
Redistricted from the 13th district
Democratic 1994 Incumbent lost renomination.
Democratic loss.

Minnesota

DistrictIncumbentThis race
MemberPartyFirst electedResultsCandidates
Minnesota 1 Gil Gutknecht Republican 1994 Incumbent re-elected.
  • Green check.svgY Gil Gutknecht (Republican) 61.50%
  • Steve Andreasen (DFL) 34.65%
  • Greg Mikkelson (Green) 3.75%
Minnesota 2 Bill Luther
Redistricted from the 6th district
DFL 1994 Incumbent lost re-election.
New member elected.
Republican gain.
Minnesota 3 Jim Ramstad Republican 1990 Incumbent re-elected.
  • Green check.svgY Jim Ramstad (Republican) 72.02%
  • Darryl Stanton (DFL) 27.88%
Minnesota 4 Betty McCollum DFL 2000 Incumbent re-elected.
  • Green check.svgY Betty McCollum (DFL) 62.22%
  • Clyde Billington (Republican) 33.91%
  • Scott Raskiewicz (Green) 3.75%
Minnesota 5 Martin Olav Sabo DFL 1978 Incumbent re-elected.
  • Green check.svgY Martin Olav Sabo (DFL) 67.03%
  • Daniel Mathias (Republican) 25.89%
  • Tim Davis (Green) 6.96%
Minnesota 6 Mark Kennedy
Redistricted from the 2nd district
Republican 2000 Incumbent re-elected.
  • Green check.svgY Mark Kennedy (Republican) 57.34%
  • Janet Robert (DFL) 35.06%
  • Dan Becker (Independence) 7.48%
Minnesota 7 Collin Peterson DFL 1990 Incumbent re-elected.
Minnesota 8 Jim Oberstar DFL 1974 Incumbent re-elected.
  • Green check.svgY Jim Oberstar (DFL) 68.65%
  • Bob Lemen (Republican) 31.23%

Mississippi

The state lost one seat in reapportionment.

DistrictIncumbentThis race
MemberPartyFirst electedResultsCandidates
Mississippi 1 Roger Wicker Republican 1994 Incumbent re-elected.
  • Green check.svgY Roger Wicker (Republican) 71.43%
  • Rex Weathers (Democratic) 24.20%
  • Brenda Blackburn (Reform) 2.60%
  • Harold Taylor (Libertarian) 1.77%
Mississippi 2 Bennie Thompson Democratic 1993 (Special) Incumbent re-elected.
Mississippi 3 Chip Pickering Republican 1996 Incumbent re-elected.
  • Green check.svgY Chip Pickering (Republican) 63.76%
  • Ronnie Shows (Democratic) 34.76%
  • Jim Giles (Independent) 0.65%
  • Harvey Darden (Independent) 0.43%
  • Brad McDonald (Libertarian) 0.35%
  • Carroll Grantham (Reform) 0.23%
Ronnie Shows
Redistricted from the 4th district
Democratic 1998 Incumbent lost re-election.
Democratic loss.
Mississippi 4 Gene Taylor
Redistricted from the 5th district
Democratic 1989 (Special) Incumbent re-elected.
  • Green check.svgY Gene Taylor (Democratic) 75.21%
  • Karl Mertz (Republican) 21.24%
  • Wayne Parker (Libertarian) 2.05%
  • Thomas Huffmaster (Reform) 1.51%

Missouri

DistrictIncumbentThis race
MemberPartyFirst electedResultsCandidates
Missouri 1 Lacy Clay Democratic 2000 Incumbent re-elected.
  • Green check.svgY Lacy Clay (Democratic) 70.11%
  • Richard Schwadron (Republican) 27.09%
  • Jim Higgins (Libertarian) 2.80%
Missouri 2 Todd Akin Republican 2000 Incumbent re-elected.
  • Green check.svgY Todd Akin (Republican) 67.14%
  • John Hogan (Democratic) 31.03%
  • Darla Maloney (Libertarian) 1.83%
Missouri 3 Dick Gephardt Democratic 1976 Incumbent re-elected.
Missouri 4 Ike Skelton Democratic 1976 Incumbent re-elected.
  • Green check.svgY Ike Skelton (Democratic) 67.64%
  • Jim Noland (Republican) 30.66%
  • Daniel Roy Nelson (Libertarian) 1.70%
Missouri 5 Karen McCarthy Democratic 1994 Incumbent re-elected.
  • Green check.svgY Karen McCarthy (Democratic) 65.88%
  • Steve Gordon (Republican) 32.36%
  • Jeanne Bojarski (Libertarian) 1.76%
Missouri 6 Sam Graves Republican 2000 Incumbent re-elected.
  • Green check.svgY Sam Graves (Republican) 63.03%
  • Cathy Rinehart (Democratic) 35.18%
  • Erik Buck (Libertarian) 1.79%
Missouri 7 Roy Blunt Republican 1996 Incumbent re-elected.
  • Green check.svgY Roy Blunt (Republican) 74.81%
  • Ron Lapham (Democratic) 23.00%
  • Doug Burlison (Libertarian) 2.19%
Missouri 8 Jo Ann Emerson Republican 1996 Incumbent re-elected.
  • Green check.svgY Jo Ann Emerson (Republican) 71.76%
  • Gene Curtis (Democratic) 26.91%
  • Eric Van Oostrom (Libertarian) 1.32%
Missouri 9 Kenny Hulshof Republican 1996 Incumbent re-elected.
  • Green check.svgY Kenny Hulshof (Republican) 68.20%
  • Don Deichman (Democratic) 28.55%
  • Keith Brekhus (Green) 1.99%
  • John Mruzik (Libertarian) 1.26%

Montana

DistrictIncumbentThis race
MemberPartyFirst electedResultsCandidates
Montana at-large Denny Rehberg Republican 2000 Incumbent re-elected.
  • Green check.svgY Denny Rehberg (Republican) 64.62%
  • Steve Kelly (Democratic) 32.67%
  • Mike Fellows (Libertarian) 2.71%

Nebraska

DistrictIncumbentThis race
MemberPartyFirst electedResultsCandidates
Nebraska 1 Doug Bereuter Republican 1978 Incumbent re-elected.
  • Green check.svgY Doug Bereuter (Republican) 85.35%
  • Robert Eckerson (Libertarian) 14.65%
Nebraska 2 Lee Terry Republican 1998 Incumbent re-elected.
  • Green check.svgY Lee Terry (Republican) 63.32%
  • Jim Simon (Democratic) 32.98%
  • Doug Paterson (Green) 2.28%
  • Dave Stock (Libertarian) 1.42%
Nebraska 3 Tom Osborne Republican 2000 Incumbent re-elected.
  • Green check.svgY Tom Osborne (Republican) 93.17%
  • Jerry Hickman (Libertarian) 6.83%

Nevada

DistrictIncumbentThis race
MemberPartyFirst electedResultsCandidates
Nevada 1 Shelley Berkley Democratic 1998 Incumbent re-elected.
  • Green check.svgY Shelley Berkley (Democratic) 53.72%
  • Lynette Boggs-McDonald (Republican) 42.73%
  • Steven Dempsey (Independent American) 2.39%
  • W. Lane Startin (Green) 1.16%
Nevada 2 Jim Gibbons Republican 1996 Incumbent re-elected.
  • Green check.svgY Jim Gibbons (Republican) 74.3%
  • Travis Souza (Democratic) 19.97%
  • Janine Hansen (Independent American) 3.60%
  • Brendan Trainor (Libertarian) 1.70%
  • Robert Winquist (Natural Law) 0.39%
Nevada 3 None (District created)New district.
New member elected.
Republican gain.
  • Green check.svgY Jon Porter (Republican) 56.08%
  • Dario Herrera (Democratic) 37.24%
  • Pete O'Neil (Independent) 3.82%
  • Neil Scott (Libertarian) 1.91%
  • Dick O'Dell (Independent American) 0.95%

New Hampshire

DistrictIncumbentThis race
MemberPartyFirst electedResultsCandidates
New Hampshire 1 John E. Sununu Republican 1996 Incumbent retired to run for U.S. senator.
New member elected.
Republican hold.
New Hampshire 2 Charlie Bass Republican 1994 Incumbent re-elected.

New Jersey

DistrictIncumbentThis race
MemberPartyFirst electedResultsCandidates
New Jersey 1 Rob Andrews Democratic 1990 Incumbent re-elected.
  • Green check.svgY Rob Andrews (Democratic) 92.74%
  • Timothy Haas (Libertarian) 7.26%
New Jersey 2 Frank LoBiondo Republican 1994 Incumbent re-elected.
  • Green check.svgY Frank LoBiondo (Republican) 69.21%
  • Steven Farkas (Democratic) 28.28%
  • Roger Merle (Green) 1.03%
  • Michael J. Matthews (Libertarian) 1.02%
  • Constantino Rozzo (Socialist) 0.46%
New Jersey 3 Jim Saxton Republican 1984 Incumbent re-elected.
  • Green check.svgY Jim Saxton (Republican) 65.02%
  • Richard Strada (Democratic) 33.92%
Others
  • Raymond Byrne (Libertarian) 0.70%
  • Ken Feduniewicz (America First) 0.35%
New Jersey 4 Chris Smith Republican 1980 Incumbent re-elected.
  • Green check.svgY Chris Smith (Republican) 66.15%
  • Mary Brennan (Democratic) 32.11%
Others
  • Keith Quarles (Libertarian) 0.69%
  • Hermann Winkelmann (Independent) 0.61%
  • Don Graham (Conservative) 0.44%
New Jersey 5 Marge Roukema Republican 1980 Incumbent retired.
New member elected.
Republican hold.
  • Green check.svgY Scott Garrett (Republican) 59.48%
  • Anne Sumers (Democratic) 38.28%
  • Michael Cino (Independent) 2.23%
New Jersey 6 Frank Pallone Democratic 1988 Incumbent re-elected.
  • Green check.svgY Frank Pallone (Democratic) 66.46%
  • Ric Medrow (Republican) 30.89%
  • Richard Strong (Green) 1.32%
Others
  • Barry Allen (Libertarian) 0.88%
  • Mac Dara F. X. Lyden (Independent) 0.45%
New Jersey 7 Mike Ferguson Republican 2000 Incumbent re-elected.
  • Green check.svgY Mike Ferguson (Republican) 57.95%
  • Tim Carden (Democratic) 40.92%
  • Darren Young (Libertarian) 1.13%
New Jersey 8 Bill Pascrell Democratic 1996 Incumbent re-elected.
  • Green check.svgY Bill Pascrell (Democratic) 66.83%
  • Jared Silverman (Republican) 30.59%
  • Joseph Fortunato (Green) 2.58%
New Jersey 9 Steve Rothman Democratic 1996 Incumbent re-elected.
  • Green check.svgY Steve Rothman (Democratic) 69.76%
  • Joseph Glass (Republican) 30.24%
New Jersey 10 Donald M. Payne Democratic 1988 Incumbent re-elected.
  • Green check.svgY Donald M. Payne (Democratic) 84.45%
  • Andrew Wirtz (Republican) 15.55%
New Jersey 11 Rodney Frelinghuysen Republican 1994 Incumbent re-elected.
  • Green check.svgY Rodney Frelinghuysen (Republican) 72.38%
  • Vij Pawar (Democratic) 26.39%
  • Richard S. Roth (Libertarian) 1.23%
New Jersey 12 Rush Holt Jr. Democratic 1998 Incumbent re-elected.
Others
  • Thomas Abrams (Libertarian) 0.73%
  • Karen Anne Zaletel (Conservative) 0.49%
New Jersey 13 Bob Menendez Democratic 1992 Incumbent re-elected.
  • Green check.svgY Bob Menendez (Democratic) 78.30%
  • James Geron (Republican) 18.17%
  • Pat Henry Faulkner (Green) 1.29%
Others
  • Esmat Zaklama (Independent) 0.83%
  • Dick Hester (Independent) 0.79%
  • Herbert H. Shaw (Independent) 0.62%

New Mexico

DistrictIncumbentThis race
MemberPartyFirst electedResultsCandidates
New Mexico 1 Heather Wilson Republican 1998 Incumbent re-elected.
New Mexico 2 Joe Skeen Republican 1980 Incumbent retired.
New member elected.
Republican hold.
New Mexico 3 Tom Udall Democratic 1998 Incumbent re-elected.

New York

The state lost two seats in reapportionment.

DistrictIncumbentThis race
MemberPartyFirst electedResultsCandidates
New York 1 Felix Grucci Republican 2000 Incumbent lost re-election.
New member elected.
Democratic gain.
New York 2 Steve Israel Democratic 2000 Incumbent re-elected.
  • Green check.svgY Steve Israel (Democratic) 58.48%
  • Joseph Finley (Republican) 40.46%
  • John Keenan (Green) 1.07%
New York 3 Peter King Republican 1992 Incumbent re-elected.
  • Green check.svgY Peter King (Republican) 71.88%
  • Stuart Finz (Democratic) 27.22%
  • Janeen DePrima (Liberal) 0.89%
New York 4 Carolyn McCarthy Democratic 1996 Incumbent re-elected.
  • Green check.svgY Carolyn McCarthy (Democratic) 56.25%
  • Marilyn F. O'Grady (Republican) 43.24%
  • Tim Derham (Green) 0.51%
New York 5 Gary Ackerman Democratic 1983 (Special) Incumbent re-elected.
  • Green check.svgY Gary Ackerman (Democratic) 68%
  • Perry Reich (Conservative) 7.68%
New York 6 Gregory Meeks Democratic 1998 Incumbent re-elected.
  • Green check.svgY Gregory Meeks (Democratic) 96.51%
  • Rey Clarke (Independence) 3.49%
New York 7 Joseph Crowley Democratic 1998 Incumbent re-elected.
  • Green check.svgY Joseph Crowley (Democratic) 73.29%
  • Kevin Brawley (Republican) 26.71%
New York 8 Jerry Nadler Democratic 1992 Incumbent re-elected.
  • Green check.svgY Jerry Nadler (Democratic) 76.07%
  • Jim Farrin (Republican) 18.48%
  • Alan Jay Gerber (Conservative) 3.16%
  • Dan Wentzel (Green) 1.80%
  • Joseph Dobrian (Libertarian) 0.49%
New York 9 Anthony Weiner Democratic 1998 Incumbent re-elected.
  • Green check.svgY Anthony Weiner (Democratic) 65.71%
  • Alfred F. Donohue Jr. (Republican) 34.29%
New York 10 Edolphus Towns Democratic 1982 Incumbent re-elected.
  • Green check.svgY Edolphus Towns (Democratic) 97.83%
  • Herbert F. Ryan (Republican) 2.17%
New York 11 Major Owens Democratic 1982 Incumbent re-elected.
  • Green check.svgY Major Owens (Democratic) 86.56%
  • Susan Cleary (Republican) 12.55%
  • Alice Gaffney (Conservative) 0.90%
New York 12 Nydia Velázquez Democratic 1992 Incumbent re-elected.
New York 13 Vito Fossella Republican 1997 (Special) Incumbent re-elected.
  • Green check.svgY Vito Fossella (Republican) 69.63%
  • Arne Mattsson (Democratic) 28.32%
  • Anita Lerman (Independence) 1.38%
  • Henry Bardel (Green) 0.67%
New York 14 Carolyn Maloney Democratic 1992 Incumbent re-elected.
  • Green check.svgY Carolyn Maloney (Democratic) 75.25%
  • Anton Srdanovic (Republican) 24.75%
New York 15 Charles Rangel Democratic 1970 Incumbent re-elected.
  • Green check.svgY Charles Rangel (Democratic) 88.46%
  • Jessie A. Fields (Republican) 11.54%
New York 16 José E. Serrano Democratic 1990 Incumbent re-elected.
  • Green check.svgY José E. Serrano (Democratic) 92.07%
  • Frank Della Valle (Republican) 7.93%
New York 17 Eliot Engel Democratic 1988 Incumbent re-elected.
  • Green check.svgY Eliot Engel (Democratic) 62.61%
  • Scott Vanderhoef (Republican) 34.43%
  • Arthur Gallagher (Right to Life) 1%
  • Elizabeth Shanklin (Green) 1.41%
New York 18 Nita Lowey Democratic 1988 Incumbent re-elected.
  • Green check.svgY Nita Lowey (Democratic) 92.04%
  • Michael J. Reynolds (Right to Life) 7.96%
New York 19 Sue Kelly Republican 1994 Incumbent re-elected.
  • Sue Kelly (Republican) 69.97%
  • Janine Selendy (Democratic) 25.98%
  • Christine Tighe (Right to Life) 2.53%
  • Jonathan Wright (Green) 1.53%
Benjamin Gilman
Redistricted from the 20th district
Republican 1972 Incumbent retired.
Republican loss.
New York 20 John E. Sweeney
Redistricted from the 22nd district
Republican 1998 Incumbent re-elected.
  • Green check.svgY John E. Sweeney (Republican) 73.32%
  • Frank Stoppenbach (Democratic) 23.98%
  • Margaret Lewis (Green) 2.70%
New York 21 Michael McNulty Democratic 1988 Incumbent re-elected.
  • Green check.svgY Michael McNulty (Democratic) 75.09%
  • Charles Rosenstein (Republican) 24.91%
New York 22 Maurice Hinchey
Redistricted from the 26th district
Democratic 1992 Incumbent re-elected.
  • Green check.svgY Maurice Hinchey (Democratic) 64.19%
  • Eric Hall (Republican) 32.87%
  • Steven Greenfield (Green) 1.54%
  • Paul Laux (Right to Life) 1.40%
New York 23 John M. McHugh
Redistricted from the 24th district
Republican 1992 Incumbent re-elected.
New York 24 Sherwood Boehlert
Redistricted from the 23rd district
Republican 1982 Incumbent re-elected.
  • Green check.svgY Sherwood Boehlert (Republican) 70.70%
  • David L. Walrath (Conservative) 21.59%
  • Mark Dunau (Green) 4.36%
  • Kathleen Peters (Right to Life) 3.34%
New York 25 James T. Walsh Republican 1988 Incumbent re-elected.
  • Green check.svgY James T. Walsh (Republican) 72.29%
  • Stephanie Aldersley (Democratic) 26.64%
  • Francis Gavin (Green) 1.07%
New York 26 Thomas M. Reynolds
Redistricted from the 27th district
Republican 1998 Incumbent re-elected.
  • Green check.svgY Thomas M. Reynolds (Republican) 73.63%
  • Ayesha Nariman (Democratic) 22.42%
  • Shawn Harris (Right to Life) 2.23%
  • Paul Fallon (Green) 1.71%
New York 27 Jack Quinn
Redistricted from the 30th district
Republican 1992 Incumbent re-elected.
  • Green check.svgY Jack Quinn (Republican) 69.06%
  • Peter Crotty (Democratic) 27.49%
  • Thomas Casey (Right to Life) 2.06%
  • Albert LaBruna (Green) 1.38%
New York 28 Louise Slaughter Democratic 1986 Incumbent re-elected.
John LaFalce
Redistricted from the 29th district
Democratic 1974 Incumbent retired.
Democratic loss.
New York 29 Amo Houghton
Redistricted from the 31st district
(now obsolete)
Republican 1986 Incumbent re-elected.
  • Green check.svgY Amo Houghton (Republican) 73.10%
  • Kisun Peters (Democratic) 21.26%
  • Wendy Johnson (Right to Life) 3.34%
  • Rachel Treichler (Green) 2.30%

North Carolina

The state gained one seat in reapportionment.

DistrictIncumbentThis race
MemberPartyFirst electedResultsCandidates
North Carolina 1 Eva Clayton Democratic 1992 Incumbent retired.
New member elected.
Democratic hold.
  • Green check.svgY Frank Ballance (Democratic) 63.74%
  • Greg Dority (Republican) 34.83%
  • Mike Ruff (Libertarian) 1.43%
North Carolina 2 Bob Etheridge Democratic 1996 Incumbent re-elected.
  • Green check.svgY Bob Etheridge (Democratic) 65.36%
  • Joseph Ellen (Republican) 33.27%
  • Gary Minter (Libertarian) 1.37%
North Carolina 3 Walter B. Jones Jr. Republican 1994 Incumbent re-elected.
North Carolina 4 David Price Democratic 1986
1994 (defeated)
1996
Incumbent re-elected.
  • Green check.svgY David Price (Democratic) 61.18%
  • Tuan Nguyen (Republican) 36.15%
  • Ken Nelson (Libertarian) 2.67%
North Carolina 5 Richard Burr Republican 1994 Incumbent re-elected.
  • Green check.svgY Richard Burr (Republican) 70.19%
  • David Crawford (Democratic) 29.81%
North Carolina 6 Howard Coble Republican 1984 Incumbent re-elected.
  • Green check.svgY Howard Coble (Republican) 90.41%
  • Tara Grubb (Libertarian) 9.59%
North Carolina 7 Mike McIntyre Democratic 1996 Incumbent re-elected.
  • Green check.svgY Mike McIntyre (Democratic) 71.13%
  • James Adams (Republican) 27.32%
  • David Michael Brooks (Libertarian) 1.54%
North Carolina 8 Robin Hayes Republican 1998 Incumbent re-elected.
  • Green check.svgY Robin Hayes (Republican) 53.63%
  • Chris Kouri (Democratic) 44.62%
  • Mark Andrew Johnson (Libertarian) 1.75%
North Carolina 9 Sue Myrick Republican 1994 Incumbent re-elected.
  • Green check.svgY Sue Myrick (Republican) 72.42%
  • Ed McGuire (Democratic) 25.83%
  • Christopher Cole (Libertarian) 1.74%
North Carolina 10 Cass Ballenger Republican 1986 Incumbent re-elected.
  • Green check.svgY Cass Ballenger (Republican) 59.30%
  • Ron Daugherty (Democratic) 37.85%
  • Christopher M. Hill (Libertarian) 2.85%
North Carolina 11 Charles H. Taylor Republican 1990 Incumbent re-elected.
  • Green check.svgY Charles H. Taylor (Republican) 55.54%
  • Sam Neill (Democratic) 42.85%
  • Eric Henry (Libertarian) 1.61%
North Carolina 12 Mel Watt Democratic 1992 Incumbent re-elected.
  • Green check.svgY Mel Watt (Democratic) 65.34%
  • Jeff Kish (Republican) 32.79%
  • Carey Head (Libertarian) 1.98%
North Carolina 13 None (District created)New district.
New member elected.
Democratic gain.
  • Green check.svgY Brad Miller (Democratic) 54.72%
  • Carolyn Grant (Republican) 42.39%
  • Alex MacDonald (Libertarian) 2.89%

North Dakota

DistrictIncumbentThis race
MemberPartyFirst electedResultsCandidates
North Dakota at-large Earl Pomeroy Democratic-NPL 1992 Incumbent re-elected.

Ohio

The state lost one seat in reapportionment.

DistrictIncumbentThis race
MemberPartyFirst electedResultsCandidates
Ohio 1 Steve Chabot Republican 1994 Incumbent re-elected.
Ohio 2 Rob Portman Republican 1993 (Special) Incumbent re-elected.
Ohio 3 Tony P. Hall Democratic 1978 Incumbent retired.
New member elected.
Republican gain.
  • Green check.svgY Mike Turner (Republican) 58.77%
  • Richard Carne (Democratic) 41.22%
Ohio 4 Mike Oxley Republican 1981 (Special) Incumbent re-elected.
  • Green check.svgY Mike Oxley (Republican) 67.52%
  • Jim Clark (Democratic) 32.48%
Ohio 5 Paul Gillmor Republican 1988 Incumbent re-elected.
  • Green check.svgY Paul Gillmor (Republican) 67.08%
  • Roger C. Anderson (Democratic) 27.55%
  • John Green (Independent) 5.36%
Ohio 6 Ted Strickland Democratic 1992
1994 (defeated)
1996
Incumbent re-elected.
  • Green check.svgY Ted Strickland (Democratic) 59.48%
  • Mike Halleck (Republican) 40.52%
Ohio 7 Dave Hobson Republican 1990 Incumbent re-elected.
Ohio 8 John Boehner Republican 1990 Incumbent re-elected.
Ohio 9 Marcy Kaptur Democratic 1982 Incumbent re-elected.
  • Green check.svgY Marcy Kaptur (Democratic) 73.99%
  • Ed Emery (Republican) 26.01%
Ohio 10 Dennis Kucinich Democratic 1996 Incumbent re-elected.
  • Green check.svgY Dennis Kucinich (Democratic) 74.06%
  • Jon Heben (Republican) 23.80%
  • Judy Locy (Independent) 2.14%
Ohio 11 Stephanie Tubbs Jones Democratic 1998 Incumbent re-elected.
Ohio 12 Pat Tiberi Republican 2000 Incumbent re-elected.
Ohio 13 Sherrod Brown Democratic 1992 Incumbent re-elected.
  • Green check.svgY Sherrod Brown (Democratic) 68.97%
  • Ed Oliveros (Republican) 31.03%
Ohio 14 Steve LaTourette
Redistricted from the 19th district
Republican 1994 Incumbent re-elected.
  • Green check.svgY Steve LaTourette (Republican) 72.12%
  • Dale Virgil Blanchard (Democratic) 27.82%
Ohio 15 Deborah Pryce Republican 1992 Incumbent re-elected.
Ohio 16 Ralph Regula Republican 1972 Incumbent re-elected.
  • Green check.svgY Ralph Regula (Republican) 68.87%
  • Jim Rice (Democratic) 31.13%
Ohio 17 VacantRep. Jim Traficant (D) expelled July 24, 2002, for criminal conviction.
New member elected.
Democratic hold.
Thomas C. Sawyer
Redistricted from the 14th district
Democratic 1986 Incumbent lost renomination.
Democratic loss.
Ohio 18 Bob Ney Republican 1994 Incumbent re-elected.
  • Green check.svgY Bob Ney (Republican)
  • Uncontested

Oklahoma

The state lost one seat in reapportionment.

DistrictIncumbentThis race
MemberPartyFirst electedResultsCandidates
Oklahoma 1 John Sullivan Republican 2002 Incumbent re-elected.
  • Green check.svgY John Sullivan (Republican) 55.62%
  • Doug Dodd (Democratic) 42.17%
  • Joe Cristiano (Independent) 2.21%
Oklahoma 2 Brad Carson Democratic 2000 Incumbent re-elected.
  • Green check.svgY Brad Carson (Democratic) 74.12%
  • Kent Pharaoh (Republican) 25.88%
Oklahoma 3 Wes Watkins Republican 1976
1990 (Retired)
1996
Incumbent retired.
Republican loss.
  • Green check.svgY Frank Lucas (Republican) 75.58%
  • Robert T. Murphy (Democratic) 24.42%
Frank Lucas
Redistricted from the 6th district
Republican 1994 Incumbent re-elected.
Oklahoma 4 J. C. Watts Republican 1994 Incumbent retired.
New member elected.
Republican hold.
  • Green check.svgY Tom Cole (Republican) 53.83%
  • Darryl Roberts (Democratic) 46.17%
Oklahoma 5 Ernest Istook Republican 1992 Incumbent re-elected.
  • Green check.svgY Ernest Istook (Republican) 62.23%
  • Lou Barlow (Democratic) 32.41%
  • Donna C. Davis (Independent) 5.37%

Oregon

DistrictIncumbentThis race
MemberPartyFirst electedResultsCandidates
Oregon 1 David Wu Democratic 1998 Incumbent re-elected.
  • Green check.svgY David Wu (Democratic) 62.69%
  • Jim Greenfield (Republican) 33.99%
  • Beth A. King (Libertarian) 3.21%
Oregon 2 Greg Walden Republican 1998 Incumbent re-elected.
Oregon 3 Earl Blumenauer Democratic 1996 Incumbent re-elected.
  • Green check.svgY Earl Blumenauer (Democratic) 66.75%
  • Sarah Seale (Republican) 26.73%
  • Walt Brown (Socialist) 2.80%
  • Kevin Jones (Libertarian) 2.00%
  • David Brownlow (Constitution) 2.49%
Oregon 4 Peter DeFazio Democratic 1986 Incumbent re-elected.
Oregon 5 Darlene Hooley Democratic 1996 Incumbent re-elected.

Pennsylvania

The state lost two seats in reapportionment.

DistrictIncumbentThis race
MemberPartyFirst electedResultsCandidates
Pennsylvania 1 Bob Brady Democratic 1998 Incumbent re-elected.
  • Green check.svgY Bob Brady (Democratic) 86.43%
  • Marie Delany (Republican) 12.45%
  • Mike Ewall (Green) 1.12%
Pennsylvania 2 Chaka Fattah Democratic 1994 Incumbent re-elected.
  • Green check.svgY Chaka Fattah (Democratic) 87.77%
  • Thomas Dougherty (Republican) 12.23%
Pennsylvania 3 Phil English
Redistricted from the 21st district
Republican 1994 Incumbent re-elected.
  • Green check.svgY Phil English (Republican) 77.67%
  • AnnDrea Benson (Green) 22.32%
Pennsylvania 4 Melissa Hart Republican 2000 Incumbent re-elected.
  • Green check.svgY Melissa Hart (Republican) 64.55%
  • Stevan Drobac (Democratic) 35.44%
Pennsylvania 5 John Peterson Republican 1996 Incumbent re-elected.
  • Green check.svgY John Peterson (Republican) 87.24%
  • Thomas A. Martin (Libertarian) 12.62%
Pennsylvania 6 None (District created)New district.
New member elected.
Republican gain.
Pennsylvania 7 Curt Weldon Republican 1986 Incumbent re-elected.
  • Green check.svgY Curt Weldon (Republican) 66.09%
  • Peter Lennon (Democratic) 33.91%
Pennsylvania 8 Jim Greenwood Republican 1992 Incumbent re-elected.
  • Green check.svgY Jim Greenwood (Republican) 62.58%
  • Timothy Reece (Democratic) 37.40%
Pennsylvania 9 Bill Shuster Republican 2001 (Special) Incumbent re-elected.
  • Green check.svgY Bill Shuster (Republican) 71.02%
  • John R. Henry (Democratic) 28.92%
Pennsylvania 10 Don Sherwood Republican 1998 Incumbent re-elected.
  • Green check.svgY Don Sherwood (Republican) 92.60%
  • Kurt Shotko (Green) 7.07%
Pennsylvania 11 Paul Kanjorski Democratic 1984 Incumbent re-elected.
Pennsylvania 12 John Murtha Democratic 1974 Incumbent re-elected.
  • Green check.svgY John Murtha (Democratic) 73.48%
  • Bill Choby (Republican) 26.52%
Frank Mascara
Redistricted from the 20th district
Democratic 1994 Incumbent lost renomination.
Democratic loss.
Pennsylvania 13 Joe Hoeffel Democratic 1998 Incumbent re-elected.
Robert A. Borski Jr.
Redistricted from the 3rd district
Democratic 1982 Incumbent retired.
Democratic loss.
Pennsylvania 14 William J. Coyne Democratic 1980 Incumbent retired.
Democratic loss.
Mike Doyle
Redistricted from the 18th district
Democratic 1994 Incumbent re-elected.
Pennsylvania 15 Pat Toomey Republican 1998 Incumbent re-elected.
  • Green check.svgY Pat Toomey (Republican) 57.36%
  • Ed O'Brien (Democratic) 42.64%
Pennsylvania 16 Joe Pitts Republican 1996 Incumbent re-elected.
  • Green check.svgY Joe Pitts (Republican) 88.45%
  • Will Todd (Green) 6.48%
  • Kenneth Brenneman (Constitution) 5.03%
Pennsylvania 17 George Gekas Republican 1982 Incumbent lost re-election.
Republican loss.
Tim Holden
Redistricted from the 6th district
Democratic 1992 Incumbent re-elected.
Pennsylvania 18 None (District created)New district.
New member elected.
Republican gain.
  • Green check.svgY Tim Murphy (Republican) 60.14%
  • Jack Machek (Democratic) 39.86%
Pennsylvania 19 Todd Platts Republican 2000 Incumbent re-elected.
  • Green check.svgY Todd Platts (Republican) 91.06%
  • Ben Price (Green) 5.03%
  • Kenneth Brenneman (Libertarian) 3.82%

Rhode Island

DistrictIncumbentThis race
MemberPartyFirst electedResultsCandidates
Rhode Island 1 Patrick J. Kennedy Democratic 1994 Incumbent re-elected.
  • Green check.svgY Patrick J. Kennedy (Democratic) 59.88%
  • David W. Rogers (Republican) 37.31%
  • Frank Carter (Libertarian) 2.71%
Rhode Island 2 James Langevin Democratic 2000 Incumbent re-elected.
  • Green check.svgY James Langevin (Democratic) 76.29%
  • John Matson (Republican) 22.27%
  • Dorman Hayes (Independent) 1.37%

South Carolina

DistrictIncumbentThis race
MemberPartyFirst electedResultsCandidates
South Carolina 1 Henry E. Brown Jr. Republican 2000 Incumbent re-elected.
  • Green check.svgY Henry E. Brown Jr. (Republican) 89.56%
  • James E. Dunn (United Citizens) 6.91%
  • Joe Innella (Natural Law) 3.49%
South Carolina 2 Joe Wilson Republican 2001 (Special) Incumbent re-elected.
  • Green check.svgY Joe Wilson (Republican) 84.12%
  • Mark Whittington (United Citizens) 10.03%
  • Jim Legg (Libertarian) 5.63%
South Carolina 3 Lindsey Graham Republican 1994 Incumbent retired to run for U.S. senator.
New member elected.
Republican hold.
  • Green check.svgY Gresham Barrett (Republican) 67.14%
  • George Brightharp (Democratic) 31.28%
  • Mike Boerste (Libertarian) 1.56%
South Carolina 4 Jim DeMint Republican 1998 Incumbent re-elected.
  • Green check.svgY Jim DeMint (Republican) 69.00%
  • Peter Ashy (Democratic) 29.67%
  • Faye Walters (Natural Law) 1.23%
South Carolina 5 John Spratt Democratic 1982 Incumbent re-elected.
  • Green check.svgY John Spratt (Democratic) 85.87%
  • Doug Kendall (Libertarian) 7.76%
  • Steve Lefemine (Constitution) 6.29%
South Carolina 6 Jim Clyburn Democratic 1992 Incumbent re-elected.
  • Green check.svgY Jim Clyburn (Democratic) 66.98%
  • Gary McLeod (Republican) 32.03%
  • Craig Augenstein (Libertarian) 0.96%

South Dakota

DistrictIncumbentThis race
MemberPartyFirst electedResultsCandidates
South Dakota at-large John Thune Republican 1996 Incumbent retired to run for U.S. senator.
New member elected.
Republican hold.

Tennessee

DistrictIncumbentThis race
MemberPartyFirst electedResultsCandidates
Tennessee 1 Bill Jenkins Republican 1996 Incumbent re-elected.
Tennessee 2 Jimmy Duncan Republican 1988 Incumbent re-elected.
  • Green check.svgY Jimmy Duncan (Republican) 78.98%
  • John Greene (Democratic) 19.91%
Others
  • Joshua Williamson (Independent) 0.60%
  • George Njezic (Independent) 0.51%
Tennessee 3 Zach Wamp Republican 1994 Incumbent re-elected.
  • Green check.svgY Zach Wamp (Republican) 64.54%
  • John Wolfe Jr. (Democratic) 33.82%
  • William Bolen (Independent) 1.00%
  • Timothy Sevier (Independent) 0.54%
Tennessee 4 Van Hilleary Republican 1994 Incumbent retired to run for Governor of Tennessee.
New member elected.
Democratic gain.
Others
  • William Chandler (Independent) 0.58%
  • John Ray (Independent) 0.33%
  • Bert Mason (Independent) 0.27%
  • Ed Wellmann (Independent) 0.22%
Tennessee 5 Bob Clement Democratic 1988 Incumbent retired to run for U.S. senator.
New member elected.
Democratic hold.
Others
  • Jonathan Farley (Independent) 0.71%
  • Jesse Turner (Independent) 0.51%
Tennessee 6 Bart Gordon Democratic 1984 Incumbent re-elected.
  • Green check.svgY Bart Gordon (Democratic) 65.92%
  • Robert Garrison (Republican) 32.33%
  • Patrick Lyons (Independent) 1.73%
Tennessee 7 Ed Bryant Republican 1994 Incumbent retired to run for U.S. senator.
New member elected.
Republican hold.
  • Green check.svgY Marsha Blackburn (Republican) 70.73%
  • Tim Barron (Democratic) 26.48%
  • Rick Patterson (Independent) 2.77%
Tennessee 8 John S. Tanner Democratic 1988 Incumbent re-elected.
Tennessee 9 Harold Ford Jr. Democratic 1996 Incumbent re-elected.

Texas

The state gained two seats in reapportionment.

DistrictIncumbentThis race
MemberPartyFirst electedResultsCandidates
Texas 1 Max Sandlin Democratic 1996 Incumbent re-elected.
  • Green check.svgY Max Sandlin (Democratic) 56.45%
  • John Lawrence (Republican) 43.55%
Texas 2 Jim Turner Democratic 1996 Incumbent re-elected.
  • Green check.svgY Jim Turner (Democratic) 60.85%
  • Van Brookshire (Republican) 38.19%
  • Peter Beach (Libertarian) 0.96%
Texas 3 Sam Johnson Republican 1991 (Special) Incumbent re-elected.
  • Green check.svgY Sam Johnson (Republican) 73.95%
  • Manny Molera (Democratic) 24.33%
  • John E. Davis (Libertarian) 1.72%
Texas 4 Ralph Hall Democratic 1980 Incumbent re-elected.
  • Green check.svgY Ralph Hall (Democratic) 57.82%
  • John Graves (Republican) 40.37%
  • Barbara Robinson (Libertarian) 1.81%
Texas 5 None (District created)New district.
New member elected.
Republican gain.
  • Green check.svgY Jeb Hensarling (Republican) 58.21%
  • Ron Chapman (Democratic) 40.26%
Others
  • Dan Michalski (Libertarian) 0.92%
  • Thomas Kemper (Green) 0.61%
Texas 6 Joe Barton Republican 1984 Incumbent re-elected.
  • Green check.svgY Joe Barton (Republican) 70.35%
  • Felix Alvarado (Democratic) 27.68%
  • Frank Brady (Libertarian) 1.21%
  • B. J. Armstrong (Green) 0.76%
Texas 7 John Culberson Republican 2000 Incumbent re-elected.
  • Green check.svgY John Culberson (Republican) 89.19%
  • Drew P. Parks (Libertarian) 10.76%
Texas 8 Kevin Brady Republican 1996 Incumbent re-elected.
  • Green check.svgY Kevin Brady (Republican) 93.14%
  • Gil Guillory (Libertarian) 6.86%
Texas 9 Nick Lampson Democratic 1996 Incumbent re-elected.
  • Green check.svgY Nick Lampson (Democratic) 58.60%
  • Paul Williams (Republican) 40.31%
  • Dean L. Tucker (Libertarian) 1.09%
Texas 10 Lloyd Doggett Democratic 1994 Incumbent re-elected.
  • Green check.svgY Lloyd Doggett (Democratic) 84.37%
  • Michele Messina (Libertarian) 15.63%
Texas 11 Chet Edwards Democratic 1990 Incumbent re-elected.
  • Green check.svgY Chet Edwards (Democratic) 51.55%
  • Ramsey Farley (Republican) 47.11%
  • Andrew Paul Farris (Libertarian) 1.34%
Texas 12 Kay Granger Republican 1996 Incumbent re-elected.
  • Green check.svgY Kay Granger (Republican) 91.87%
  • Edward A. Hanson (Libertarian) 8.13%
Texas 13 Mac Thornberry Republican 1994 Incumbent re-elected.
  • Green check.svgY Mac Thornberry (Republican) 79.27%
  • Zane Reese (Democratic) 20.73%
Texas 14 Ron Paul Republican 1976 (special)
1976 (defeated)
1978
1984 (retired)
1996
Incumbent re-elected.
  • Green check.svgY Ron Paul (Republican) 68.09%
  • Corby Windham (Democratic) 31.91%
Texas 15 Rubén Hinojosa Democratic 1996 Incumbent re-elected.
Texas 16 Silvestre Reyes Democratic 1996 Incumbent re-elected.
Texas 17 Charles Stenholm Democratic 1978 Incumbent re-elected.
  • Green check.svgY Charles Stenholm (Democratic) 51.36%
  • Rob Beckham (Republican) 47.39%
  • Fred Jones (Libertarian) 1.25%
Texas 18 Sheila Jackson Lee Democratic 1994 Incumbent re-elected.
  • Green check.svgY Sheila Jackson Lee (Democratic) 76.91%
  • Phillip Abbott (Republican) 21.70%
  • Brent Sullivan (Libertarian) 1.38%
Texas 19 Larry Combest Republican 1984 Incumbent re-elected.
  • Green check.svgY Larry Combest (Republican) 91.64%
  • Larry Johnson (Libertarian) 8.36%
Texas 20 Charlie González Democratic 1998 Incumbent re-elected.
Texas 21 Lamar S. Smith Republican 1986 Incumbent re-elected.
  • Green check.svgY Lamar S. Smith (Republican) 72.87%
  • John Courage (Democratic) 25.31%
  • D. G. Roberts (Libertarian) 1.82%
Texas 22 Tom DeLay Republican 1984 Incumbent re-elected.
  • Green check.svgY Tom DeLay (Republican) 63.17%
  • Tim Riley (Democratic) 35.02%
  • Jerry LaFleur (Libertarian) 1.01%
  • Joel West (Green) 0.79%
Texas 23 Henry Bonilla Republican 1992 Incumbent re-elected.
  • Green check.svgY Henry Bonilla (Republican) 51.53%
  • Henry Cuellar (Democratic) 47.20%
  • Jeffrey C. Blunt (Libertarian) 0.73%
  • Ed Scharf (Green) 0.54%
Texas 24 Martin Frost Democratic 1978 Incumbent re-elected.
  • Green check.svgY Martin Frost (Democratic) 64.66%
  • Mike Rivera Ortega (Republican) 33.95%
  • Ken Ashby (Libertarian) 1.38%
Texas 25 Ken Bentsen Jr. Democratic 1994 Incumbent retired to run for U.S. senator.
New member elected.
Democratic hold.
  • Green check.svgY Chris Bell (Democratic) 54.76%
  • Tom Reiser (Republican) 43.09%
  • George Reiter (Green) 1.20%
  • Guy McLendon (Libertarian) 0.94%
Texas 26 Dick Armey Republican 1984 Incumbent retired.
New member elected.
Republican hold.
  • Green check.svgY Michael C. Burgess (Republican) 74.81%
  • Paul LeBon (Democratic) 22.76%
  • David Croft (Libertarian) 1.44%
  • Gary R. Page (Green) 0.99%
Texas 27 Solomon P. Ortiz Democratic 1982 Incumbent re-elected.
Texas 28 Ciro Rodriguez Democratic 1997 (Special) Incumbent re-elected.
  • Green check.svgY Ciro Rodriguez (Democratic) 71.09%
  • Gabriel Perales (Republican) 26.86%
  • William Stallknecht (Independent) 2.05%
Texas 29 Gene Green Democratic 1992 Incumbent re-elected.
  • Green check.svgY Gene Green (Democratic) 95.16%
  • Joe Vu (Libertarian) 4.84%
Texas 30 Eddie Bernice Johnson Democratic 1992 Incumbent re-elected.
  • Green check.svgY Eddie Bernice Johnson (Democratic) 74.26%
  • Ron Bush (Republican) 24.19%
  • Lance Flores (Libertarian) 1.55%
Texas 31 None (District created)New district.
New member elected.
Republican gain.
  • Green check.svgY John Carter (Republican) 69.08%
  • David Bagley (Democratic) 27.36%
  • Clark Simmons (Libertarian) 1.26%
  • John S. Petersen (Green) 1.23%
  • R. C. Crawford (Independent) 1.06%
Texas 32 Pete Sessions
Redistricted from the 5th district
Republican 1996 Incumbent re-elected.
  • Green check.svgY Pete Sessions (Republican) 67.77%
  • Pauline Dixon (Democratic) 30.35%
  • Steve Martin (Libertarian) 1.07%
  • Carla Hubbell (Green) 0.82%

Utah

DistrictIncumbentThis race
MemberPartyFirst electedResultsCandidates
Utah 1 James V. Hansen Republican 1980 Incumbent retired.
New member elected.
Republican hold.
  • Green check.svgY Rob Bishop (Republican) 60.69%
  • Dave Thomas (Democratic) 36.84%
  • Craig Axford (Green) 2.24%
Utah 2 Jim Matheson Democratic 2000 Incumbent re-elected.
  • Green check.svgY Jim Matheson (Democratic) 49.43%
  • John Swallow (Republican) 48.69%
  • Patrick Diehl (Green) 1.16%
  • Ron Copier (Libertarian) 0.72%
Utah 3 Chris Cannon Republican 1996 Incumbent re-elected.
  • Green check.svgY Chris Cannon (Republican) 67.43%
  • Matt Throckmorton (Democratic) 28.98%
  • Kitty Burton (Libertarian) 3.59%

Vermont

DistrictIncumbentThis race
MemberPartyFirst electedResultsCandidates
Vermont at-large Bernie Sanders Independent 1990 Incumbent re-elected.
  • Green check.svgY Bernie Sanders (Independent) 64.26%
  • Bill Meub (Republican) 32.29%
  • Jane Newton (Liberty Union-Progressive) 1.41%
  • Fawn Skinner (Grassroots) 1.04%
  • Daniel Krymkowski (Libertarian) 0.90%

Virginia

DistrictIncumbentThis race
MemberPartyFirst electedResultsCandidates
Virginia 1 Jo Ann Davis Republican 2000 Incumbent re-elected.
Virginia 2 Ed Schrock Republican 2000 Incumbent re-elected.
  • Green check.svgY Ed Schrock (Republican) 83.15%
  • D. C. Amarasinghe (Green) 16.49%
Virginia 3 Bobby Scott Democratic 1992 Incumbent re-elected.
Virginia 4 Randy Forbes Republican 2001 (Special) Incumbent re-elected.
Virginia 5 Virgil Goode Republican 1996 [lower-alpha 4] Incumbent re-elected.
  • Green check.svgY Virgil Goode (Republican) 63.48%
  • Meredith Richards (Democratic) 36.48%
Virginia 6 Bob Goodlatte Republican 1992 Incumbent re-elected.
Virginia 7 Eric Cantor Republican 2000 Incumbent re-elected.
Virginia 8 Jim Moran Democratic 1990 Incumbent re-elected.
  • Green check.svgY Jim Moran (Democratic) 59.81%
  • Scott Tate (Republican) 37.32%
  • Ronald Crickenberger (Independent) 2.65%
Virginia 9 Rick Boucher Democratic 1982 Incumbent re-elected.
Virginia 10 Frank Wolf Republican 1980 Incumbent re-elected.
  • Green check.svgY Frank Wolf (Republican) 71.72%
  • John B. Stevens Jr. (Democratic) 28.13%
Virginia 11 Tom Davis Republican 1994 Incumbent re-elected.
  • Green check.svgY Tom Davis (Republican) 82.90%
  • Frank Creel (Constitution) 16.47%

Washington

DistrictIncumbentThis race
MemberPartyFirst electedResultsCandidates
Washington 1 Jay Inslee Democratic 1992
1994 (defeated)
1998
Incumbent re-elected.
  • Green check.svgY Jay Inslee (Democratic) 55.64%
  • Joe Marine (Republican) 41.31%
  • Mark B. Wilson (Libertarian) 3.05%
Washington 2 Rick Larsen Democratic 2000 Incumbent re-elected.
Washington 3 Brian Baird Democratic 1998 Incumbent re-elected.
Washington 4 Doc Hastings Republican 1994 Incumbent re-elected.
  • Green check.svgY Doc Hastings (Republican) 66.90%
  • Craig Mason (Democratic) 33.10%
Washington 5 George Nethercutt Republican 1994 Incumbent re-elected.
Washington 6 Norm Dicks Democratic 1976 Incumbent re-elected.
  • Green check.svgY Norm Dicks (Democratic) 64.20%
  • Bob Lawrence (Republican) 31.35%
  • John A. Bennett (Libertarian) 4.45%
Washington 7 Jim McDermott Democratic 1988 Incumbent re-elected.
  • Green check.svgY Jim McDermott (Democratic) 74.07%
  • Carol Thorne Cassady (Republican) 21.92%
  • Stan Lippmann (Libertarian) 4.00%
Washington 8 Jennifer Dunn Republican 1992 Incumbent re-elected.
Washington 9 Adam Smith Democratic 1996 Incumbent re-elected.

West Virginia

DistrictIncumbentThis race
MemberPartyFirst electedResultsCandidates
West Virginia 1 Alan Mollohan Democratic 1982 Incumbent re-elected.
West Virginia 2 Shelley Moore Capito Republican 2000 Incumbent re-elected.
West Virginia 3 Nick Rahall Democratic 1976 Incumbent re-elected.
  • Green check.svgY Nick Rahall (Democratic) 70.22%
  • Paul Chapman (Republican) 29.78%

Wisconsin

The state lost one seat in reapportionment.

DistrictIncumbentThis race
MemberPartyFirst electedResultsCandidates
Wisconsin 1 Paul Ryan Republican 1998 Incumbent re-elected.
Wisconsin 2 Tammy Baldwin Democratic 1998 Incumbent re-elected.
Wisconsin 3 Ron Kind Democratic 1996 Incumbent re-elected.
  • Green check.svgY Ron Kind (Democratic) 62.82%
  • Bill Arndt (Republican) 33.54%
  • George Meyers (Libertarian) 3.20%
Wisconsin 4 Jerry Kleczka Democratic 1984 Incumbent re-elected.
  • Green check.svgY Jerry Kleczka (Democratic) 86.32%
  • Brian Verdin (Green) 12.96%
Tom Barrett
Redistricted from the 5th district
Democratic 1992 Incumbent retired to run for Governor of Wisconsin.
Democratic loss.
Wisconsin 5 Jim Sensenbrenner
Redistricted from the 9th district
Republican 1978 Incumbent re-elected.
Wisconsin 6 Tom Petri Republican 1979 (Special) Incumbent re-elected.
Wisconsin 7 Dave Obey Democratic 1969 (Special) Incumbent re-elected.
  • Green check.svgY Dave Obey (Democratic) 64.21%
  • Joe Rothbauer (Republican) 35.76%
Wisconsin 8 Mark Andrew Green Republican 1998 Incumbent re-elected.
  • Green check.svgY Mark Andrew Green (Republican) 72.58%
  • Andrew Becker (Democratic) 23.89%
  • Dick Kaiser (Green) 3.49%

Wyoming

DistrictIncumbentThis race
MemberPartyFirst electedResultsCandidates
Wyoming at-large Barbara Cubin Republican 1994 Incumbent re-elected.
  • Green check.svgY Barbara Cubin (Republican) 60.51%
  • Ron Akin (Democratic) 36.21%
  • Lewis Stock (Libertarian) 3.27%

See also

Notes

  1. Stump was originally elected as a Democrat. He switched parties in 1982 and was re-elected as such that year.
  2. Deal was originally elected as a Democrat. He switched parties in April 1995.
  3. Tauzin was first elected as a Democrat. He switched to the Republican Party in August 1995.
  4. Goode was elected as Democrat. He left the party in January 2000 and became a Republican in August 2002.

Related Research Articles

<span class="mw-page-title-main">2000 United States House of Representatives elections</span> House elections for the 107th U.S. Congress

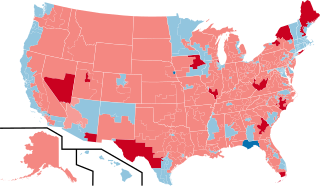
The 2000 United States House of Representatives elections were held on November 7, 2000, to elect U.S. Representatives to serve in the 107th United States Congress. They coincided with the election of George W. Bush as President of the United States. The Republican Party won 221 seats, while the Democratic Party won 212 and independents won two.

<span class="mw-page-title-main">1996 United States House of Representatives elections</span> House elections for the 105th U.S. Congress

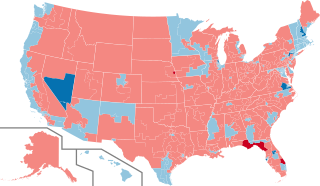
The 1996 United States House of Representatives elections was an election for the United States House of Representatives on November 5, 1996, to elect members to serve in the 105th United States Congress. They coincided with the re-election of President Bill Clinton. Democrats won the popular vote by almost 60,000 votes (0.07%) and gained a net of two seats from the Republicans, but the Republicans retained an overall majority of seats in the House for the first time since 1928.

<span class="mw-page-title-main">1992 United States House of Representatives elections</span> House elections for the 103rd U.S. Congress

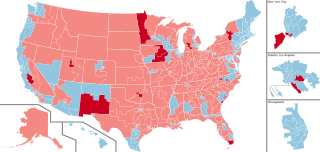
The 1992 United States House of Representatives elections were held on November 3, 1992, to elect U.S. Representatives to serve in the 103rd United States Congress. They coincided with the 1992 presidential election, in which Democrat Bill Clinton was elected as President, defeating Republican incumbent President George H. W. Bush.

<span class="mw-page-title-main">1990 United States House of Representatives elections</span> House elections for the 102nd U.S. Congress

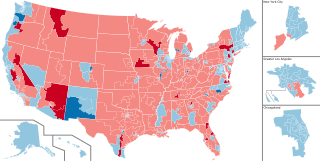
The 1990 United States House of Representatives elections was an election for the United States House of Representatives on November 6, 1990, to elect members to serve in the 102nd United States Congress. They occurred in the middle of President George H. W. Bush's term. As in most midterm elections, the President's Republican Party lost seats to the Democratic Party, slightly increasing the Democratic majority in the chamber. It was a rare instance, however, in which both major parties lost votes to third parties such as the Libertarian Party as well as independent candidates.

<span class="mw-page-title-main">1982 United States House of Representatives elections</span> House elections for the 98th U.S. Congress

The 1982 United States House of Representatives elections was an election for the United States House of Representatives held on November 2, 1982, to elect members to serve in the 98th United States Congress. They occurred in the middle of President Ronald Reagan's first term, whose popularity was sinking due to economic conditions under the 1982 recession. The President's Republican Party lost seats in the House, which could be viewed as a response to the President's approval at the time. Unlike most midterm election cycles, the number of seats lost—26 seats to the Democratic Party—was a comparatively large swap. It included most of the seats that had been gained the previous election, cementing the Democratic majority. Coincidentally, the number of seats the Democrats picked up (26), was the exact amount the Republicans would have needed to win the House majority. It was the first election held after the 1980 United States redistricting cycle.

<span class="mw-page-title-main">1972 United States House of Representatives elections</span> House elections for the 93rd U.S. Congress

The 1972 United States House of Representatives elections were held on November 7, 1972, to elect U.S. Representatives to serve in the 93rd United States Congress. This was the first election held after the 1970 United States redistricting cycle. It coincided with the landslide reelection victory of President Richard M. Nixon. Nixon's Republican Party managed to gain a net of twelve House of Representatives seats from the Democratic Party, although the Democrats retained a majority.

<span class="mw-page-title-main">1962 United States House of Representatives elections</span> House elections for the 88th U.S. Congress

The 1962 United States House of Representatives elections was an election for the United States House of Representatives on November 6, 1962, to elect members to serve in the 88th United States Congress. They occurred in the middle of President John F. Kennedy's term. As in most midterm elections, Kennedy's Democratic Party lost seats to the opposition Republican Party, but retained a majority. House Democrats were expected to lose their majority, but the resolution over the Cuban Missile Crisis just a few weeks prior led to a rebound in approval for the Democrats under President Kennedy.

<span class="mw-page-title-main">1952 United States House of Representatives elections</span> House elections for the 83rd U.S. Congress

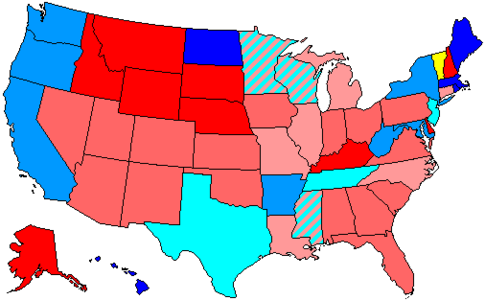
The 1952 United States House of Representatives elections was an election for the United States House of Representatives to elect members to serve in the 83rd United States Congress. They were held for the most part on November 4, 1952, while Maine held theirs on September 8. This was the first election after the congressional reapportionment based on the 1950 census. It also coincided with the election of President Dwight Eisenhower. Eisenhower's Republican Party gained 22 seats from the Democratic Party, gaining a majority of the House. However, the Democrats had almost 250,000 more votes (0.4%) thanks to overwhelming margins in the Solid South, although this election did see the first Republican elected to the House from North Carolina since 1928, and the first Republicans elected from Virginia since 1930. It was also the last election when both major parties increased their share of the popular vote simultaneously, largely due to the disintegration of the American Labor Party and other third parties.

<span class="mw-page-title-main">1932 United States House of Representatives elections</span> House elections for the 73rd U.S. Congress

The 1932 United States House of Representatives elections were elections for the United States House of Representatives to elect members to serve in the 73rd United States Congress. They were held for the most part on November 8, 1932, while Maine held theirs on September 12. They coincided with the landslide election of President Franklin D. Roosevelt.

<span class="mw-page-title-main">2010 United States House of Representatives elections</span> House elections for the 112th U.S. Congress

The 2010 United States House of Representatives elections were held on November 2, 2010, as part of the 2010 midterm elections during President Barack Obama's first term in office. Voters of the 50 U.S. states chose 435 U.S. Representatives to serve in the 112th United States Congress. Also, voters of the U.S. territories, commonwealths and District of Columbia chose their non-voting delegates. U.S. Senate elections and various state and local elections were held on the same date.

<span class="mw-page-title-main">2012 United States House of Representatives elections</span> House elections for the 113th U.S. Congress

The 2012 United States House of Representatives elections were held on November 6, 2012. It coincided with the reelection of President Barack Obama. Elections were held for all 435 seats representing the 50 U.S. states and also for the delegates from the District of Columbia and five major U.S. territories. The winners of this election cycle served in the 113th United States Congress. This was the first congressional election using districts drawn up based on the 2010 United States census.

<span class="mw-page-title-main">Redistricting in Pennsylvania</span> Overview about redistricting in Pennsylvania

Redistricting in Pennsylvania refers to the decennial process of redrawing state legislative and federal congressional districts in Pennsylvania.

<span class="mw-page-title-main">2014 United States House of Representatives elections</span> House elections for the 114th U.S. Congress

The 2014 United States House of Representatives elections were held on November 4, 2014, in the middle of President Barack Obama's second term in office. Elections were held for all 435 seats of the House of Representatives, representing the 50 states. Elections were also held for the non-voting delegates from the District of Columbia and four of the five territories. The winners of these elections served in the 114th United States Congress, with seats apportioned among the states based on the 2010 United States census.

<span class="mw-page-title-main">2018 United States Senate elections</span>

The 2018 United States Senate elections were held on November 6, 2018. Among the 100 seats, the 33 of Class 1 were contested in regular elections while 2 others were contested in special elections due to Senate vacancies in Minnesota and Mississippi. The regular election winners were elected to 6-year terms running from January 3, 2019, to January 3, 2025. Senate Democrats had 26 seats up for election, while Senate Republicans had 9 seats up for election.

<span class="mw-page-title-main">2018 United States elections</span>

The 2018 United States elections were held on Tuesday, November 6, 2018. These midterm elections occurred during Incumbent Republican President Donald Trump's term. Although the Republican Party increased its majority in the Senate, unified Republican control of Congress and the White House was brought to an end when the Democratic Party won control of the House of Representatives in what was widely characterized as a "blue wave" election as Democrats also gained governorships, statewide offices, and state legislative chambers.

<span class="mw-page-title-main">2016 United States House of Representatives elections</span> House elections for the 115th U.S. Congress

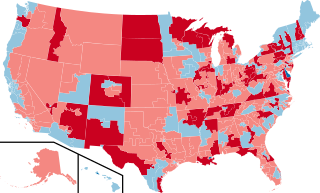
The 2016 United States House of Representatives elections were held on November 8, 2016, to elect representatives for all 435 congressional districts across each of the 50 U.S. states to the 115th United States Congress. Non-voting members for the District of Columbia and territories of the United States were also elected. These elections coincided with the election of President Donald Trump, although his party lost seats in both chambers of Congress. The winners of this election served in the 115th Congress, with seats apportioned among the states based on the 2010 United States census. In October 2015, the House elected a new Speaker, Republican Paul Ryan, who was re-elected in the new term. Democrat Nancy Pelosi continued to lead her party as Minority Leader. Elections were also held on the same day for the U.S. Senate, many governors, and other state and local elections.

<span class="mw-page-title-main">2018 United States House of Representatives elections</span> House elections for the 116th U.S. Congress

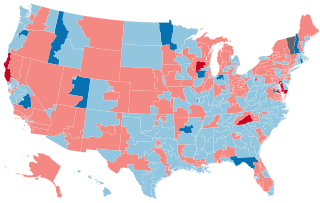
The 2018 United States House of Representatives elections were held on November 6, 2018, as part of the 2018 midterm elections during President Donald Trump's term, with early voting taking place in some states in the weeks preceding that date. Voters chose representatives from all 435 congressional districts across each of the 50 U.S. states to serve in the 116th United States Congress. Non-voting delegates from the District of Columbia and four of the five inhabited U.S. territories were also elected. On Election Day, Republicans had held a House majority since January 2011.

<span class="mw-page-title-main">2020 United States House of Representatives elections</span> House elections for the 117th U.S. Congress

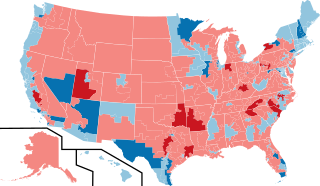
The 2020 United States House of Representatives elections were held on November 3, 2020, to elect representatives from all 435 congressional districts across each of the 50 U.S. states to the 117th United States Congress, as well as six non-voting delegates from the District of Columbia and the inhabited U.S. territories. Special House elections were also held on various dates throughout 2020.

<span class="mw-page-title-main">2022 United States House of Representatives elections</span> House election for the 118th U.S. Congress

The 2022 United States House of Representatives elections were held on November 8, 2022, as part of the 2022 United States elections during incumbent president Joe Biden's term. Representatives were elected from all 435 U.S. congressional districts across each of the 50 states to serve in the 118th United States Congress, as well as 5 non-voting members of the U.S. House of Representatives from the District of Columbia and four of the five inhabited insular areas. Numerous other federal, state, and local elections, including the 2022 U.S. Senate elections and the 2022 U.S. gubernatorial elections, were also held simultaneously. This was the first election after the 2020 redistricting cycle.

<span class="mw-page-title-main">2023 Virginia Senate election</span>

The 2023 Virginia Senate election was held on Tuesday, November 7, 2023, concurrently with elections for the Virginia House of Delegates, to elect senators to all 40 seats in the Senate of Virginia for the 163rd and 164th Virginia Assembly. Nomination primaries held through the Department of Elections were held June 20, 2023. These were the first elections held following redistricting as a result of the 2020 census.

References

  1. Frail, T. A. "Top 10 Historic Midterm Elections". Smithsonian Magazine. Retrieved May 26, 2020.
  2. "2002 Congressional Results". Federal Election Commission.
  3. "Our Campaigns - Container Detail Page". www.ourcampaigns.com. Retrieved December 20, 2017.
  4. "Our Campaigns - Container Detail Page". www.ourcampaigns.com. Retrieved December 20, 2017.
  5. Representatives, Office of the Clerk, U.S. House of. "Office of the Clerk of the U.S. House of Representatives". clerk.house.gov. Retrieved December 20, 2017.{{cite web}}: CS1 maint: multiple names: authors list (link)