West Dorset | |
---|---|
County constituency for the House of Commons | |
County | Dorset |
Electorate | 83,000 (December 2021) [1] |
Major settlements | Dorchester, Bridport and Sherborne |
Current constituency | |
Created | 1885 |
Member of Parliament | Chris Loder (Conservative) |
Seats | One |
West Dorset is a constituency [n 1] represented in the House of Commons of the UK Parliament since 2019 by Chris Loder, a Conservative. [n 2]
The seat was created under the Redistribution of Seats Act 1885.
Only Conservative MPs have been elected in West Dorset. Historically there have mostly been large majorities; thus the seat can be considered a safe seat. The closest result in recent years was in 2001, when the then member, Oliver Letwin, held his seat with a majority of only 2.8% over the Liberal Democrat candidate, Simon Green. The second place in every election after 1970 has been taken by the Liberal Party and, subsequent to that party's merging with the SDP, the Liberal Democrats. Labour's best results in the constituency were in 1945 and 1966.
Oliver Letwin, with a settled background in policy formulation, was appointed Minister of State for Policy (a Cabinet Office role) in the Conservative-Liberal Democrat Coalition on 12 May 2010. He had previously served as Shadow Chancellor of the Exchequer between 2003 and 2005.
1885–1918: The Municipal Boroughs of Bridport and Lyme Regis, the Sessional Divisions of Bridport and Cerne, and part of the Sessional Divisions of Dorchester and Sherborne.
1918–1950: The Municipal Boroughs of Bridport, Dorchester, and Lyme Regis, the Rural Districts of Beaminster, Bridport, Cerne, and Dorchester, and part of the Rural District of Weymouth.
1950–1974: The Municipal Boroughs of Bridport, Dorchester, and Lyme Regis, the Urban District of Sherborne, the Rural Districts of Beaminster, Bridport, and Sherborne, and part of the Rural District of Dorchester.
1974–1983: As 1950 but with redrawn boundaries.
1983–present: The District of West Dorset except the ward of Owermoigne.
The West Dorset constituency covers most of the West Dorset district and includes the towns of Dorchester, the county town of Dorset; Bridport, Lyme Regis and Beaminster to the west; and Sherborne to the north.
Further to the 2023 Periodic Review of Westminster constituencies, enacted by the Parliamentary Constituencies Order 2023, from the next general election, due by January 2025, the constituency will be composed of the following (as they existed on 1 December 2020):
Minor changes to bring the electorate within the permitted range following re-organisation of local authorities and wards in Dorset and to bring the electorate within the permitted range.
Aside from tourist areas, including the Jurassic Coast which is a UNESCO World Heritage Site, the seat draws on managerial and advanced professional skills in sectors such as mechanical engineering, manufacturing, reconditioning, defence, art and design, which support local trades and retail. A slightly greater than average proportion of people are retired. [3] Workless claimants who were registered jobseekers were in November 2012 significantly lower than the national average of 3.8%, at 1.4% of the population based on a statistical compilation by The Guardian . [4]
Election | Member [5] | Party | Notes | |
---|---|---|---|---|
1885 | Henry Farquharson | Conservative | Died 1895 | |
1895 by-election | Robert Williams | Conservative | ||
1922 | Philip Colfox | Conservative | Resigned 1941 | |
1941 by-election | Simon Digby | Conservative | ||
Feb 1974 | Jim Spicer | Conservative | ||
1997 | Oliver Letwin | Conservative | ||
2019 | Independent | Conservative whip removed in September 2019 | ||
2019 | Chris Loder | Conservative |
Party | Candidate | Votes | % | ±% | |
---|---|---|---|---|---|
Green | Kelvin Clayton [6] | ||||
Conservative | Chris Loder [7] | ||||
Liberal Democrats | Edward Morello [8] | ||||
Majority | |||||
Turnout |
Party | Candidate | Votes | % | ±% | |
---|---|---|---|---|---|
Conservative | Chris Loder | 33,589 | 55.1 | –0.4 | |
Liberal Democrats | Edward Morello | 19,483 | 32.0 | +8.5 | |
Labour | Claudia Sorin | 5,729 | 9.4 | –8.9 | |
Green | Kelvin Clayton | 2,124 | 3.5 | +0.8 | |
Majority | 14,106 | 23.1 | –8.9 | ||
Turnout | 60,925 | 74.7 | –0.9 | ||
Conservative hold | Swing | –4.5 | |||
Party | Candidate | Votes | % | ±% | |
---|---|---|---|---|---|
Conservative | Oliver Letwin | 33,081 | 55.5 | +5.3 | |
Liberal Democrats | Andy Canning | 13,990 | 23.5 | +1.9 | |
Labour | Lee Rhodes | 10,896 | 18.3 | +8.3 | |
Green | Kelvin Clayton | 1,631 | 2.7 | −3.0 | |
Majority | 19,091 | 32.0 | +2.4 | ||
Turnout | 59,750 | 75.6 | +3.0 | ||
Conservative hold | Swing | +1.7 | |||
Party | Candidate | Votes | % | ±% | |
---|---|---|---|---|---|
Conservative | Oliver Letwin | 28,329 | 50.2 | +2.6 | |
Liberal Democrats | Ros Kayes | 12,199 | 21.6 | −19.1 | |
UKIP | David Glossop | 7,055 | 12.5 | +8.7 | |
Labour | Rachel Rogers | 5,633 | 10.0 | +3.3 | |
Green | Peter Barton | 3,242 | 5.7 | +4.5 | |
Majority | 16,130 | 28.6 | +21.7 | ||
Turnout | 56,643 | 72.6 | −2.0 | ||
Conservative hold | Swing | +10.9 | |||
Party | Candidate | Votes | % | ±% | |
---|---|---|---|---|---|
Conservative | Oliver Letwin | 27,287 | 47.6 | +1.1 | |
Liberal Democrats | Sue Farrant | 23,364 | 40.7 | −1.2 | |
Labour | Steve Bick | 3,815 | 6.7 | −1.0 | |
UKIP | Oliver Chisholm | 2,196 | 3.8 | +1.8 | |
Green | Susan Greene | 675 | 1.2 | −0.6 | |
Majority | 3,923 | 6.9 | +2.3 | ||
Turnout | 57,337 | 74.6 | −1.7 | ||
Conservative hold | Swing | +1.1 | |||
Party | Candidate | Votes | % | ±% | |
---|---|---|---|---|---|
Conservative | Oliver Letwin | 24,763 | 46.5 | +1.9 | |
Liberal Democrats | Justine McGuinness | 22,302 | 41.9 | +0.1 | |
Labour | Dave Roberts | 4,124 | 7.7 | −5.9 | |
UKIP | Linda Guest | 1,084 | 2.0 | New | |
Green | Susan Greene | 952 | 1.8 | New | |
Majority | 2,461 | 4.6 | +1.8 | ||
Turnout | 53,225 | 76.3 | +6.8 | ||
Conservative hold | Swing | +0.9 | |||
Party | Candidate | Votes | % | ±% | |
---|---|---|---|---|---|
Conservative | Oliver Letwin | 22,126 | 44.6 | +3.5 | |
Liberal Democrats | Simon Green | 20,712 | 41.8 | +4.1 | |
Labour | Richard Hyde | 6,733 | 13.6 | −4.1 | |
Majority | 1,414 | 2.8 | -0.6 | ||
Turnout | 49,571 | 69.5 | −6.6 | ||
Conservative hold | Swing | ||||
Party | Candidate | Votes | % | ±% | |
---|---|---|---|---|---|
Conservative | Oliver Letwin | 22,036 | 41.1 | -7.7 | |
Liberal Democrats | Robin AS Legg | 20,196 | 37.7 | +1.5 | |
Labour | Robert Bygraves | 9,491 | 17.7 | +4.7 | |
UKIP | P. Jenkins | 1,590 | 3.0 | New | |
Natural Law | Mark Griffiths | 239 | 0.4 | New | |
Majority | 1,840 | 3.4 | -11.2 | ||
Turnout | 53,552 | 76.1 | -4.9 | ||
Conservative hold | Swing | ||||
Party | Candidate | Votes | % | ±% | |
---|---|---|---|---|---|
Conservative | James Spicer | 27,766 | 50.8 | −5.4 | |
Liberal Democrats | Robin A.S. Legg | 19,756 | 36.2 | +4.6 | |
Labour | JPB Mann | 7,082 | 13.0 | +0.8 | |
Majority | 8,010 | 14.6 | −10.0 | ||
Turnout | 54,604 | 81.2 | +2.9 | ||
Conservative hold | Swing | −4.9 | |||
Party | Candidate | Votes | % | ±% | |
---|---|---|---|---|---|
Conservative | James Spicer | 28,305 | 56.2 | -3.5 | |
Liberal | Trevor Jones | 15,941 | 31.6 | +2.7 | |
Labour | John Watson | 6,123 | 12.2 | +0.8 | |
Majority | 12,364 | 24.6 | -6.2 | ||
Turnout | 50,369 | 78.3 | +4.1 | ||
Conservative hold | Swing | -3.1 | |||
Party | Candidate | Votes | % | ±% | |
---|---|---|---|---|---|
Conservative | James Spicer | 27,030 | 59.7 | +1.0 | |
Liberal | Trevor Jones | 13,078 | 28.9 | +7.1 | |
Labour | Derek Cash | 5,168 | 11.4 | -6.4 | |
Majority | 13,952 | 30.8 | -6.1 | ||
Turnout | 45,276 | 74.2 | -4.8 | ||
Conservative hold | Swing | -3.0 | |||
Party | Candidate | Votes | % | ±% | |
---|---|---|---|---|---|
Conservative | James Spicer | 26,281 | 58.71 | ||
Liberal | Trevor Jones | 9,776 | 21.84 | ||
Labour | HJ Skevington | 7,999 | 17.87 | ||
National Front | J Tillotson | 514 | 1.15 | New | |
Wessex Regionalist | G McEwan | 192 | 0.43 | New | |
Majority | 16,505 | 36.87 | |||
Turnout | 44,762 | 79.00 | |||
Conservative hold | Swing | ||||
Party | Candidate | Votes | % | ±% | |
---|---|---|---|---|---|
Conservative | James Spicer | 20,517 | 49.20 | ||
Liberal | RM Angus | 11,832 | 28.37 | ||
Labour | PJ Dawe | 9,350 | 22.42 | ||
Majority | 8,685 | 20.83 | |||
Turnout | 41,699 | 77.84 | |||
Conservative hold | Swing | ||||
Party | Candidate | Votes | % | ±% | |
---|---|---|---|---|---|
Conservative | James Spicer | 21,634 | 49.00 | ||
Liberal | RM Angus | 14,183 | 32.12 | ||
Labour | MF Cross | 8,333 | 18.87 | ||
Majority | 7,451 | 16.88 | |||
Turnout | 44,150 | 83.12 | |||
Conservative hold | Swing | ||||
Party | Candidate | Votes | % | ±% | |
---|---|---|---|---|---|
Conservative | Simon Wingfield Digby | 21,081 | 54.15 | ||
Labour | George Sakwa | 10,536 | 27.06 | ||
Liberal | Allan Percival | 7,314 | 18.79 | ||
Majority | 10,545 | 27.09 | |||
Turnout | 38,931 | 76.76 | |||
Conservative hold | Swing | ||||
Party | Candidate | Votes | % | ±% | |
---|---|---|---|---|---|
Conservative | Simon Wingfield Digby | 17,709 | 47.68 | ||
Labour | F Donald Shirreff | 11,757 | 31.65 | ||
Liberal | Michael Aza Pinney | 7,676 | 20.67 | ||
Majority | 5,952 | 16.03 | |||
Turnout | 37,142 | 80.85 | |||
Conservative hold | Swing | ||||
Party | Candidate | Votes | % | ±% | |
---|---|---|---|---|---|
Conservative | Simon Wingfield Digby | 17,841 | 48.59 | ||
Labour | Leslie William King | 10,631 | 28.96 | ||
Liberal | Michael Aza Pinney | 8,242 | 22.45 | ||
Majority | 7,210 | 19.63 | |||
Turnout | 36,714 | 81.68 | |||
Conservative hold | Swing | ||||
Party | Candidate | Votes | % | ±% | |
---|---|---|---|---|---|
Conservative | Simon Wingfield Digby | 19,747 | 54.65 | ||
Labour | Leslie William King | 11,536 | 31.93 | ||
Liberal | John H. Goodden | 4,850 | 13.42 | New | |
Majority | 8,211 | 22.72 | |||
Turnout | 36,133 | 81.92 | |||
Conservative hold | Swing | ||||
Party | Candidate | Votes | % | ±% | |
---|---|---|---|---|---|
Conservative | Simon Wingfield Digby | 21,007 | 59.59 | ||
Labour | Leslie William King | 14,244 | 40.41 | ||
Majority | 6,763 | 19.18 | |||
Turnout | 35,251 | 80.07 | |||
Conservative hold | Swing | ||||
Party | Candidate | Votes | % | ±% | |
---|---|---|---|---|---|
Conservative | Simon Wingfield Digby | 21,739 | 60.31 | ||
Labour | Cambreth John Kane | 14,308 | 39.69 | ||
Majority | 7,431 | 20.62 | |||
Turnout | 36,047 | 82.11 | |||
Conservative hold | Swing | ||||
Party | Candidate | Votes | % | ±% | |
---|---|---|---|---|---|
Conservative | Simon Wingfield Digby | 18,771 | 51.75 | ||
Labour | Cambreth John Kane | 11,967 | 33.00 | ||
Liberal | Colin Grant Cameron | 5,531 | 15.25 | ||
Majority | 6,804 | 18.75 | |||
Turnout | 36,269 | 83.95 | |||
Conservative hold | Swing | ||||
Party | Candidate | Votes | % | ±% | |
---|---|---|---|---|---|
Conservative | Simon Wingfield Digby | 13,399 | 50.1 | -4.0 | |
Labour | Cambreth John Kane | 8,215 | 30.8 | New | |
Liberal | George Newsom | 5,098 | 19.1 | -26.8 | |
Majority | 5,184 | 19.3 | +9.1 | ||
Turnout | 26,712 | 74.7 | -3.2 | ||
Conservative hold | Swing | ||||
Party | Candidate | Votes | % | ±% | |
---|---|---|---|---|---|
Conservative | Simon Wingfield Digby | Unopposed | N/A | N/A | |
Conservative hold | |||||
General Election 1939–40:
Another general election was required to take place before the end of 1940. The political parties had been making preparations for an election to take place from 1939, and by the end of this year the following candidates had been selected:
Party | Candidate | Votes | % | ±% | |
---|---|---|---|---|---|
Conservative | Philip Colfox | 13,825 | 54.1 | -6.1 | |
Liberal | George Edwin Chappell | 11,735 | 45.9 | +6.1 | |
Majority | 2,090 | 8.2 | -12.2 | ||
Turnout | 25,560 | 77.9 | -3.7 | ||
Conservative hold | Swing | -6.1 | |||
Party | Candidate | Votes | % | ±% | |
---|---|---|---|---|---|
Conservative | Philip Colfox | 15,510 | 60.2 | +11.1 | |
Liberal | George Edwin Chappell | 10,271 | 39.8 | +8.0 | |
Majority | 5,239 | 20.4 | +3.1 | ||
Turnout | 25,781 | 81.6 | +1.0 | ||
Conservative hold | Swing | ||||
Party | Candidate | Votes | % | ±% | |
---|---|---|---|---|---|
Unionist | Philip Colfox | 12,247 | 49.1 | -19.2 | |
Liberal | George Edwin Chappell | 7,921 | 31.8 | New | |
Labour | Thomas Robins | 4,770 | 19.1 | -12.6 | |
Majority | 4,326 | 17.3 | -19.3 | ||
Turnout | 24,938 | 80.6 | +7.4 | ||
Unionist hold | Swing | N/A | |||
Party | Candidate | Votes | % | ±% | |
---|---|---|---|---|---|
Unionist | Philip Colfox | 12,426 | 68.3 | +9.5 | |
Labour | Louie Simpson | 5,764 | 31.7 | -9.5 | |
Majority | 6,662 | 36.6 | +19.0 | ||
Turnout | 18,190 | 73.2 | +2.3 | ||
Unionist hold | Swing | +9.5 | |||
Party | Candidate | Votes | % | ±% | |
---|---|---|---|---|---|
Unionist | Philip Colfox | 10,100 | 58.8 | -3.3 | |
Labour | Louie Simpson | 7,087 | 41.2 | +3.3 | |
Majority | 3,013 | 17.6 | -6.6 | ||
Turnout | 17,187 | 70.9 | -7.6 | ||
Unionist hold | Swing | -3.3 | |||
Party | Candidate | Votes | % | ±% | |
---|---|---|---|---|---|
Unionist | Philip Colfox | 11,649 | 62.1 | N/A | |
Labour | T C Duke | 7,101 | 37.9 | New | |
Majority | 4,548 | 24.2 | N/A | ||
Turnout | 18,750 | 78.5 | N/A | ||
Unionist hold | Swing | N/A | |||
Party | Candidate | Votes | % | ±% | |
---|---|---|---|---|---|
C | Unionist | Robert Williams | Unopposed | ||
Unionist hold | |||||
Cindicates candidate endorsed by the coalition government. |
General Election 1914–15:
Another General Election was required to take place before the end of 1915. The political parties had been making preparations for an election to take place and by July 1914, the following candidates had been selected:
Party | Candidate | Votes | % | ±% | |
---|---|---|---|---|---|
Conservative | Robert Williams | Unopposed | |||
Conservative hold | |||||
Party | Candidate | Votes | % | ±% | |
---|---|---|---|---|---|
Conservative | Robert Williams | 4,011 | 59.2 | +2.8 | |
Liberal | William Saunders Edwards | 2,759 | 40.8 | -2.8 | |
Majority | 1,252 | 18.4 | +5.6 | ||
Turnout | 6,770 | 89.4 | +1.6 | ||
Registered electors | 7,576 | ||||
Conservative hold | Swing | +2.8 | |||
Party | Candidate | Votes | % | ±% | |
---|---|---|---|---|---|
Conservative | Robert Williams | 3,671 | 56.4 | N/A | |
Liberal | Johnstone J Haye | 2,834 | 43.6 | New | |
Majority | 837 | 12.8 | N/A | ||
Turnout | 6,505 | 87.8 | N/A | ||
Registered electors | 7,413 | ||||
Conservative hold | Swing | N/A | |||
Party | Candidate | Votes | % | ±% | |
---|---|---|---|---|---|
Conservative | Robert Williams | Unopposed | |||
Conservative hold | |||||
Party | Candidate | Votes | % | ±% | |
---|---|---|---|---|---|
Conservative | Robert Williams | Unopposed | |||
Conservative hold | |||||
Party | Candidate | Votes | % | ±% | |
---|---|---|---|---|---|
Conservative | Robert Williams | 3,538 | 60.3 | +3.6 | |
Independent Farmers | George Wood Homer [22] [n 3] | 2,325 | 39.7 | −3.6 | |
Majority | 1,213 | 20.6 | +7.2 | ||
Turnout | 5,863 | 76.0 | −8.0 | ||
Registered electors | 7,713 | ||||
Conservative hold | Swing | +3.6 | |||
Party | Candidate | Votes | % | ±% | |
---|---|---|---|---|---|
Conservative | Henry Farquharson | 3,691 | 56.7 | −3.1 | |
Liberal | Charles Tindal Gatty | 2,813 | 43.3 | +3.1 | |
Majority | 878 | 13.4 | −6.2 | ||
Turnout | 6,504 | 84.0 | +6.4 | ||
Registered electors | 7,747 | ||||
Conservative hold | Swing | −3.1 | |||
Party | Candidate | Votes | % | ±% | |
---|---|---|---|---|---|
Conservative | Henry Farquharson | 3,672 | 59.8 | +8.8 | |
Liberal | Herbert Carey George Batten [23] | 2,467 | 40.2 | -8.8 | |
Majority | 1,205 | 19.6 | +17.6 | ||
Turnout | 6,139 | 77.6 | −9.2 | ||
Registered electors | 7,914 | ||||
Conservative hold | Swing | +8.8 | |||
Party | Candidate | Votes | % | ±% | |
---|---|---|---|---|---|
Conservative | Henry Farquharson | 3,507 | 51.0 | ||
Liberal | Herbert Carey George Batten [23] | 3,366 | 49.0 | ||
Majority | 141 | 2.0 | |||
Turnout | 6,873 | 86.8 | |||
Registered electors | 7,914 | ||||
Conservative win (new seat) |
West Dorset was a local government district in Dorset, England. The district was formed on 1 April 1974 under the Local Government Act 1972, and was a merger of the boroughs of Bridport, Dorchester and Lyme Regis, along with Sherborne urban district and the rural districts of Beaminster, Bridport, Dorchester and Sherborne. Its council was based in Dorchester.
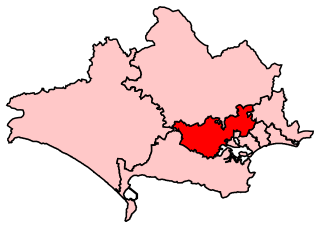
South Dorset is a constituency represented in the House of Commons of the UK Parliament since 2010 by Richard Drax, a Conservative. The constituency was created as a consequence of the Redistribution of Seats Act 1885, although the area covered has changed since then.
Mid Dorset and North Poole is a constituency represented in the House of Commons of the UK Parliament since 2015 by Michael Tomlinson, a Conservative.
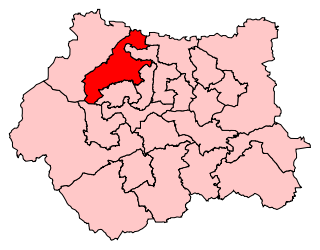
Shipley is a constituency represented in the House of Commons of the UK Parliament since 2005 by Philip Davies, a Conservative.
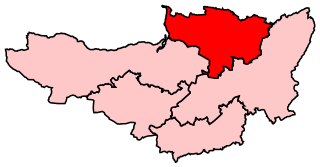
Wells is a constituency represented in the House of Commons of the UK Parliament since 2015 by James Heappey of the Conservative Party.
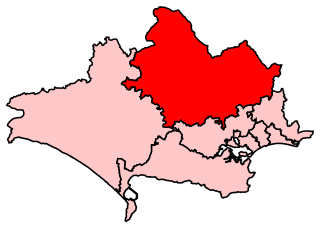
North Dorset is a constituency represented in the House of Commons of the UK Parliament since 2015 by Simon Hoare, a Conservative.
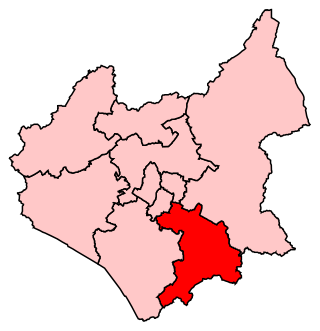
Harborough is a constituency covering the south east of Leicestershire represented in the House of Commons of the UK Parliament since 2017 by Neil O'Brien of the Conservative Party.
Newcastle-under-Lyme is a constituency in northern Staffordshire created in 1354 and represented in the House of Commons of the UK Parliament since 2019 by Aaron Bell of the Conservative Party. It was the last to be co-represented by a member of the Conservative Party when it was dual-member, before the 1885 general election which followed the Redistribution of Seats Act 1885 coupled with the Reform Act 1884. In 1919 the local MP, Josiah Wedgwood, shifted his allegiance from the Liberal Party — the Lloyd George Coalition Liberals allying with the Conservatives — to the Labour Party and the seat elected the Labour candidate who has stood at each election for the next hundred years, a total of 29 elections in succession. Labour came close to losing the seat in 1969, 1986, 2015 and 2017, and eventually lost the seat in 2019.
Staffordshire Moorlands is a constituency represented in the House of Commons of the UK Parliament since 2010 by Karen Bradley, a Conservative who served as Secretary of State for Culture, Media and Sport between 2016 and 2018, before she became Secretary of State for Northern Ireland from 2018 to 2019. As with all constituencies, the constituency elects one Member of Parliament (MP) by the first past the post system of election at least every five years. This seat has seen a swing to the Conservatives at the past four elections.
Stone is a constituency in Staffordshire, represented in the House of Commons of the UK Parliament since its 1997 recreation by Sir Bill Cash, a Conservative. On 9 June 2023, he announced his intention to stand down at the next general election.
North East Hampshire is a constituency represented in the House of Commons of the UK Parliament by Ranil Jayawardena, a Conservative.
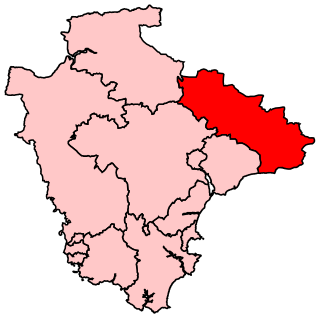
Tiverton and Honiton is a constituency in Devon, England. The current MP is Richard Foord of the Liberal Democrats, elected at a by-election on 23 June 2022.
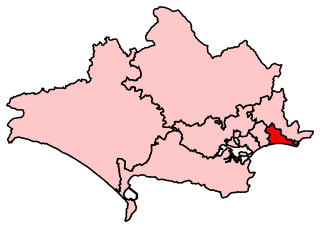
Bournemouth East is a parliamentary constituency in Dorset represented in the House of Commons of the UK Parliament since 2005 by Tobias Ellwood, a Conservative.
Bournemouth West is a parliamentary constituency in Dorset represented in the House of Commons of the UK Parliament since 2010 by Conor Burns, a Conservative.
Christchurch is a constituency in Dorset represented in the House of Commons of the UK Parliament since 1997 by Sir Christopher Chope of the Conservative Party.
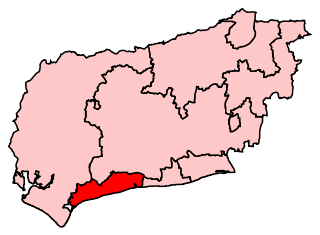
Bognor Regis and Littlehampton is a constituency in West Sussex represented in the House of Commons of the UK Parliament since 1997 by Nick Gibb, a Conservative.
Sittingbourne and Sheppey is a constituency in Kent represented in the House of Commons of the UK Parliament since 2010 by Gordon Henderson, a Conservative.
The 2015 West Dorset District Council election was held on Thursday 7 May 2015 to elect councillors to West Dorset District Council in England. It took place on the same day as the general election other district council elections in the United Kingdom. A series of boundary changes saw the number of councillors reduced from 48 to 44.