Biological network

Last updated

A biological network is a method of representing systems as complex sets of binary interactions or relations between various biological entities. [1] In general, networks or graphs are used to capture relationships between entities or objects. [1] A typical graphing representation consists of a set of nodes connected by edges.

Contents

Illustration of a simple network graph NetworkGraph.png
Illustration of a simple network graph

History of networks

Seven Bridges of Konigsberg. Euler's objective was to design a path that crossed each bridge only once. Konigsberg bridges.png
Seven Bridges of Königsberg. Euler's objective was to design a path that crossed each bridge only once.

As early as 1736 Leonhard Euler analyzed a real-world issue known as the Seven Bridges of Königsberg, which established the foundation of graph theory. From the 1930's-1950's the study of random graphs were developed. During the mid 1990's, it was discovered that many different types of "real" networks have structural properties quite different from random networks. [2] In the late 2000's, scale-free and small-world networks began shaping the emergence of systems biology, network biology, and network medicine. In 2014, graph theoretical methods were used by Frank Emmert-Streib to analyze biological networks.

In the 1980s, researchers started viewing DNA or genomes as the dynamic storage of a language system with precise computable finite states represented as a finite state machine. [3] Recent complex systems research has also suggested some far-reaching commonality in the organization of information in problems from biology, computer science, and physics.

Networks in biology

Protein–protein interaction networks

Shows protein interaction affecting HUD HUD Protein to protein interaction network.png
Shows protein interaction affecting HUD

Protein-protein interaction networks (PINs) represent the physical relationship among proteins present in a cell, where proteins are nodes, and their interactions are undirected edges. [4] Due to their undirected nature, it is difficult to identify all the proteins involved in an interaction. Protein–protein interactions (PPIs) are essential to the cellular processes and also the most intensely analyzed networks in biology. PPIs could be discovered by various experimental techniques, among which the yeast two-hybrid system is a commonly used technique for the study of binary interactions. [5] Recently, high-throughput studies using mass spectrometry have identified large sets of protein interactions. [6]

Many international efforts have resulted in databases that catalog experimentally determined protein-protein interactions. Some of them are the Human Protein Reference Database, Database of Interacting Proteins, the Molecular Interaction Database (MINT), [7] IntAct, [8] and BioGRID. [9] At the same time, multiple computational approaches have been proposed to predict interactions. [10] FunCoup and STRING are examples of such databases, where protein-protein interactions inferred from multiple evidences are gathered and made available for public usage.

Recent studies have indicated the conservation of molecular networks through deep evolutionary time. [11] Moreover, it has been discovered that proteins with high degrees of connectedness are more likely to be essential for survival than proteins with lesser degrees. [12] This observation suggests that the overall composition of the network (not simply interactions between protein pairs) is vital for an organism's overall functioning.

Gene regulatory networks (DNA–protein interaction networks)

Shows interaction between ADRB2 and cancer-specific genes Gene regulatory networks.jpg
Shows interaction between ADRB2 and cancer-specific genes

The genome encodes thousands of genes whose products (mRNAs, proteins) are crucial to the various processes of life, such as cell differentiation, cell survival, and metabolism. Genes produce such products through a process called transcription, which is regulated by a class of proteins called transcription factors. For instance, the human genome encodes almost 1,500 DNA-binding transcription factors that regulate the expression of more than 20,000 human genes. [13] The complete set of gene products and the interactions among them constitutes gene regulatory networks (GRN). GRNs regulate the levels of gene products within the cell and in-turn the cellular processes.

GRNs are represented with genes and transcriptional factors as nodes and the relationship between them as edges. These edges are directional, representing the regulatory relationship between the two ends of the edge. For example., the directed edge from gene A to gene B indicates that A regulates the expression of B. Thus, these directional edges can not only represent the promotion of gene regulation but also its inhibition.

GRNs are usually constructed by utilizing the gene regulation knowledge available from databases such as., Reactome and KEGG. High-throughput measurement technologies, such as microarray, RNA-Seq, ChIP-chip, and ChIP-seq, enabled the accumulation of large-scale transcriptomics data, which could help in understanding the complex gene regulation patterns. [14] [15]

Gene co-expression networks (transcript–transcript association networks)

Gene co-expression networks can be perceived as association networks between variables that measure transcript abundances. These networks have been used to provide a system biologic analysis of DNA microarray data, RNA-seq data, miRNA data, etc. weighted gene co-expression network analysis is extensively used to identify co-expression modules and intramodular hub genes. [16] Co-expression modules may correspond to cell types or pathways, while highly connected intramodular hubs can be interpreted as representatives of their respective modules.

Metabolic networks

This is a phosphorus-dependent metabolic network. Construction-of-Phosphorus-Dependent-Metabolic-Network-Network-expansion-simulation-was.jpg
This is a phosphorus-dependent metabolic network.

Cells break down the food and nutrients into small molecules necessary for cellular processing through a series of biochemical reactions. These biochemical reactions are catalyzed by enzymes. The complete set of all these biochemical reactions in all the pathways represents the metabolic network. Within the metabolic network, the small molecules take the roles of nodes, and they could be either carbohydrates, lipids, or amino acids. The reactions which convert these small molecules from one form to another are represented as edges. It is possible to use network analyses to infer how selection acts on metabolic pathways. [17]

Signaling networks

Signaling network showing difference between traditional and network biological view Representations-of-cell-signaling-networks-A-Traditional-pathway-specific-view-with.png
Signaling network showing difference between traditional and network biological view

Signals are transduced within cells or in between cells and thus form complex signaling networks which plays a key role in the tissue structure. For instance, the MAPK/ERK pathway is transduced from the cell surface to the cell nucleus by a series of protein-protein interactions, phosphorylation reactions, and other events. [18] Signaling networks typically integrate protein–protein interaction networks, gene regulatory networks, and metabolic networks. [19] [20] Single cell sequencing technologies allows the extraction of inter-cellular signaling, an example is NicheNet, which allows to modeling intercellular communication by linking ligands to target genes. [21]

Neuronal networks

The complex interactions in the brain make it a perfect candidate to apply network theory. Neurons in the brain are deeply connected with one another, and this results in complex networks being present in the structural and functional aspects of the brain. [22] For instance, small-world network properties have been demonstrated in connections between cortical regions of the primate brain [23] or during swallowing in humans. [24] This suggests that cortical areas of the brain are not directly interacting with each other, but most areas can be reached from all others through only a few interactions.

Food webs

All organisms are connected through feeding interactions. If a species eats or is eaten by another species, they are connected in an intricate food web of predator and prey interactions. The stability of these interactions has been a long-standing question in ecology. [25] That is to say if certain individuals are removed, what happens to the network (i.e., does it collapse or adapt)? Network analysis can be used to explore food web stability and determine if certain network properties result in more stable networks. Moreover, network analysis can be used to determine how selective removals of species will influence the food web as a whole. [26] This is especially important considering the potential species loss due to global climate change.

Between-species interaction networks

In biology, pairwise interactions have historically been the focus of intense study. With the recent advances in network science, it has become possible to scale up pairwise interactions to include individuals of many species involved in many sets of interactions to understand the structure and function of larger ecological networks. [27] The use of network analysis can allow for both the discovery and understanding of how these complex interactions link together within the system's network, a property that has previously been overlooked. This powerful tool allows for the study of various types of interactions (from competitive to cooperative) using the same general framework. [28] For example, plant-pollinator interactions are mutually beneficial and often involve many different species of pollinators as well as many different species of plants. These interactions are critical to plant reproduction and thus the accumulation of resources at the base of the food chain for primary consumers, yet these interaction networks are threatened by anthropogenic change. The use of network analysis can illuminate how pollination networks work and may, in turn, inform conservation efforts. [29] Within pollination networks, nestedness (i.e., specialists interact with a subset of species that generalists interact with), redundancy (i.e., most plants are pollinated by many pollinators), and modularity play a large role in network stability. [29] [30] These network properties may actually work to slow the spread of disturbance effects through the system and potentially buffer the pollination network from anthropogenic changes somewhat. [30] More generally, the structure of species interactions within an ecological network can tell us something about the diversity, richness, and robustness of the network. [31] Researchers can even compare current constructions of species interactions networks with historical reconstructions of ancient networks to determine how networks have changed over time. [32] Much research into these complex species interactions networks is highly concerned with understanding what factors (e.g., species richness, connectance, nature of the physical environment) lead to network stability. [33] [34]

Within-species interaction networks

Network analysis provides the ability to quantify associations between individuals, which makes it possible to infer details about the network as a whole at the species and/or population level. [35] One of the most attractive features of the network paradigm would be that it provides a single conceptual framework in which the social organization of animals at all levels (individual, dyad, group, population) and for all types of interaction (aggressive, cooperative, sexual, etc.) can be studied. [36]

Researchers interested in ethology across many taxa, from insects to primates, are starting to incorporate network analysis into their research. Researchers interested in social insects (e.g., ants and bees) have used network analyses better to understand the division of labor, task allocation, and foraging optimization within colonies. [37] [38] [39] Other researchers are interested in how specific network properties at the group and/or population level can explain individual-level behaviors. Studies have demonstrated how animal social network structure can be influenced by factors ranging from characteristics of the environment to characteristics of the individual, such as developmental experience and personality. At the level of the individual, the patterning of social connections can be an important determinant of fitness, predicting both survival and reproductive success. At the population level, network structure can influence the patterning of ecological and evolutionary processes, such as frequency-dependent selection and disease and information transmission. [40] For instance, a study on wire-tailed manakins (a small passerine bird) found that a male's degree in the network largely predicted the ability of the male to rise in the social hierarchy (i.e., eventually obtain a territory and matings). [41] In bottlenose dolphin groups, an individual's degree and betweenness centrality values may predict whether or not that individual will exhibit certain behaviors, like the use of side flopping and upside-down lobtailing to lead group traveling efforts; individuals with high betweenness values are more connected and can obtain more information, and thus are better suited to lead group travel and therefore tend to exhibit these signaling behaviors more than other group members. [42]

Social network analysis can also be used to describe the social organization within a species more generally, which frequently reveals important proximate mechanisms promoting the use of certain behavioral strategies. These descriptions are frequently linked to ecological properties (e.g., resource distribution). For example, network analyses revealed subtle differences in the group dynamics of two related equid fission-fusion species, Grevy's zebra and onagers, living in variable environments; Grevy's zebras show distinct preferences in their association choices when they fission into smaller groups, whereas onagers do not. [43] Similarly, researchers interested in primates have also utilized network analyses to compare social organizations across the diverse primate order, suggesting that using network measures (such as centrality, assortativity, modularity, and betweenness) may be useful in terms of explaining the types of social behaviors we see within certain groups and not others. [44]

Finally, social network analysis can also reveal important fluctuations in animal behaviors across changing environments. For example, network analyses in female chacma baboons (Papio hamadryas ursinus) revealed important dynamic changes across seasons that were previously unknown; instead of creating stable, long-lasting social bonds with friends, baboons were found to exhibit more variable relationships which were dependent on short-term contingencies related to group-level dynamics as well as environmental variability. [45] Changes in an individual's social network environment can also influence characteristics such as 'personality': for example, social spiders that huddle with bolder neighbors tend to increase also in boldness. [46] This is a very small set of broad examples of how researchers can use network analysis to study animal behavior. Research in this area is currently expanding very rapidly, especially since the broader development of animal-borne tags and computer vision can be used to automate the collection of social associations. [47] Social network analysis is a valuable tool for studying animal behavior across all animal species and has the potential to uncover new information about animal behavior and social ecology that was previously poorly understood.

DNA-DNA chromatin networks

Linear Interpolation Clustering on mm9 Mouse Hist1 Region GAM data.gif
DNA-DNA Chromatin Network of genomic loci as nodes with nodes of high normalized linkage disequilibrium clustering together over time

Within a nucleus, DNA is constantly in motion. Perpetual actions such as genome folding and Cohesin extrusion morph the shape of a genome in real time. The spatial location of strands of chromatin relative to each other plays an important role in the activation or suppression of certain genes. DNA-DNA Chromatin Networks help biologists to understand these interactions by analyzing commonalities amongst different loci. The size of a network can vary significantly, from a few genes to several thousand and thus network analysis can provide vital support in understanding relationships among different areas of the genome. As an example, analysis of spatially similar loci within the organization in a nucleus with Genome Architecture Mapping (GAM) can be used to construct a network of loci with edges representing highly linked genomic regions.

The first graphic showcases the Hist1 region of the mm9 mouse genome with each node representing genomic loci. Two nodes are connected by an edge if their linkage disequilibrium is greater than the average across all 81 genomic windows. The locations of the nodes within the graphic are randomly selected and the methodology of choosing edges yields a, simple to show, but rudimentary graphical representation of the relationships in the dataset. The second visual exemplifies the same information as the previous; However, the network starts with every loci placed sequentially in a ring configuration. It then pulls nodes together using linear interpolation by their linkage as a percentage. The figure illustrates strong connections between the center genomic windows as well as the edge loci at the beginning and end of the Hist1 region.

Modelling biological networks

Introduction

To draw useful information from a biological network, an understanding of the statistical and mathematical techniques of identifying relationships within a network is vital. Procedures to identify association, communities, and centrality within nodes in a biological network can provide insight into the relationships of whatever the nodes represent whether they are genes, species, etc. Formulation of these methods transcends disciplines and relies heavily on graph theory, computer science, and bioinformatics.

Association

Using X and Y as variables, the first graph shows a very high correlation, the middle graph shows a fair correlation, and the third shows no/little correlation. Strong--weak--no-correlation.png
Using X and Y as variables, the first graph shows a very high correlation, the middle graph shows a fair correlation, and the third shows no/little correlation.

There are many different ways to measure the relationships of nodes when analyzing a network. In many cases, the measure used to find nodes that share similarity within a network is specific to the application it is being used. One of the types of measures that biologists utilize is correlation which specifically centers around the linear relationship between two variables. [48] As an example, weighted gene co-expression network analysis uses Pearson correlation to analyze linked gene expression and understand genetics at a systems level. [49] Another measure of correlation is linkage disequilibrium. Linkage disequilibrium describes the non-random association of genetic sequences among loci in a given chromosome. [50] An example of its use is in detecting relationships in GAM data across genomic intervals based upon detection frequencies of certain loci. [51]

Centrality

The concept of centrality can be extremely useful when analyzing biological network structures. There are many different methods to measure centrality such as betweenness, degree, Eigenvector, and Katz centrality. Every type of centrality technique can provide different insights on nodes in a particular network; However, they all share the commonality that they are to measure the prominence of a node in a network. [52] In 2005, Researchers at Harvard Medical School utilized centrality measures with the yeast protein interaction network. They found that proteins that exhibited high Betweenness centrality were more essential and translated closely to a given protein's evolutionary age. [53]

Communities

The graphic displays a food web of Secaucus High School Marsh without grouping/communities (left) and the food web with communities (right). Salt marsh food web.png
The graphic displays a food web of Secaucus High School Marsh without grouping/communities (left) and the food web with communities (right).

Studying the community structure of a network by subdividing groups of nodes into like-regions can be an integral tool for bioinformatics when exploring data as a network. [54] A food web of The Secaucus High School Marsh exemplifies the benefits of grouping as the relationships between nodes are far easier to analyze with well-made communities. While the first graphic is hard to visualize, the second provides a better view of the pockets of highly connected feeding relationships that would be expected in a food web. The problem of community detection is still an active problem. Scientists and graph theorists continuously discover new ways of sub sectioning networks and thus a plethora of different algorithms exist for creating these relationships. [55] Like many other tools that biologists utilize to understand data with network models, every algorithm can provide its own unique insight and may vary widely on aspects such as accuracy or time complexity of calculation. In 2002, a food web of marine mammals in the Chesapeake Bay was divided into communities by biologists using a community detection algorithm based on neighbors of nodes with high degree centrality. The resulting communities displayed a sizable split in pelagic and benthic organisms. [56] Two very common community detection algorithms for biological networks are the Louvain Method and Leiden Algorithm.

The Louvain method is a greedy algorithm that attempts to maximize modularity, which favors heavy edges within communities and sparse edges between, within a set of nodes. The algorithm starts by each node being in its own community and iteratively being added to the particular node's community that favors a higher modularity. [57] [58] Once no modularity increase can occur by joining nodes to a community, a new weighted network is constructed of communities as nodes with edges representing between-community edges and loops representing edges within a community. The process continues until no increase in modularity occurs. [59] While the Louvain Method provides good community detection, there are a few ways that it is limited. By mainly focusing on maximizing a given measure of modularity, it may be led to craft badly connected communities by degrading a model for the sake of maximizing a modularity metric; However, the Louvain Method performs fairly and is can be easy to understand comparatively to many other community detection algorithms. [58]

The Leiden Algorithm expands on the Louvain Method by providing a number of improvements. When joining nodes to a community, only neighborhoods that have been recently changed are considered. This greatly improves the speed of merging nodes. Another optimization is in the refinement phase in-which the algorithm randomly chooses for a node from a set of communities to merge with. This allows for greater depth in choosing communities as Louvain solely focuses on maximizing the modularity that was chosen. The Leiden algorithm, while more complex than Louvain, performs faster with better community detection and can be a valuable tool for identifying groups. [58]

See also

Related Research Articles

<span class="mw-page-title-main">Bioinformatics</span> Computational analysis of large, complex sets of biological data

Bioinformatics is an interdisciplinary field of science that develops methods and software tools for understanding biological data, especially when the data sets are large and complex. Bioinformatics uses biology, chemistry, physics, computer science, computer programming, information engineering, mathematics and statistics to analyze and interpret biological data. The subsequent process of analyzing and interpreting data is referred to as computational biology.

<span class="mw-page-title-main">Computational biology</span> Branch of biology

Computational biology refers to the use of data analysis, mathematical modeling and computational simulations to understand biological systems and relationships. An intersection of computer science, biology, and big data, the field also has foundations in applied mathematics, chemistry, and genetics. It differs from biological computing, a subfield of computer science and engineering which uses bioengineering to build computers.

<span class="mw-page-title-main">Gene regulatory network</span> Collection of molecular regulators

A generegulatory network (GRN) is a collection of molecular regulators that interact with each other and with other substances in the cell to govern the gene expression levels of mRNA and proteins which, in turn, determine the function of the cell. GRN also play a central role in morphogenesis, the creation of body structures, which in turn is central to evolutionary developmental biology (evo-devo).

<span class="mw-page-title-main">Protein complex</span> Type of stable macromolecular complex

A protein complex or multiprotein complex is a group of two or more associated polypeptide chains. Protein complexes are distinct from multidomain enzymes, in which multiple catalytic domains are found in a single polypeptide chain.

<span class="mw-page-title-main">Network theory</span> Study of graphs as a representation of relations between discrete objects

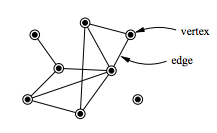
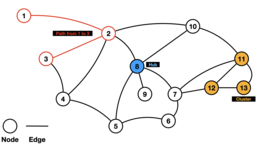
In mathematics, computer science and network science, network theory is a part of graph theory. It defines networks as graphs where the vertices or edges possess attributes. Network theory analyses these networks over the symmetric relations or asymmetric relations between their (discrete) components.

<span class="mw-page-title-main">Interactome</span> Complete set of molecular interactions in a biological cell

In molecular biology, an interactome is the whole set of molecular interactions in a particular cell. The term specifically refers to physical interactions among molecules but can also describe sets of indirect interactions among genes.

<span class="mw-page-title-main">Metagenomics</span> Study of genes found in the environment

Metagenomics is the study of genetic material recovered directly from environmental or clinical samples by a method called sequencing. The broad field may also be referred to as environmental genomics, ecogenomics, community genomics or microbiomics.

<span class="mw-page-title-main">Protein–protein interaction</span> Physical interactions and constructions between multiple proteins

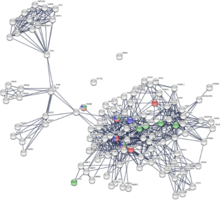
Protein–protein interactions (PPIs) are physical contacts of high specificity established between two or more protein molecules as a result of biochemical events steered by interactions that include electrostatic forces, hydrogen bonding and the hydrophobic effect. Many are physical contacts with molecular associations between chains that occur in a cell or in a living organism in a specific biomolecular context.

<span class="mw-page-title-main">Community structure</span> Concept in graph theory

In the study of complex networks, a network is said to have community structure if the nodes of the network can be easily grouped into sets of nodes such that each set of nodes is densely connected internally. In the particular case of non-overlapping community finding, this implies that the network divides naturally into groups of nodes with dense connections internally and sparser connections between groups. But overlapping communities are also allowed. The more general definition is based on the principle that pairs of nodes are more likely to be connected if they are both members of the same community(ies), and less likely to be connected if they do not share communities. A related but different problem is community search, where the goal is to find a community that a certain vertex belongs to.

<span class="mw-page-title-main">Biological network inference</span>

Biological network inference is the process of making inferences and predictions about biological networks. By using these networks to analyze patterns in biological systems, such as food-webs, we can visualize the nature and strength of these interactions between species, DNA, proteins, and more.

<span class="mw-page-title-main">Network motif</span> Type of sub-graph

Network motifs are recurrent and statistically significant subgraphs or patterns of a larger graph. All networks, including biological networks, social networks, technological networks and more, can be represented as graphs, which include a wide variety of subgraphs.

<span class="mw-page-title-main">Modularity (networks)</span> Measure of network community structure

Modularity is a measure of the structure of networks or graphs which measures the strength of division of a network into modules. Networks with high modularity have dense connections between the nodes within modules but sparse connections between nodes in different modules. Modularity is often used in optimization methods for detecting community structure in networks. Biological networks, including animal brains, exhibit a high degree of modularity. However, modularity maximization is not statistically consistent, and finds communities in its own null model, i.e. fully random graphs, and therefore it cannot be used to find statistically significant community structures in empirical networks. Furthermore, it has been shown that modularity suffers a resolution limit and, therefore, it is unable to detect small communities.

In computational biology, power graph analysis is a method for the analysis and representation of complex networks. Power graph analysis is the computation, analysis and visual representation of a power graph from a graph (networks).

<span class="mw-page-title-main">Weighted network</span> Network where the ties among nodes have weights assigned to them

A weighted network is a network where the ties among nodes have weights assigned to them. A network is a system whose elements are somehow connected. The elements of a system are represented as nodes and the connections among interacting elements are known as ties, edges, arcs, or links. The nodes might be neurons, individuals, groups, organisations, airports, or even countries, whereas ties can take the form of friendship, communication, collaboration, alliance, flow, or trade, to name a few.

A neutral network is a set of genes all related by point mutations that have equivalent function or fitness. Each node represents a gene sequence and each line represents the mutation connecting two sequences. Neutral networks can be thought of as high, flat plateaus in a fitness landscape. During neutral evolution, genes can randomly move through neutral networks and traverse regions of sequence space which may have consequences for robustness and evolvability.

<span class="mw-page-title-main">Gene co-expression network</span>

A gene co-expression network (GCN) is an undirected graph, where each node corresponds to a gene, and a pair of nodes is connected with an edge if there is a significant co-expression relationship between them. Having gene expression profiles of a number of genes for several samples or experimental conditions, a gene co-expression network can be constructed by looking for pairs of genes which show a similar expression pattern across samples, since the transcript levels of two co-expressed genes rise and fall together across samples. Gene co-expression networks are of biological interest since co-expressed genes are controlled by the same transcriptional regulatory program, functionally related, or members of the same pathway or protein complex.

Network medicine is the application of network science towards identifying, preventing, and treating diseases. This field focuses on using network topology and network dynamics towards identifying diseases and developing medical drugs. Biological networks, such as protein-protein interactions and metabolic pathways, are utilized by network medicine. Disease networks, which map relationships between diseases and biological factors, also play an important role in the field. Epidemiology is extensively studied using network science as well; social networks and transportation networks are used to model the spreading of disease across populations. Network medicine is a medically focused area of systems biology.

The human interactome is the set of protein–protein interactions that occur in human cells. The sequencing of reference genomes, in particular the Human Genome Project, has revolutionized human genetics, molecular biology, and clinical medicine. Genome-wide association study results have led to the association of genes with most Mendelian disorders, and over 140 000 germline mutations have been associated with at least one genetic disease. However, it became apparent that inherent to these studies is an emphasis on clinical outcome rather than a comprehensive understanding of human disease; indeed to date the most significant contributions of GWAS have been restricted to the “low-hanging fruit” of direct single mutation disorders, prompting a systems biology approach to genomic analysis. The connection between genotype and phenotype remain elusive, especially in the context of multigenic complex traits and cancer. To assign functional context to genotypic changes, much of recent research efforts have been devoted to the mapping of the networks formed by interactions of cellular and genetic components in humans, as well as how these networks are altered by genetic and somatic disease.

<span class="mw-page-title-main">Pathway analysis</span>

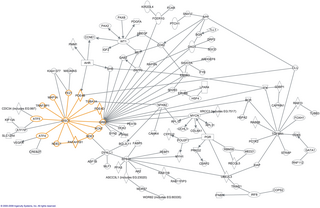
Pathway is the term from molecular biology for a curated schematic representation of a well characterized segment of the molecular physiological machinery, such as a metabolic pathway describing an enzymatic process within a cell or tissue or a signaling pathway model representing a regulatory process that might, in its turn, enable a metabolic or another regulatory process downstream. A typical pathway model starts with an extracellular signaling molecule that activates a specific receptor, thus triggering a chain of molecular interactions. A pathway is most often represented as a relatively small graph with gene, protein, and/or small molecule nodes connected by edges of known functional relations. While a simpler pathway might appear as a chain, complex pathway topologies with loops and alternative routes are much more common. Computational analyses employ special formats of pathway representation. In the simplest form, however, a pathway might be represented as a list of member molecules with order and relations unspecified. Such a representation, generally called Functional Gene Set (FGS), can also refer to other functionally characterised groups such as protein families, Gene Ontology (GO) and Disease Ontology (DO) terms etc. In bioinformatics, methods of pathway analysis might be used to identify key genes/ proteins within a previously known pathway in relation to a particular experiment / pathological condition or building a pathway de novo from proteins that have been identified as key affected elements. By examining changes in e.g. gene expression in a pathway, its biological activity can be explored. However most frequently, pathway analysis refers to a method of initial characterization and interpretation of an experimental condition that was studied with omics tools or genome-wide association study. Such studies might identify long lists of altered genes. A visual inspection is then challenging and the information is hard to summarize, since the altered genes map to a broad range of pathways, processes, and molecular functions. In such situations, the most productive way of exploring the list is to identify enrichment of specific FGSs in it. The general approach of enrichment analyses is to identify FGSs, members of which were most frequently or most strongly altered in the given condition, in comparison to a gene set sampled by chance. In other words, enrichment can map canonical prior knowledge structured in the form of FGSs to the condition represented by altered genes.

Machine learning in bioinformatics is the application of machine learning algorithms to bioinformatics, including genomics, proteomics, microarrays, systems biology, evolution, and text mining.

References

  1. 1 2 Koutrouli, Mikaela; Karatzas, Evangelos; Paez-Espino, David; Pavlopoulos, Georgios A. (2020). "A Guide to Conquer the Biological Network Era Using Graph Theory". Frontiers in Bioengineering and Biotechnology. 8: 34. doi: 10.3389/fbioe.2020.00034 . ISSN   2296-4185. PMC   7004966 . PMID   32083072.
  2. Emmert-Streib, Frank; Dehmer, Matthias (2015). "Biological networks: the microscope of the twenty-first century?". Frontiers in Genetics. 6: 307. doi: 10.3389/fgene.2015.00307 . ISSN   1664-8021. PMC   4602153 . PMID   26528327.
  3. Searls, D. (1993). Artificial intelligence and molecular biology. Cambridge, MA: MIT Press.
  4. Habibi, Iman; Emamian, Effat S.; Abdi, Ali (2014-01-01). "Quantitative analysis of intracellular communication and signaling errors in signaling networks". BMC Systems Biology. 8: 89. doi: 10.1186/s12918-014-0089-z . ISSN   1752-0509. PMC   4255782 . PMID   25115405.
  5. Mashaghi, A.; et al. (2004). "Investigation of a protein complex network". European Physical Journal. 41 (1): 113–121. arXiv: cond-mat/0304207 . Bibcode:2004EPJB...41..113M. doi:10.1140/epjb/e2004-00301-0. S2CID   9233932.
  6. Smits, Arne H.; Vermeulen, Michiel (2016). "Characterizing Protein–Protein Interactions Using Mass Spectrometry: Challenges and Opportunities". Trends in Biotechnology. 34 (10): 825–834. doi:10.1016/j.tibtech.2016.02.014. hdl: 2066/161800 . ISSN   0167-7799. PMID   26996615.
  7. Zanzoni, A; Montecchi-Palazzi, L; Quondam, M; Ausiello, G; Helmer-Citterich, M; Cesareni, G (Feb 20, 2002). "MINT: a Molecular INTeraction database". FEBS Letters. 513 (1): 135–40. doi:10.1016/s0014-5793(01)03293-8. PMC   1751541 . PMID   11911893.
  8. Kerrien, S.; Aranda, B.; Breuza, L.; Bridge, A.; Broackes-Carter, F.; Chen, C.; Duesbury, M.; Dumousseau, M.; Feuermann, M.; Hinz, U.; Jandrasits, C.; Jimenez, R. C.; Khadake, J.; Mahadevan, U.; Masson, P.; Pedruzzi, I.; Pfeiffenberger, E.; Porras, P.; Raghunath, A.; Roechert, B.; Orchard, S.; Hermjakob, H. (24 November 2011). "The IntAct molecular interaction database in 2012". Nucleic Acids Research. 40 (D1): D841–D846. doi:10.1093/nar/gkr1088. PMC   3245075 . PMID   22121220.
  9. Oughtred, Rose; Rust, Jennifer; Chang, Christie; Breitkreutz, Bobby-Joe; Stark, Chris; Willems, Andrew; Boucher, Lorrie; Leung, Genie; Kolas, Nadine; Zhang, Frederick; Dolma, Sonam; Coulombe-Huntington, Jasmin; Chatr-aryamontri, Andrew; Dolinski, Kara; Tyers, Mike (2020). "TheBioGRIDdatabase: A comprehensive biomedical resource of curated protein, genetic, and chemical interactions". Protein Science. 30 (1): 187–200. doi: 10.1002/pro.3978 . ISSN   0961-8368. PMC   7737760 . PMID   33070389.
  10. Jansen, R. (2003). "A Bayesian Networks Approach for Predicting Protein-Protein Interactions from Genomic Data". Science. 302 (5644): 449–453. Bibcode:2003Sci...302..449J. doi:10.1126/science.1087361. ISSN   0036-8075. PMID   14564010. S2CID   5293611.
  11. Sharan, R.; et al. (2005). "Conserved patterns of protein interaction in multiple species". Proceedings of the National Academy of Sciences of the United States of America. 102 (6): 1974–1979. Bibcode:2005PNAS..102.1974S. doi: 10.1073/pnas.0409522102 . PMC   548573 . PMID   15687504.
  12. Jeong, H.; et al. (2001). "Lethality and centrality in protein networks". Nature. 411 (6833): 41–42. arXiv: cond-mat/0105306 . Bibcode:2001Natur.411...41J. doi:10.1038/35075138. PMID   11333967. S2CID   258942.
  13. Vaquerizas, J.-M.; et al. (2009). "A census of human transcription factors: function, expression and evolution". Nature Reviews Genetics. 10 (4): 252–263. doi:10.1038/nrg2538. PMID   19274049. S2CID   3207586.
  14. Jia, Bochao; Xu, Suwa; Xiao, Guanghua; Lamba, Vishal; Liang, Faming (2017). "Learning gene regulatory networks from next generation sequencing data". Biometrics. 73 (4): 1221–1230. doi:10.1111/biom.12682. ISSN   0006-341X. PMC   6258556 . PMID   28294287.
  15. Angelini, Claudia; Costa, Valerio (2014). "Understanding gene regulatory mechanisms by integrating ChIP-seq and RNA-seq data: statistical solutions to biological problems". Frontiers in Cell and Developmental Biology. 2: 51. doi: 10.3389/fcell.2014.00051 . ISSN   2296-634X. PMC   4207007 . PMID   25364758.
  16. Zheng, Peng-Fei; Chen, Lu-Zhu; Guan, Yao-Zong; Liu, Peng (2021). "Weighted gene co-expression network analysis identifies specific modules and hub genes related to coronary artery disease". Scientific Reports. 11 (1): 6711. Bibcode:2021NatSR..11.6711Z. doi: 10.1038/s41598-021-86207-0 . ISSN   2045-2322. PMC   7988178 . PMID   33758323.
  17. Proulx, S.R.; et al. (2005). "Network thinking in ecology and evolution". Trends in Ecology and Evolution. 20 (6): 345–353. doi:10.1016/j.tree.2005.04.004. PMID   16701391.
  18. Cargnello, M.; Roux, P. P. (2011). "Activation and Function of the MAPKs and Their Substrates, the MAPK-Activated Protein Kinases". Microbiology and Molecular Biology Reviews. 75 (1): 50–83. doi: 10.1128/MMBR.00031-10 . ISSN   1092-2172. PMC   3063353 . PMID   21372320.
  19. Sevimoglu, Tuba; Arga, Kazim Yalcin (2014). "The role of protein interaction networks in systems biomedicine". Computational and Structural Biotechnology Journal. 11 (18): 22–27. doi: 10.1016/j.csbj.2014.08.008 . ISSN   2001-0370. PMC   4212283 . PMID   25379140.
  20. Arga, K Yalçın; Önsan, Z İlsen; Kırdar, Betül; Ülgen, Kutlu Ö; Nielsen, Jens (2007). "Understanding signaling in yeast: Insights from network analysis". Biotechnology and Bioengineering. 97 (5): 1246–1258. doi:10.1002/bit.21317. ISSN   0006-3592. PMID   17252576. S2CID   38896124.
  21. Browaeys, Robin; Saelens, Wouter; Saeys, Yvan (February 2020). "NicheNet: modeling intercellular communication by linking ligands to target genes". Nature Methods. 17 (2): 159–162. doi:10.1038/s41592-019-0667-5. PMID   31819264. S2CID   256836571.
  22. Bullmore, E. & O. Sporns (2009). "Complex brain networks: graph theoretical analysis of structural and functional systems". Nature Reviews Neuroscience. 10 (3): 186–198. doi:10.1038/nrn2575. PMID   19190637. S2CID   205504722.
  23. Stephan, K.E.; et al. (2000). "Computational analysis of functional connectivity between areas of primate cerebral cortex". Philosophical Transactions of the Royal Society B . 355 (1393): 111–126. doi:10.1098/rstb.2000.0552. PMC   1692715 . PMID   10703047.
  24. Jestrović, Iva; Coyle, James L; Perera, Subashan; Sejdić, Ervin (2016-12-01). "Functional connectivity patterns of normal human swallowing: difference among various viscosity swallows in normal and chin-tuck head positions". Brain Research. 1652: 158–169. doi:10.1016/j.brainres.2016.09.041. ISSN   0006-8993. PMC   5102805 . PMID   27693396.
  25. MacArthur, R.H. (1955). "Fluctuations in animal populations and a measure of community stability". Ecology. 36 (3): 533–536. Bibcode:1955Ecol...36..533M. doi:10.2307/1929601. JSTOR   1929601.
  26. Dunne, J.A.; et al. (2002). "Network structure and biodiversity loss in food webs: robustness increases with connectance". Ecology Letters. 5 (4): 558–567. Bibcode:2002EcolL...5..558D. doi:10.1046/j.1461-0248.2002.00354.x. S2CID   2114852.
  27. Bascompte, J. (2009). "Disentangling the web of life". Science. 325 (5939): 416–419. Bibcode:2009Sci...325..416B. doi:10.1126/science.1170749. PMID   19628856. S2CID   2249052.
  28. Krause, J.; et al. (2009). "Animal social networks: an introduction". Behav. Ecol. Sociobiol. 63 (7): 967–973. doi:10.1007/s00265-009-0747-0. S2CID   24523607.
  29. 1 2 Memmott, J.; et al. (2004). "Tolerance of pollination networks to species extinctions". Philosophical Transactions of the Royal Society B . 271 (1557): 2605–261. doi:10.1098/rspb.2004.2909. PMC   1691904 . PMID   15615687.
  30. 1 2 Olesen, J.; et al. (2007). "The modularity of pollination networks". PNAS. 104 (50): 19891–19896. Bibcode:2007PNAS..10419891O. doi: 10.1073/pnas.0706375104 . PMC   2148393 . PMID   18056808.
  31. Campbell, V.; et al. (2011). "Experimental design and the outcome and interpretation of diversity-stability relations". Oikos. 120 (3): 399–408. Bibcode:2011Oikos.120..399C. doi:10.1111/j.1600-0706.2010.18768.x.
  32. Lotze, H.; et al. (2011). "Historical changes in marine resources, food-web structure and ecosystem functioning in the Adriatic Sea, Mediterranean". Ecosystems. 14 (2): 198–222. Bibcode:2011Ecosy..14..198L. doi:10.1007/s10021-010-9404-8. S2CID   45894582.
  33. Romanuk, T.; et al. (2010). "Maintenance of positive diversity-stability relations along a gradient of environmental stress". PLOS ONE. 5 (4): e10378. Bibcode:2010PLoSO...510378R. doi: 10.1371/journal.pone.0010378 . PMC   2860506 . PMID   20436913.
  34. Briand, F. (1983). "Environmental control of food web structure". Ecology. 64 (2): 253–263. Bibcode:1983Ecol...64..253B. doi:10.2307/1937073. JSTOR   1937073.
  35. Croft, D.P.; et al. (2004). "Social networks in the guppy (Poecilia reticulate)". Philosophical Transactions of the Royal Society B . 271 (Suppl): S516–S519. doi:10.1098/rsbl.2004.0206. PMC   1810091 . PMID   15801620.
  36. Krause, Jens; Lusseau, David; James, Richard (1 May 2009). "Animal social networks: an introduction". Behavioral Ecology and Sociobiology. 63 (7): 967–973. doi:10.1007/s00265-009-0747-0. S2CID   24523607.
  37. Dornhaus, A.; et al. (2006). "Benefits of recruitment in honey bees: Effects of ecology and colony size in an individual-based model". Behavioral Ecology. 17 (3): 336–344. doi: 10.1093/beheco/arj036 .
  38. Linksvayer, T.; et al. (2012). "Developmental evolution in social insects: Regulatory networks from genes to societies". Journal of Experimental Zoology Part B: Molecular and Developmental Evolution. 318 (3): 159–169. Bibcode:2012JEZB..318..159L. doi:10.1002/jez.b.22001. PMID   22544713.
  39. Mullen, R.; et al. (2009). "A review of ant algorithms". Expert Systems with Applications. 36 (6): 9608–9617. doi:10.1016/j.eswa.2009.01.020.
  40. Croft, Darren P.; Darden, Safi K.; Wey, Tina W. (2016). "Current directions in animal social networks". Current Opinion in Behavioral Sciences. 12: 52–58. doi:10.1016/j.cobeha.2016.09.001. hdl: 10871/23348 . S2CID   53195734.
  41. Ryder, T.B.; et al. (2008). "Social networks in the lek-mating wire-tailed manakin (Pipra filicauda)". Philosophical Transactions of the Royal Society B . 275 (1641): 1367–1374. doi:10.1098/rspb.2008.0205. PMC   2602714 . PMID   18381257.
  42. Lusseau, D. (2007). "Evidence for social role in a dolphin social network". Evolutionary Ecology. 21 (3): 357–366. arXiv: q-bio/0607048 . Bibcode:2007EvEco..21..357L. doi:10.1007/s10682-006-9105-0. S2CID   9748737.
  43. Sundaresan, S.; et al. (2007). "Network metrics reveal differences in social organization between two fission-fusion species, Grevy's zebra and onager". Oecologia. 151 (1): 140–149. Bibcode:2007Oecol.151..140S. doi:10.1007/s00442-006-0553-6. PMID   16964497. S2CID   8104281.
  44. Kasper, C.; Voelkl, B. (2009). "A social network analysis of primate groups". Primates. 50 (4): 343–356. doi:10.1007/s10329-009-0153-2. PMID   19533270. S2CID   9852394.
  45. Henzi, S.; et al. (2009). "Cyclicity in the structure of female baboon social networks". Behavioral Ecology and Sociobiology. 63 (7): 1015–1021. doi:10.1007/s00265-009-0720-y. S2CID   6021233.
  46. Hunt, E.R.; et al. (2018). "Social interactions shape individual and collective personality in social spiders". Proceedings of the Royal Society B. 285 (1886): 20181366. doi:10.1098/rspb.2018.1366. PMC   6158534 . PMID   30185649.
  47. Krause J, Krause S, Arlinghaus R, Psorakis I, Roberts S, Rutz C (2013). "Reality mining of animal social systems". Trends in Ecology and Evolution. 28 (9): 541–551. doi:10.1016/j.tree.2013.06.002. PMID   23856617. Archived from the original on 2023-02-04. Retrieved 2019-12-08.
  48. Haug, Mark Gerard. "measure of association". Encyclopedia Britannica, Invalid Date, https://www.britannica.com/topic/measure-of-association Archived 2023-02-04 at the Wayback Machine . Accessed 18 April 2022.
  49. Zhang, Bin and Steve Horvath. A General Framework for Weighted Gene Co-Expression Network Analysis. Statistical Applications in Genetics and Molecular Biology, vol. 4, no. 1, 2005, article 17. https://dibernardo.tigem.it/files/papers/2008/zhangbin-statappsgeneticsmolbio.pdf
  50. “Linkage Disequilibrium.” Linkage Disequilibrium - ISOGG Wiki, International Society of Genetic Genealogy, https://isogg.org/wiki/Linkage_disequilibrium Archived 2021-06-08 at the Wayback Machine .
  51. Beagrie, Robert A et al. “Complex multi-enhancer contacts captured by genome architecture mapping.” Nature vol. 543,7646 (2017): 519-524. doi:10.1038/nature21411
  52. “Centrality Measure.” Centrality Measure - an Overview | ScienceDirect Topics, ScienceDirect, https://www.sciencedirect.com/topics/computer-science/centrality-measure Archived 2022-04-18 at the Wayback Machine .
  53. Joy MP, Brock A, Ingber DE, Huang S. High-betweenness proteins in the yeast protein interaction network. J Biomed Biotechnol. 2005 Jun 30;2005(2):96-103. doi: 10.1155/JBB.2005.96. PMID 16046814; PMCID: PMC1184047.
  54. Porter, Mason A et al. “Communities in Networks” Notices of the AMS vol. 56, no. 9(2009): 1082-1097. https://www.ams.org/notices/200909/rtx090901082p.pdf Archived 2021-06-13 at the Wayback Machine
  55. “Community Detection.” Community Detection - an Overview | ScienceDirect Topics, ScienceDirect, https://www.sciencedirect.com/topics/computer-science/community-detection.
  56. Girvan, M, and M E J Newman. “Community structure in social and biological networks.” Proceedings of the National Academy of Sciences of the United States of America vol. 99,12 (2002): 7821-6. doi:10.1073/pnas.122653799
  57. Markovitch, Omer, and Natalio Krasnogor. “Predicting species emergence in simulated complex pre-biotic networks.” PLOS ONE vol. 13,2 e0192871. 15 Feb. 2018, doi:10.1371/journal.pone.0192871
  58. 1 2 3 Traag, V.A., Waltman, L. & van Eck, N.J. From Louvain to Leiden: guaranteeing well-connected communities. Sci Rep 9, 5233 (2019). https://doi.org/10.1038/s41598-019-41695-z Archived 2023-02-04 at the Wayback Machine
  59. Ozaki, Naoto. Tezuka Hiroshi. Inaba, Mary. “A Simple Acceleration Method for the Louvain Algorithm” International Journal of Computer and Electrical Engineering, vol. 8, no. 3, 3 June 2016, page numbers pp 207-218. http://www.ijcee.org/vol8/927-A023.pdf Archived 2023-02-04 at the Wayback Machine

Books