Climate Change Performance Index

Last updated
2023 Climate Change Performance Index Climate Change Performance Index (2023).svg
2023 Climate Change Performance Index

The Climate Change Performance Index (CCPI) is a scoring system designed by the German environmental and development organisation Germanwatch e.V. to enhance transparency in international climate politics. On the basis of standardised criteria, the index evaluates and compares the climate protection performance of 63 countries and the European Union (EU) (status CCPI 2022), which are together responsible for more than 90% of global greenhouse gas (GHG) emissions. [1]

Contents

The CCPI was first published in 2005 and an updated version is presented at the UN Climate Change Conference annually. Germanwatch publishes the index in cooperation with the NewClimate Institute and Climate Action Network International and with financial support from Barthel Foundation. [2] The most important results are available in German, English, French and Spanish.

Methodology

In 2017, the underlying methodology of the CCPI was revised and adapted to the new climate policy framework of the Paris Agreement from 2015. [3] The CCPI was extended in order to include the measurement of a country’s progress towards the Nationally Determined Contributions (NDCs) and the country’s 2030 targets. The national performances are assessed based on 14 indicators in the following four categories:

1. GHG emissions (weighting 40%)

2. Renewable energy (weighting 20%)

3. Energy use (weighting 20%)

4. Climate policy (weighting 20%)

The three categories "GHG emissions", "renewable energy" and "energy use" are each defined by four equally weighted indicators: (1) current level, (2) recent developments (5-year trend), (3) 2 °C compatibility of the current performance, and (4) 2 °C compatibility of 2030 target. These 12 indicators are complemented by two indicators, measuring the country's performance regarding its national climate policy framework and implementation as well as regarding international climate diplomacy in the category "climate policy". The data for the "climate policy" category is assessed annually in a comprehensive research study. Its basis is the performance rating by climate change experts from non-governmental organisations, universities and think tanks within the countries that are evaluated. In a questionnaire, the respondents give a rating on the most important measures of their governments. The results are rated as very high, high, medium, low, or very low. [4]

Results

The most recent results illustrate the main regional differences in climate protection efforts and performance within the 57 evaluated countries and the EU. According to the CCPI, none of the countries has yet achieved a performance across all indicators that can be qualified as very high, because no country fulfills the requirements to limit global warming to well below 2 °C, as agreed in the Paris Agreement. This is why the first three places in the final ranking remain unoccupied. In 2023, the CCPI did not evaluate the performance of Ukraine due to the 2022 Russian invasion of Ukraine. In the CCPI index for 2023, Denmark led the index followed by Sweden and Chile. [5] The last three were Iran, Saudi Arabia and Kazakhstan. [6] [7] [lower-alpha 1]

2023 results

RankCountryScore
1--
2--
3--
4Flag of Denmark.svg  Denmark 79.61
5Flag of Sweden.svg  Sweden 73.28
6Flag of Chile.svg  Chile 69.54
7Flag of Morocco.svg  Morocco 67.44
8Flag of India.svg  India 67.35
9Flag of Estonia.svg  Estonia 65.14
10Flag of Norway.svg  Norway 64.47
11Flag of the United Kingdom.svg  United Kingdom 63.07
12Flag of the Philippines.svg  Philippines 62.75
13Flag of the Netherlands.svg  Netherlands 62.24
14Flag of Portugal.svg  Portugal 61.55
15Flag of Finland.svg  Finland 61.24
16Flag of Germany.svg  Germany 61.11
17Flag of Luxembourg.svg  Luxembourg 60.76
18Flag of Malta.svg  Malta 60.42
19Flag of Europe.svg  European Union (27)59.96
20Flag of Egypt.svg  Egypt 59.37
21Flag of Lithuania.svg  Lithuania 59.21
22Flag of Switzerland (Pantone).svg   Switzerland 58.61
23Flag of Spain.svg  Spain 58.59
24Flag of Greece.svg  Greece 57.52
25Flag of Latvia.svg  Latvia 56.81
26Flag of Indonesia.svg  Indonesia 54.59
27Flag of Colombia.svg  Colombia 54.50
28Flag of France.svg  France 52.97
29Flag of Italy.svg  Italy 52.90
30Flag of Croatia.svg  Croatia 52.04
31Flag of Mexico.svg  Mexico 51.77
32Flag of Austria.svg  Austria 51.56
33Flag of New Zealand.svg  New Zealand 50.55
34Flag of Slovakia.svg  Slovak Republic 50.12
35Flag of Cyprus.svg  Cyprus 49.39
36Flag of Bulgaria.svg  Bulgaria 49.15
37Flag of Ireland.svg  Ireland 48.47
38Flag of Brazil.svg  Brazil 48.39
39Flag of Belgium (civil).svg  Belgium 48.38
40Flag of Vietnam.svg  Viet Nam 48.31
41Flag of Slovenia.svg  Slovenia 48.16
42Flag of Thailand.svg  Thailand 47.23
43Flag of Romania.svg  Romania 47.09
44Flag of South Africa.svg  South Africa 45.69
45Flag of the Czech Republic.svg  Czech Republic 44.16
46Flag of Belarus.svg  Belarus 43.69
47Flag of Turkey.svg  Turkey 43.32
48Flag of Algeria.svg  Algeria 42.26
49Flag of Argentina.svg  Argentina 41.19
50Flag of Japan.svg  Japan 40.85
51Flag of the People's Republic of China.svg  China 38.80
52Flag of the United States.svg  United States 38.53
53Flag of Hungary.svg  Hungary 38.51
54Flag of Poland.svg  Poland 37.94
55Flag of Australia (converted).svg  Australia 36.26
56Flag of Malaysia.svg  Malaysia 33.51
57Flag of the Republic of China.svg  Taiwan 28.35
58Flag of Canada (Pantone).svg  Canada 26.47
59Flag of Russia.svg  Russian Federation 25.28
60Flag of South Korea.svg  South Korea 24.91
61Flag of Kazakhstan.svg  Kazakhstan 24.61
62Flag of Saudi Arabia.svg  Saudi Arabia 22.41
63Flag of Iran.svg  Islamic Republic of Iran 18.77

2022 results

RankCountryScore
1--
2--
3--
4Flag of Denmark.svg  Denmark 76.67
5Flag of Sweden.svg  Sweden 74.22
6Flag of Norway.svg  Norway 73.29
7Flag of the United Kingdom.svg  United Kingdom 73.09
8Flag of Morocco.svg  Morocco 71.60
9Flag of Chile.svg  Chile 69.51
10Flag of India.svg  India 69.20
11Flag of Lithuania.svg  Lithuania 64.89
12Flag of Malta.svg  Malta 64.18
13Flag of Germany.svg  Germany 63.53
14Flag of Finland.svg  Finland 62.41
15Flag of Switzerland (Pantone).svg   Switzerland 61.70
16Flag of Portugal.svg  Portugal 61.11
17Flag of France.svg  France 61.01
18Flag of Luxembourg.svg  Luxembourg 60.80
19Flag of the Netherlands.svg  Netherlands 60.44
20Flag of Ukraine.svg  Ukraine 60.40
21Flag of Egypt.svg  Egypt 59.74
22Flag of Europe.svg  European Union (27)59.21
23Flag of the Philippines.svg  Philippines 58.98
24Flag of Greece.svg  Greece 58.22
25Flag of Colombia.svg  Colombia 57.87
26Flag of Latvia.svg  Latvia 57.73
27Flag of Indonesia.svg  Indonesia 57.17
28Flag of Mexico.svg  Mexico 56.05
29Flag of Croatia.svg  Croatia 55.96
30Flag of Italy.svg  Italy 55.39
31Flag of Thailand.svg  Thailand 55.01
32Flag of Estonia.svg  Estonia 54.98
33Flag of Brazil.svg  Brazil 54.86
34Flag of Spain.svg  Spain 54.35
35Flag of New Zealand.svg  New Zealand 54.03
36Flag of Romania.svg  Romania 52.43
37Flag of Austria.svg  Austria 52.35
38Flag of the People's Republic of China.svg  China 52.20
39Flag of South Africa.svg  South Africa 51.13
40Flag of Slovakia.svg  Slovak Republic 50.67
41Flag of Turkey.svg  Turkey 50.53
42Flag of Cyprus.svg  Cyprus 50.52
43Flag of Vietnam.svg  Viet Nam 49.21
44Flag of Bulgaria.svg  Bulgaria 48.71
45Flag of Japan.svg  Japan 48.53
46Flag of Ireland.svg  Ireland 47.86
47Flag of Argentina.svg  Argentina 47.08
48Flag of Belarus.svg  Belarus 46.66
49Flag of Belgium (civil).svg  Belgium 45.90
50Flag of Slovenia.svg  Slovenia 43.28
51Flag of the Czech Republic.svg  Czech Republic 42.15
52Flag of Poland.svg  Poland 40.63
53Flag of Hungary.svg  Hungary 40.41
54Flag of Algeria.svg  Algeria 39.91
55Flag of the United States.svg  United States 37.39
56Flag of Russia.svg  Russian Federation 34.73
57Flag of Malaysia.svg  Malaysia 33.74
58Flag of the Republic of China.svg  Taiwan 30.70
59Flag of Australia (converted).svg  Australia 30.06
60Flag of South Korea.svg  South Korea 26.74
61Flag of Canada (Pantone).svg  Canada 26.03
62Flag of Iran.svg  Islamic Republic of Iran 25.66
63Flag of Saudi Arabia.svg  Saudi Arabia 24.25
64Flag of Kazakhstan.svg  Kazakhstan 19.23

2021 results

RankCountryScore
1(None achieved 1-3 rank)
2
3
4Sweden74.42
5United Kingdom69.66
6Denmark69.42
7Morocco67.59
8Norway64.45
9Chile64.05
10India63.98

2020 results

RankCountryScore
1--
2--
3--
4Flag of Sweden.svg  Sweden 75.77
5Flag of Denmark.svg  Denmark 71.14
6Flag of Morocco.svg  Morocco 70.63
7Flag of the United Kingdom.svg  United Kingdom 69.80
8Flag of Lithuania.svg  Lithuania 66.22
9Flag of India.svg  India 66.02
10Flag of Finland.svg  Finland 63.25
11Flag of Chile.svg  Chile 62.88
12Flag of Norway.svg  Norway 61.14
13Flag of Luxembourg.svg  Luxembourg 60.91
14Flag of Malta.svg  Malta 60.60
15Flag of Latvia.svg  Latvia 60.75
16Flag of Switzerland (Pantone).svg   Switzerland 60.61
17Flag of Ukraine.svg  Ukraine 60.60
18Flag of France.svg  France 57.90
19Flag of Egypt.svg  Egypt 57.53
20Flag of Croatia.svg  Croatia 56.97
21Flag of Brazil.svg  Brazil 55.82
22Flag of Europe.svg  European Union (28)55.82
23Flag of Germany.svg  Germany 55.78
24Flag of Romania.svg  Romania 54.85
25Flag of Portugal.svg  Portugal 54.10
26Flag of Italy.svg  Italy 53.92
27Flag of Slovakia.svg  Slovak Republic 52.69
28Flag of Greece.svg  Greece 52.59
29Flag of the Netherlands.svg  Netherlands 50.89
30Flag of the People's Republic of China.svg  China 48.16
31Flag of Estonia.svg  Estonia 48.05
32Flag of Mexico.svg  Mexico 47.01
33Flag of Thailand.svg  Thailand 46.76
34Flag of Spain.svg  Spain 46.03
35Flag of Belgium (civil).svg  Belgium 45.73
36Flag of South Africa.svg  South Africa 45.67
37Flag of New Zealand.svg  New Zealand 45.67
38Flag of Austria.svg  Austria 44.74
39Flag of Indonesia.svg  Indonesia 44.65
40Flag of Belarus.svg  Belarus 44.18
41Flag of Ireland.svg  Ireland 44.04
42Flag of Argentina.svg  Argentina 43.77
43Flag of the Czech Republic.svg  Czech Republic 42.93
44Flag of Slovenia.svg  Slovenia 41.91
45Flag of Cyprus.svg  Cyprus 41.66
46Flag of Algeria.svg  Algeria 41.45
47Flag of Hungary.svg  Hungary 41.17
48Flag of Turkey.svg  Turkey 40.76
49Flag of Bulgaria.svg  Bulgaria 40.12
50Flag of Poland.svg  Poland 39.98
51Flag of Japan.svg  Japan 39.03
52Flag of Russia.svg  Russia 37.8
53Flag of Malaysia.svg  Malaysia 34.21
54Flag of Kazakhstan.svg  Kazakhstan 33.39
55Flag of Canada (Pantone).svg  Canada 31.01
56Flag of Australia (converted).svg  Australia 30.75
57Flag of Iran.svg  Iran 28.41
58Flag of South Korea.svg  South Korea 26.75
59Flag of the Republic of China.svg  Taiwan 23.33
60Flag of Saudi Arabia.svg  Saudi Arabia 23.03
61Flag of the United States.svg  United States 18.60

2019 results

RankCountryScore
1--
2--
3--
4Flag of Sweden.svg  Sweden 76
5Flag of Morocco.svg  Morocco 70.48
6Flag of Lithuania.svg  Lithuania 70.47
7Flag of Latvia.svg  Latvia 68.31
8Flag of the United Kingdom.svg  United Kingdom 65.92
9Flag of Switzerland (Pantone).svg   Switzerland 65.42
10Flag of Malta.svg  Malta 65.06
11Flag of India.svg  India 62.93
12Flag of Norway.svg  Norway 62.80
13Flag of Finland.svg  Finland 62.61
14Flag of Croatia.svg  Croatia 62.39
15Flag of Denmark.svg  Denmark 61.96
16Flag of Europe.svg  European Union (28)60.65
17Flag of Portugal.svg  Portugal 60.54
18Flag of Ukraine.svg  Ukraine 60.09
19Flag of Luxembourg.svg  Luxembourg 59.92
20Flag of Romania.svg  Romania 59.42
21Flag of France.svg  France 59.30
22Flag of Brazil.svg  Brazil 59.29
23Flag of Italy.svg  Italy 58.69
24Flag of Egypt.svg  Egypt 57.49
25Flag of Mexico.svg  Mexico 56.82
26Flag of Slovakia.svg  Slovak Republic 56.61
27Flag of Germany.svg  Germany 55.18
28Flag of the Netherlands.svg  Netherlands 54.11
29Flag of Belarus.svg  Belarus 53.31
30Flag of Greece.svg  Greece 50.86
31Flag of Belgium (civil).svg  Belgium 50.63
32Flag of the Czech Republic.svg  Czech Republic 49.73
33Flag of the People's Republic of China.svg  China 49.60
34Flag of Argentina.svg  Argentina 49.01
35Flag of Spain.svg  Spain 48.97
36Flag of Austria.svg  Austria 48.78
37Flag of Thailand.svg  Thailand 48.71
38Flag of Indonesia.svg  Indonesia 48.68
39Flag of South Africa.svg  South Africa 48.25
40Flag of Bulgaria.svg  Bulgaria 48.11
41Flag of Poland.svg  Poland 47.59
42Flag of Hungary.svg  Hungary 46.79
43Flag of Slovenia.svg  Slovenia 44.90
44Flag of New Zealand.svg  New Zealand 44.61
45Flag of Estonia.svg  Estonia 44.37
46Flag of Cyprus.svg  Cyprus 44.34
47Flag of Algeria.svg  Algeria 42.10
48Flag of Ireland.svg  Ireland 40.84
49Flag of Japan.svg  Japan 40.63
50Flag of Turkey.svg  Turkey 40.22
51Flag of Malaysia.svg  Malaysia 38.08
52Flag of Russia.svg  Russia 37.59
53Flag of Kazakhstan.svg  Kazakhstan 36.47
54Flag of Canada (Pantone).svg  Canada 34.26
55Flag of Australia (converted).svg  Australia 31.27
56Flag of the Republic of China.svg  Taiwan 28.80
57Flag of South Korea.svg  South Korea 28.53
58Flag of Iran.svg  Iran 23.94
59Flag of the United States.svg  United States 18.82
60Flag of Saudi Arabia.svg  Saudi Arabia 8.82

Related Research Articles

<span class="mw-page-title-main">Emission intensity</span> Emission rate of a pollutant

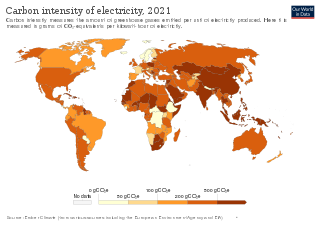
An emission intensity is the emission rate of a given pollutant relative to the intensity of a specific activity, or an industrial production process; for example grams of carbon dioxide released per megajoule of energy produced, or the ratio of greenhouse gas emissions produced to gross domestic product (GDP). Emission intensities are used to derive estimates of air pollutant or greenhouse gas emissions based on the amount of fuel combusted, the number of animals in animal husbandry, on industrial production levels, distances traveled or similar activity data. Emission intensities may also be used to compare the environmental impact of different fuels or activities. In some case the related terms emission factor and carbon intensity are used interchangeably. The jargon used can be different, for different fields/industrial sectors; normally the term "carbon" excludes other pollutants, such as particulate emissions. One commonly used figure is carbon intensity per kilowatt-hour (CIPK), which is used to compare emissions from different sources of electrical power.

<span class="mw-page-title-main">Carbon footprint</span> Concept to quantify greenhouse gas emissions from activities or products

A carbon footprint (or greenhouse gas footprint) is a calculated value or index that makes it possible to compare the total amount of greenhouse gases that an activity, product, company or country adds to the atmosphere. Carbon footprints are usually reported in tonnes of emissions (CO2-equivalent) per unit of comparison. Such units can be for example tonnes CO2-eq per year, per kilogram of protein for consumption, per kilometer travelled, per piece of clothing and so forth. A product's carbon footprint includes the emissions for the entire life cycle. These run from the production along the supply chain to its final consumption and disposal.

<span class="mw-page-title-main">Eco-Management and Audit Scheme</span>

The Eco-Management and Audit Scheme (EMAS) is a voluntary environmental management instrument, which was developed in 1993 by the European Commission. It enables organizations to assess, manage and continuously improve their environmental performance. The scheme is globally applicable and open to all types of private and public organizations. In order to register with EMAS, organisations must meet the requirements of the EU EMAS-Regulation. Currently, more than 4,600 organisations and more than 7,900 sites are EMAS registered.

<span class="mw-page-title-main">Environmental Performance Index</span> Climate Index

The Environmental Performance Index (EPI) is a method of quantifying and numerically marking the environmental performance of a state's policies. This index was developed from the Pilot Environmental Performance Index, first published in 2002, and designed to supplement the environmental targets set forth in the United Nations Millennium Development Goals.

<span class="mw-page-title-main">Carbon accounting</span> Processes used to measure how much carbon dioxide equivalents an organization sequesters or emits

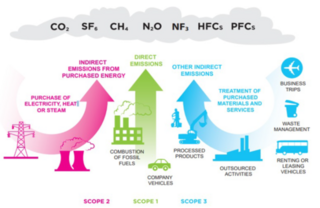
Carbon accounting is a framework of methods to measure and track how much greenhouse gas (GHG) an organization emits. It can also be used to track projects or actions to reduce emissions in sectors such as forestry or renewable energy. Corporations, cities and other groups use these techniques to help limit climate change. Organizations will often set an emissions baseline, create targets for reducing emissions, and track progress towards them. The accounting methods enable them to do this in a more consistent and transparent manner.

The Food and Agriculture Organization Corporate Statistical Database (FAOSTAT) website disseminates statistical data collected and maintained by the Food and Agriculture Organization (FAO). FAOSTAT data are provided as a time-series from 1961 in most domains for 245 countries in English, Spanish and French.

Greenhouse gas inventories are emission inventories of greenhouse gas emissions that are developed for a variety of reasons. Scientists use inventories of natural and anthropogenic (human-caused) emissions as tools when developing atmospheric models. Policy makers use inventories to develop strategies and policies for emissions reductions and to track the progress of those policies.

<span class="mw-page-title-main">Greenhouse gas emissions</span> Sources and amounts of greenhouse gases emitted to the atmosphere from human activities

Greenhouse gas (GHG) emissions from human activities intensify the greenhouse effect. This contributes to climate change. Carbon dioxide, from burning fossil fuels such as coal, oil, and natural gas, is one of the most important factors in causing climate change. The largest emitters are China followed by the United States. The United States has higher emissions per capita. The main producers fueling the emissions globally are large oil and gas companies. Emissions from human activities have increased atmospheric carbon dioxide by about 50% over pre-industrial levels. The growing levels of emissions have varied, but have been consistent among all greenhouse gases. Emissions in the 2010s averaged 56 billion tons a year, higher than any decade before. Total cumulative emissions from 1870 to 2017 were 425±20 GtC from fossil fuels and industry, and 180±60 GtC from land use change. Land-use change, such as deforestation, caused about 31% of cumulative emissions over 1870–2017, coal 32%, oil 25%, and gas 10%.

<span class="mw-page-title-main">Greenhouse gas emissions by the United States</span> Climate changing gases from the North American country

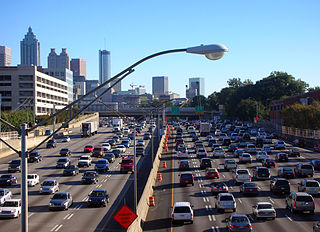
The United States produced 5.2 billion metric tons of carbon dioxide equivalent greenhouse gas (GHG) emissions in 2020, the second largest in the world after greenhouse gas emissions by China and among the countries with the highest greenhouse gas emissions per person. In 2019 China is estimated to have emitted 27% of world GHG, followed by the United States with 11%, then India with 6.6%. In total the United States has emitted a quarter of world GHG, more than any other country. Annual emissions are over 15 tons per person and, amongst the top eight emitters, is the highest country by greenhouse gas emissions per person. However, the IEA estimates that the richest decile in the US emits over 55 tonnes of CO2 per capita each year. Because coal-fired power stations are gradually shutting down, in the 2010s emissions from electricity generation fell to second place behind transportation which is now the largest single source. In 2020, 27% of the GHG emissions of the United States were from transportation, 25% from electricity, 24% from industry, 13% from commercial and residential buildings and 11% from agriculture. In 2021, the electric power sector was the second largest source of U.S. greenhouse gas emissions, accounting for 25% of the U.S. total. These greenhouse gas emissions are contributing to climate change in the United States, as well as worldwide.

Germanwatch e.V. is a non-profit, non-governmental organization based in Bonn, Germany. It seeks to influence public policy on trade, the environment, and relations between countries in the industrialized north and underdeveloped south. The organization collates a variety of economic and social data to formulate position papers, often in partnership with other NGOs. Particular areas of interest include trade in food and agricultural policy, climate change, and corporate accountability.

<span class="mw-page-title-main">Ibrahim Index of African Governance</span> Annual assessment of African countries

The Ibrahim Index of African Governance (IIAG), established in 2007, provides an assessment of the quality of governance in African countries. The IIAG is compiled by 81 indicators and 265 variables from 54 data projects, coming from 47 independent African and international data sources. Published every two years, the IIAG is one of the world’s most comprehensive collections of data on African governance.

<span class="mw-page-title-main">Climate change in Sweden</span>

Climate change has received significant scientific, public and political attention in Sweden. In 1896, Swedish chemist Svante Arrhenius was the first scientist to quantify global heating. Sweden has a high energy consumtion per capita, but reducing the dependency on fossil energy has been on the agenda of cabinets of the Governments of Sweden since the 1970s oil crises. In 2014 and 2016, Sweden was ranked #1 in the Global Green Economy Index (GGEI), because the Swedish economy produces relatively low emissions. Sweden has had one of the highest usages of biofuel in Europe and aims at prohibiting new sales of fossil-cars, including hybrid cars, by 2035, and for an energy supply system with zero net atmospheric greenhouse gas emissions by 2045.

<span class="mw-page-title-main">Good Country Index</span> Index measuring how much each country contributes to the planet and the human race

The Good Country Index measures how much each of the 163 countries on the list contribute to the planet, and to the human race, through their policies and behaviors.

The German Climate Action Plan 2050 is a climate protection policy document approved by the German government on 14 November 2016. The plan outlines measures by which Germany can meet its various national greenhouse gas emissions reduction goals through to 2050 and service its international commitments under the 2016 Paris Climate Agreement. The Federal Ministry for the Environment, Nature Conservation, Building and Nuclear Safety (BMUB), under minister Barbara Hendricks, led the development of the plan. The plan was progressively watered down since a draft was first leaked in early May 2016. Projections from the environment ministry in September 2016 indicate that Germany will likely miss its 2020 climate target.

<span class="mw-page-title-main">Climate change in Germany</span> Emissions, impacts and responses of Germany related to climate change

Climate change is leading to long-term impacts on agriculture in Germany, more intense heatwaves and coldwaves, flash and coastal flooding, and reduced water availability. Debates over how to address these long-term challenges caused by climate change have also sparked changes in the energy sector and in mitigation strategies. Germany's energiewende has been a significant political issue in German politics that has made coalition talks difficult for Angela Merkel's CDU.

<span class="mw-page-title-main">Greenhouse gas emissions by Turkey</span> Climate-changing gases from Turkey: sources, amounts, and mitigation policies

Coal, cars and lorries vent more than a third of Turkey's six hundred million tonnes of annual greenhouse gas emissions, which are mostly carbon dioxide and part of the cause of climate change in Turkey. The nation's coal-fired power stations emit the most carbon dioxide, and other significant sources are road vehicles running on petrol or diesel. After coal and oil the third most polluting fuel is fossil gas; which is burnt in Turkey's gas-fired power stations, homes and workplaces. Much methane is belched by livestock; cows alone produce half of the greenhouse gas from agriculture in Turkey.

<span class="mw-page-title-main">Climate change in Algeria</span>

Climate change in Algeria has wide-reaching effects on the country. Algeria was not a significant contributor to climate change, but, like other countries in the Middle East and North Africa (MENA) region, is expected to be among the most affected by climate change impacts. Because a large part of the country is in already hot and arid geographies, including part of the Sahara, already strong heat and water resource access challenges are expected to get worse. As early as 2014, scientists were attributing extreme heat waves to climate change in Algeria. Algeria was ranked 46th of countries in the 2020 Climate Change Performance Index.

<span class="mw-page-title-main">Climate change in Morocco</span> Emissions, impacts and responses of Morocco related to climate change

Climate change is expected to significantly impact Morocco on multiple dimensions, similar to other countries in the Middle East and North Africa region. As a coastal country with hot and arid climates, environmental impacts from climate change are likely to be wide and varied. Analysis of these environmental changes on the economy of Morocco are expected to create challenges at all levels of the economy. The main effects will be felt in the agricultural systems and fisheries which employ half of the population, and account for 14% of GDP. In addition, because 60% of the population and most of the industrial activity are on the coast, sea level rise is a major threat to key economic forces. Morocco’s average temperatures have increased by 0.2 °C per decade since the 1960s. Morocco is particularly susceptible to heat waves, droughts and floods.

<span class="mw-page-title-main">Niklas Höhne</span> German researcher

Niklas Höhne is a German scientist in the field of national and international climate policy and mitigation of greenhouse gas emissions. He is founder of the NewClimate Institute in Cologne, Germany and professor at Wageningen University.

<span class="mw-page-title-main">Climate change in the Middle East and North Africa</span> Emissions, impacts and responses of the MENA region related to climate change

Climate change in the Middle East and North Africa (MENA) refers to changes in the climate of the MENA region and the subsequent response, adaption and mitigation strategies of countries in the region. In 2018, the MENA region emitted 3.2 billion tonnes of carbon dioxide and produced 8.7% of global greenhouse gas emissions (GHG) despite making up only 6% of the global population. These emissions are mostly from the energy sector, an integral component of many Middle Eastern and North African economies due to the extensive oil and natural gas reserves that are found within the region. The region of Middle East is one of the most vulnerable to climate change. The impacts include increase in drought conditions, aridity, heatwaves and sea level rise.

References

  1. Hellman, Rachel. "U.S. Lags in Latest Climate Protection Rankings" . Retrieved 7 September 2022. Developed by Germanwatch, NewClimate Institute and the Climate Action Network, the CCPI is an independent monitoring tool for tracking countries' climate protection performance.
  2. Burck, Jan; Uhlich, Thea; Bals, Christoph; Höhne, Niklas; Nascimento, Leonardo; Tamblyn, Ana; Reuther, Jonas (November 2021). "Climate Change Performance Index 2022" (PDF). Germanwatch. Archived (PDF) from the original on 2021-11-11. Retrieved 16 November 2021.
  3. Prerna, Lidhoo (12 November 2021). "Top three spots at the Climate Change Performance Index 2022 remain empty, India at No. 10". Business Today.
  4. Burck, Jan; Hagen, Ursula; Bals, Christoph; Helling, Violeta; Höhne, Niklas; Nascimento, Leonardo (10 December 2019). "Background and Methodology" (PDF). Germanwatch. Archived from the original (PDF) on 2020-01-28. Retrieved 28 January 2020.
  5. "Denmark at top three on Climate Change Performance" . Retrieved 25 June 2023.
  6. "Iran ranks "very low" at Climate Change performance". www.tehrantimes.com. Retrieved 25 June 2023.
  7. "Ranking at Official website" . Retrieved 25 June 2023.
  8. Latrech, Oumaima. "2022 Climate Change Performance Index: Morocco 5th Best Country Worldwide". Morocco World News.
  9. "Morocco rates high in climate-change performance index". Business Standard India. 2 January 2019. Retrieved 7 September 2022.

Notes

  1. In the CCPI index for 2020, Sweden led the ranking, followed by Denmark and Morocco. [8] [9] The last three ranks were taken by the United States, Saudi Arabia and Taiwan.