Ocean heat content

Last updated
The ocean heat content (OHC) has been increasing for decades as the ocean has been absorbing most of the excess heat resulting from greenhouse gas emissions from human activities. The graph shows OHC calculated to a water depth of 700 and to 2000 meters. 1955- Ocean heat content - NOAA.svg
The ocean heat content (OHC) has been increasing for decades as the ocean has been absorbing most of the excess heat resulting from greenhouse gas emissions from human activities. The graph shows OHC calculated to a water depth of 700 and to 2000 meters.

Ocean heat content (OHC) or ocean heat uptake (OHU) is the energy absorbed and stored by oceans. To calculate the ocean heat content, it is necessary to measure ocean temperature at many different locations and depths. Integrating the areal density of a change in enthalpic energy over an ocean basin or entire ocean gives the total ocean heat uptake. [2] Between 1971 and 2018, the rise in ocean heat content accounted for over 90% of Earth's excess energy from global heating. [3] [4] The main driver of this increase was anthropogenic forcing via rising greenhouse gas emissions. [5] :1228 By 2020, about one third of the added energy had propagated to depths below 700 meters. [6] [7]

Contents

In 2023, the world's oceans were again the hottest in the historical record and exceeded the previous 2022 record maximum. [8] The five highest ocean heat observations to a depth of 2000 meters occurred in the period 2019–2023. The North Pacific, North Atlantic, the Mediterranean, and the Southern Ocean all recorded their highest heat observations for more than sixty years of global measurements. [9] Ocean heat content and sea level rise are important indicators of climate change. [10]

Ocean water can absorb a lot of solar energy because water has far greater heat capacity than atmospheric gases. [6] As a result, the top few meters of the ocean contain more energy than the entire Earth's atmosphere. [11] Since before 1960, research vessels and stations have sampled sea surface temperatures and temperatures at greater depth all over the world. Since 2000, an expanding network of nearly 4000 Argo robotic floats has measured temperature anomalies, or the change in ocean heat content. With improving observation in recent decades, the heat content of the upper ocean has been analyzed to have increased at an accelerating rate. [12] [13] [14] The net rate of change in the top 2000 meters from 2003 to 2018 was +0.58±0.08 W/m2 (or annual mean energy gain of 9.3  zettajoules). It is difficult to measure temperatures over long periods with sufficient accuracy and covering enough areas and depths. This explains the uncertainty in the figures. [10]

Changes in ocean temperature greatly affect ecosystems in oceans and on land. For example, there are multiple impacts on coastal ecosystems and communities relying on their ecosystem services. Direct effects include variations in sea level and sea ice, changes to the intensity of the water cycle, and the migration of marine life. [15]

Calculations

Definition

Graph of different thermoclines (depth versus ocean temperature) based on seasons and latitude ThermoclineSeasonDepth.png
Graph of different thermoclines (depth versus ocean temperature) based on seasons and latitude

Ocean heat content is a term used in physical oceanography to describe a type of energy that is stored in the ocean. It is defined in coordination with a particular formulation of the thermodynamic equation of state of seawater. TEOS-10 is an international standard approved in 2010 by the Intergovernmental Oceanographic Commission. [16]

Calculation of ocean heat content is closely aligned with that of enthalpy at an ocean surface, also called potential enthalpy. OHC changes are thus made more readily comparable to seawater heat exchanges with ice, freshwater, and humid air. [17] [18] OHC is always reported as a change or as an "anomaly" relative to a baseline. Positive values then also quantify ocean heat uptake (OHU) and are useful to diagnose where most of planetary energy gains from global heating are going.

To calculate the ocean heat content, measurements of ocean temperature from sample parcels of seawater gathered at many different locations and depths are required. [19] Integrating the areal density of ocean heat over an ocean basin, or entire ocean, gives the total ocean heat content. Thus, total ocean heat content is a volume integral of the product of temperature, density, and heat capacity over the three-dimensional region of the ocean for which data is available. [20] The bulk of measurements have been performed at depths shallower than about 2000 m (1.25 miles). [21]

The areal density of ocean heat content between two depths is computed as a definite integral: [2] [20]

where is the specific heat capacity of sea water, h2 is the lower depth, h1 is the upper depth, is the in-situ seawater density profile, and is the conservative temperature profile. is defined at a single depth h0 usually chosen as the ocean surface. In SI units, has units of Joules per square metre (J·m−2).

In practice, the integral can be approximated by summation using a smooth and otherwise well-behaved sequence of in-situ data; including temperature (t), pressure (p), salinity (s) and their corresponding density (ρ). Conservative temperature are translated values relative to the reference pressure (p0) at h0. A substitute known as potential temperature has been used in earlier calculations. [22]

Measurements of temperature versus ocean depth generally show an upper mixed layer (0–200 m), a thermocline (200–1500 m), and a deep ocean layer (>1500 m). These boundary depths are only rough approximations. Sunlight penetrates to a maximum depth of about 200 m; the top 80 m of which is the habitable zone for photosynthetic marine life covering over 70% of Earth's surface. [23] Wave action and other surface turbulence help to equalize temperatures throughout the upper layer.

Unlike surface temperatures which decrease with latitude, deep-ocean temperatures are relatively cold and uniform in most regions of the world. [24] About 50% of all ocean volume is at depths below 3000 m (1.85 miles), with the Pacific Ocean being the largest and deepest of five oceanic divisions. The thermocline is the transition between upper and deep layers in terms of temperature, nutrient flows, abundance of life, and other properties. It is semi-permanent in the tropics, variable in temperate regions (often deepest during the summer), and shallow to nonexistent in polar regions. [25]

Measurements

The global distribution of active floats in the Argo array Argo floats in Feb. 2018 colour coded by country.png
The global distribution of active floats in the Argo array

Ocean heat content measurements come with difficulties, especially before the deployment of the Argo profiling floats. [21] Due to poor spatial coverage and poor quality of data, it has not always been easy to distinguish between long term global warming trends and climate variability. Examples of these complicating factors are the variations caused by El Niño–Southern Oscillation or changes in ocean heat content caused by major volcanic eruptions. [10]

Argo is an international program of robotic profiling floats deployed globally since the start of the 21st century. [27] The program's initial 3000 units had expanded to nearly 4000 units by year 2020. At the start of each 10-day measurement cycle, a float descends to a depth of 1000 meters and drifts with the current there for nine days. It then descends to 2000 meters and measures temperature, salinity (conductivity), and depth (pressure) over a final day of ascent to the surface. At the surface the float transmits the depth profile and horizontal position data through satellite relays before repeating the cycle. [28]

Starting 1992, the TOPEX/Poseidon and subsequent Jason satellite series altimeters have observed vertically integrated OHC, which is a major component of sea level rise. [29] Since 2002, GRACE and GRACE-FO have remotely monitored ocean changes using gravimetry. [30] The partnership between Argo and satellite measurements has thereby yielded ongoing improvements to estimates of OHC and other global ocean properties. [26]

Causes for heat uptake

Oceanographer Josh Willis discusses the heat capacity of water, performs an experiment to demonstrate heat capacity using a water balloon and describes how water's ability to store heat affects Earth's climate.

Ocean heat uptake accounts for over 90% of total planetary heat uptake, mainly as a consequence of human-caused changes to the composition of Earth's atmosphere. [11] [31] This high percentage is because waters at and below the ocean surface - especially the turbulent upper mixed layer - exhibit a thermal inertia much larger than the planet's exposed continental crust, ice-covered polar regions, or atmospheric components themselves. A body with large thermal inertia stores a big amount of energy because of its volumetric heat capacity, and effectively transmits energy according to its heat transfer coefficient. Most extra energy that enters the planet via the atmosphere is thereby taken up and retained by the ocean. [32] [33] [34]

Earth heat inventory (energy accumulation) in ZJ for the components of the Earth's climate system relative to 1960 and from 1960 to 2018. The upper ocean (0-300 m, light blue line, and 0-700 m, light blue shading) accounts for the largest amount of heat gain. Earth's Heat Accumulation.png
Earth heat inventory (energy accumulation) in ZJ for the components of the Earth's climate system relative to 1960 and from 1960 to 2018. The upper ocean (0–300 m, light blue line, and 0–700 m, light blue shading) accounts for the largest amount of heat gain.

Planetary heat uptake or heat content accounts for the entire energy added to or removed from the climate system. [35] It can be computed as an accumulation over time of the observed differences (or imbalances) between total incoming and outgoing radiation. Changes to the imbalance have been estimated from Earth orbit by CERES and other remote instruments, and compared against in-situ surveys of heat inventory changes in oceans, land, ice and the atmosphere. [3] [36] [37] Achieving complete and accurate results from either accounting method is challenging, but in different ways that are viewed by researchers as being mostly independent of each other. [36] Increases in planetary heat content for the well-observed 2005-2019 period are thought to exceed measurement uncertainties. [31]

From the ocean perspective, the more abundant equatorial solar irradiance is directly absorbed by Earth's tropical surface waters and drives the overall poleward propagation of heat. The surface also exchanges energy that has been absorbed by the lower troposphere through wind and wave action. Over time, a sustained imbalance in Earth's energy budget enables a net flow of heat either into or out of greater ocean depth via thermal conduction, downwelling, and upwelling. [38] [39] Releases of OHC to the atmosphere occur primarily via evaporation and enable the planetary water cycle. [40] Concentrated releases in association with high sea surface temperatures help drive tropical cyclones, atmospheric rivers, atmospheric heat waves and other extreme weather events that can penetrate far inland. [9] [41] Altogether these processes enable the ocean to be Earth's largest thermal reservoir which functions to regulate the planet's climate; acting as both a sink and a source of energy. [32]

Surface air temperatures over land masses have been increasing faster than the sea surface temperature. 20230706 Excess heat absorbed through ocean's surface - global warming.svg
Surface air temperatures over land masses have been increasing faster than the sea surface temperature.

From the perspective of land and ice covered regions, their portion of heat uptake is reduced and delayed by the dominant thermal inertia of the ocean. Although the average rise in land surface temperature has exceeded the ocean surface due to the lower inertia (smaller heat-transfer coefficient) of solid land and ice, temperatures would rise more rapidly and by a greater amount without the full ocean. [32] Measurements of how rapidly the heat mixes into the deep ocean have also been underway to better close the ocean and planetary energy budgets. [42]

Recent observations and changes

Numerous independent studies in recent years have found a multi-decadal rise in OHC of upper ocean regions that has begun to penetrate to deeper regions. [3] [21] The upper ocean (0–700 m) has warmed since 1971, while it is very likely that warming has occurred at intermediate depths (700–2000 m) and likely that deep ocean (below 2000 m) temperatures have increased. [5] :1228 The heat uptake results from a persistent warming imbalance in Earth's energy budget that is most fundamentally caused by the anthropogenic increase in atmospheric greenhouse gases. [43] :41 There is very high confidence that increased ocean heat content in response to anthropogenic carbon dioxide emissions is essentially irreversible on human time scales. [5] :1233

Map of the ocean heat anomaly in the upper 700 meters for year 2020 versus the 1993-2020 average. Some regions accumulated more energy than others due to transport drivers such as winds and currents. Ocean heat anomaly map 2020.jpg
Map of the ocean heat anomaly in the upper 700 meters for year 2020 versus the 1993–2020 average. Some regions accumulated more energy than others due to transport drivers such as winds and currents.

Studies based on Argo measurements indicate that ocean surface winds, especially the subtropical trade winds in the Pacific Ocean, change ocean heat vertical distribution. [45] This results in changes among ocean currents, and an increase of the subtropical overturning, which is also related to the El Niño and La Niña phenomenon. Depending on stochastic natural variability fluctuations, during La Niña years around 30% more heat from the upper ocean layer is transported into the deeper ocean. Furthermore, studies have shown that approximately one-third of the observed warming in the ocean is taking place in the 700-2000 meter ocean layer. [46]

Model studies indicate that ocean currents transport more heat into deeper layers during La Niña years, following changes in wind circulation. [47] [48] Years with increased ocean heat uptake have been associated with negative phases of the interdecadal Pacific oscillation (IPO). [49] This is of particular interest to climate scientists who use the data to estimate the ocean heat uptake.

The upper ocean heat content in most North Atlantic regions is dominated by heat transport convergence (a location where ocean currents meet), without large changes to temperature and salinity relation. [50] Additionally, a study from 2022 on anthropogenic warming in the ocean indicates that 62% of the warming from the years between 1850 and 2018 in the North Atlantic along 25°N is kept in the water below 700 m, where a major percentage of the ocean's surplus heat is stored. [51]

A study in 2015 concluded that ocean heat content increases by the Pacific Ocean were compensated by an abrupt distribution of OHC into the Indian Ocean. [52]

Although the upper 2000 m of the oceans have experienced warming on average since the 1970s, the rate of ocean warming varies regionally with the subpolar North Atlantic warming more slowly and the Southern Ocean taking up a disproportionate large amount of heat due to anthropogenic greenhouse gas emissions. [5] :1230

Deep-ocean warming below 2000 m has been largest in the Southern Ocean compared to other ocean basins. [5] :1230

Impacts

Warming oceans are one reason for coral bleaching [53] and contribute to the migration of marine species. [54] Marine heat waves are regions of life-threatening and persistently elevated water temperatures. [55] Redistribution of the planet's internal energy by atmospheric circulation and ocean currents produces internal climate variability, often in the form of irregular oscillations, [56] and helps to sustain the global thermohaline circulation. [57] [58]

The increase in OHC accounts for 30–40% of global sea-level rise from 1900 to 2020 because of thermal expansion. [59] [60] It is also an accelerator of sea ice, iceberg, and tidewater glacier melting. The ice loss reduces polar albedo, amplifying both the regional and global energy imbalances. [61] The resulting ice retreat has been rapid and widespread for Arctic sea ice, [62] and within northern fjords such as those of Greenland and Canada. [63] Impacts to Antarctic sea ice and the vast Antarctic ice shelves which terminate into the Southern Ocean have varied by region and are also increasing due to warming waters. [64] [65] Breakup of the Thwaites Ice Shelf and its West Antarctica neighbors contributed about 10% of sea-level rise in 2020. [66] [67]

The ocean also functions as a sink and source of carbon, with a role comparable to that of land regions in Earth's carbon cycle. [68] [69] In accordance with the temperature dependence of Henry's law, warming surface waters are less able to absorb atmospheric gases including oxygen and the growing emissions of carbon dioxide and other greenhouse gases from human activity. [70] [71] Nevertheless the rate in which the ocean absorbs anthropogenic carbon dioxide has approximately tripled from the early 1960s to the late 2010s; a scaling proportional to the increase in atmospheric carbon dioxide. [72]

Warming of the deep ocean has the further potential to melt and release some of the vast store of frozen methane hydrate deposits that have naturally accumulated there. [73]

See also

Related Research Articles

<span class="mw-page-title-main">Causes of climate change</span> Effort to scientifically ascertain mechanisms responsible for recent global warming

The scientific community has been investigating the causes of climate change for decades. After thousands of studies, it came to a consensus, where it is "unequivocal that human influence has warmed the atmosphere, ocean and land since pre-industrial times." This consensus is supported by around 200 scientific organizations worldwide, The dominant role in this climate change has been played by the direct emissions of carbon dioxide from the burning of fossil fuels. Indirect CO2 emissions from land use change, and the emissions of methane, nitrous oxide and other greenhouse gases play major supporting roles.

<span class="mw-page-title-main">Climate</span> Statistics of weather conditions in a given region over long periods

Climate is the long-term weather pattern in a region, typically averaged over 30 years. More rigorously, it is the mean and variability of meteorological variables over a time spanning from months to millions of years. Some of the meteorological variables that are commonly measured are temperature, humidity, atmospheric pressure, wind, and precipitation. In a broader sense, climate is the state of the components of the climate system, including the atmosphere, hydrosphere, cryosphere, lithosphere and biosphere and the interactions between them. The climate of a location is affected by its latitude, longitude, terrain, altitude, land use and nearby water bodies and their currents.

<span class="mw-page-title-main">Greenhouse effect</span> Atmospheric phenomenon causing planetary warming

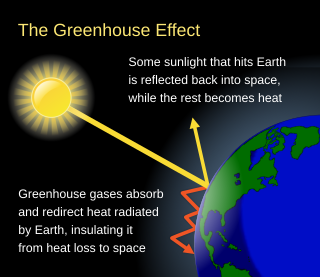
The greenhouse effect occurs when greenhouse gases in a planet's atmosphere insulate the planet from losing heat to space, raising its surface temperature. Surface heating can happen from an internal heat source as in the case of Jupiter, or from its host star as in the case of the Earth. In the case of Earth, the Sun emits shortwave radiation (sunlight) that passes through greenhouse gases to heat the Earth's surface. In response, the Earth's surface emits longwave radiation that is mostly absorbed by greenhouse gases. The absorption of longwave radiation prevents it from reaching space, reducing the rate at which the Earth can cool off.

<span class="mw-page-title-main">Climate variability and change</span> Change in the statistical distribution of climate elements for an extended period

Climate variability includes all the variations in the climate that last longer than individual weather events, whereas the term climate change only refers to those variations that persist for a longer period of time, typically decades or more. Climate change may refer to any time in Earth's history, but the term is now commonly used to describe contemporary climate change, often popularly referred to as global warming. Since the Industrial Revolution, the climate has increasingly been affected by human activities.

<span class="mw-page-title-main">Climate model</span> Quantitative methods used to simulate climate

Numerical climate models are mathematical models that can simulate the interactions of important drivers of climate. These drivers are the atmosphere, oceans, land surface and ice. Scientists use climate models to study the dynamics of the climate system and to make projections of future climate and of climate change. Climate models can also be qualitative models and contain narratives, largely descriptive, of possible futures.

<span class="mw-page-title-main">Radiative forcing</span> Difference between solar irradiance absorbed by the Earth and energy radiated back to space

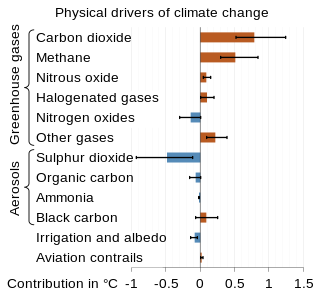
Radiative forcing is a concept used in climate science to quantify the change in energy balance in Earth's atmosphere. Various factors contribute to this change in energy balance, such as concentrations of greenhouse gases and aerosols, and changes in surface albedo and solar irradiance. In more technical terms, it is defined as "the change in the net, downward minus upward, radiative flux due to a change in an external driver of climate change." These external drivers are distinguished from feedbacks and variability that are internal to the climate system, and that further influence the direction and magnitude of imbalance. Radiative forcing on Earth is meaningfully evaluated at the tropopause and at the top of the stratosphere. It is quantified in units of watts per square meter, and often summarized as an average over the total surface area of the globe.

<span class="mw-page-title-main">Clouds and the Earth's Radiant Energy System</span> NASA satellite climate data instruments

Clouds and the Earth's Radiant Energy System (CERES) is an on-going NASA climatological experiment from Earth orbit. The CERES are scientific satellite instruments, part of the NASA's Earth Observing System (EOS), designed to measure both solar-reflected and Earth-emitted radiation from the top of the atmosphere (TOA) to the Earth's surface. Cloud properties are determined using simultaneous measurements by other EOS instruments such as the Moderate Resolution Imaging Spectroradiometer (MODIS). Results from the CERES and other NASA missions, such as the Earth Radiation Budget Experiment (ERBE), could enable nearer to real-time tracking of Earth's energy imbalance (EEI) and better understanding of the role of clouds in global climate change.

This glossary of climate change is a list of definitions of terms and concepts relevant to climate change, global warming, and related topics.

<span class="mw-page-title-main">Sea surface temperature</span> Water temperature close to the oceans surface

Sea surface temperature (SST), or ocean surface temperature, is the ocean temperature close to the surface. The exact meaning of surface varies in the literature and in practice. It is usually between 1 millimetre (0.04 in) and 20 metres (70 ft) below the sea surface. Sea surface temperatures greatly modify air masses in the Earth's atmosphere within a short distance of the shore. Local areas of heavy snow can form in bands downwind of warm water bodies within an otherwise cold air mass. Warm sea surface temperatures can develop and strengthen cyclones over the ocean. Tropical cyclones can also cause a cool wake. This is due to turbulent mixing of the upper 30 metres (100 ft) of the ocean. Sea surface temperature changes during the day. This is like the air above it, but to a lesser degree. There is less variation in sea surface temperature on breezy days than on calm days. The thermohaline circulation has a major impact on average sea surface temperature throughout most of the world's oceans.

<span class="mw-page-title-main">Earth's energy budget</span> Accounting of the energy flows which determine Earths surface temperature and drive its climate

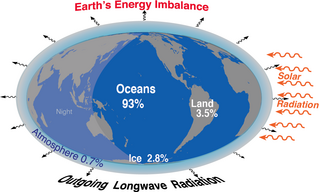
Earth's energy budget accounts for the balance between the energy that Earth receives from the Sun and the energy the Earth loses back into outer space. Smaller energy sources, such as Earth's internal heat, are taken into consideration, but make a tiny contribution compared to solar energy. The energy budget also accounts for how energy moves through the climate system. The Sun heats the equatorial tropics more than the polar regions. Therefore, the amount of solar irradiance received by a certain region is unevenly distributed. As the energy seeks equilibrium across the planet, it drives interactions in Earth's climate system, i.e., Earth's water, ice, atmosphere, rocky crust, and all living things. The result is Earth's climate.

<span class="mw-page-title-main">Argo (oceanography)</span> International oceanographic observation program

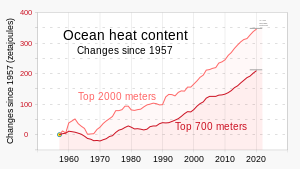
Argo is an international programme for researching the ocean. It uses profiling floats to observe temperature, salinity and currents. Recently it has observed bio-optical properties in the Earth's oceans. It has been operating since the early 2000s. The real-time data it provides support climate and oceanographic research. A special research interest is to quantify the ocean heat content (OHC). The Argo fleet consists of almost 4000 drifting "Argo floats" deployed worldwide. Each float weighs 20–30 kg. In most cases probes drift at a depth of 1000 metres. Experts call this the parking depth. Every 10 days, by changing their buoyancy, they dive to a depth of 2000 metres and then move to the sea-surface. As they move they measure conductivity and temperature profiles as well as pressure. Scientists calculate salinity and density from these measurements. Seawater density is important in determining large-scale motions in the ocean.

<span class="mw-page-title-main">Climate sensitivity</span> Change in Earths temperature caused by changes in atmospheric carbon dioxide concentrations

Climate sensitivity is a key measure in climate science and describes how much Earth's surface will warm for a doubling in the atmospheric carbon dioxide (CO2) concentration. Its formal definition is: "The change in the surface temperature in response to a change in the atmospheric carbon dioxide (CO2) concentration or other radiative forcing." This concept helps scientists understand the extent and magnitude of the effects of climate change.

<span class="mw-page-title-main">Climate system</span> Interactions that create Earths climate and may result in climate change

Earth's climate system is a complex system with five interacting components: the atmosphere (air), the hydrosphere (water), the cryosphere, the lithosphere and the biosphere. Climate is the statistical characterization of the climate system. It represents the average weather, typically over a period of 30 years, and is determined by a combination of processes, such as ocean currents and wind patterns. Circulation in the atmosphere and oceans transports heat from the tropical regions to regions that receive less energy from the Sun. Solar radiation is the main driving force for this circulation. The water cycle also moves energy throughout the climate system. In addition, certain chemical elements are constantly moving between the components of the climate system. Two examples for these biochemical cycles are the carbon and nitrogen cycles.

<span class="mw-page-title-main">Outgoing longwave radiation</span> Energy transfer mechanism which enables planetary cooling

In climate science, longwave radiation (LWR) is electromagnetic thermal radiation emitted by Earth's surface, atmosphere, and clouds. It may also be referred to as terrestrial radiation. This radiation is in the infrared portion of the spectrum, but is distinct from the shortwave (SW) near-infrared radiation found in sunlight.

<span class="mw-page-title-main">Carbon dioxide in Earth's atmosphere</span> Atmospheric constituent and greenhouse gas

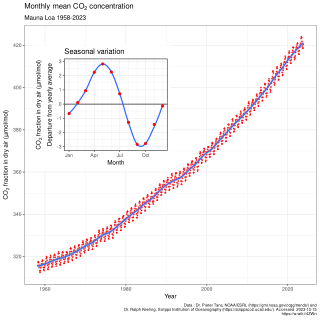
In Earth's atmosphere, carbon dioxide is a trace gas that plays an integral part in the greenhouse effect, carbon cycle, photosynthesis and oceanic carbon cycle. It is one of several greenhouse gases in the atmosphere of Earth. The current global average concentration of carbon dioxide (CO2) in the atmosphere is 421 ppm as of May 2022 (0.04%). This is an increase of 50% since the start of the Industrial Revolution, up from 280 ppm during the 10,000 years prior to the mid-18th century. The increase is due to human activity. Burning fossil fuels is the main cause of these increased CO2 concentrations and also the main cause of climate change. Other large sources of CO2 from human activities include cement production, deforestation, and biomass burning.

<span class="mw-page-title-main">Ocean</span> Salt water covering most of Earth

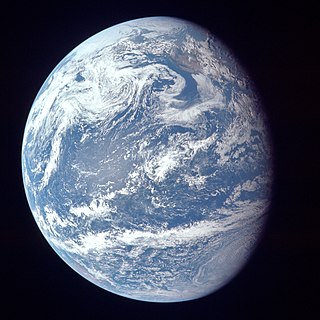
The ocean is the body of salt water that covers ~70.8% of the Earth. In English, the term ocean also refers to any of the large bodies of water into which the world ocean is conventionally divided. Distinct names are used to identify five different areas of the ocean: Pacific, Atlantic, Indian, Antarctic/Southern, and Arctic. The ocean contains 97% of Earth's water and is the primary component of the Earth's hydrosphere, thus the ocean is essential to life on Earth. The ocean influences climate and weather patterns, the carbon cycle, and the water cycle by acting as a huge heat reservoir.

<span class="mw-page-title-main">Ocean surface topography</span> Shape of the ocean surface relative to the geoid

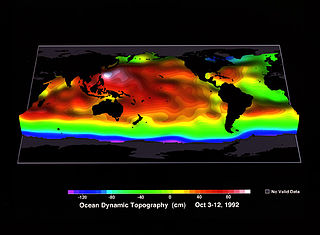
Ocean surface topography or sea surface topography, also called ocean dynamic topography, are highs and lows on the ocean surface, similar to the hills and valleys of Earth's land surface depicted on a topographic map. These variations are expressed in terms of average sea surface height (SSH) relative to Earth's geoid. The main purpose of measuring ocean surface topography is to understand the large-scale ocean circulation.

<span class="mw-page-title-main">Ocean temperature</span> Physical quantity that expresses hot and cold in ocean water

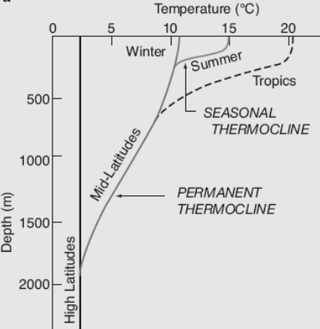
The ocean temperature plays a crucial role in the global climate system, ocean currents and for marine habitats. It varies depending on depth, geographical location and season. Not only the temperature differs in seawater but also the salinity. Warm surface water is generally saltier than the cooler deep or polar waters. In polar regions, the upper layers of ocean water are cold and fresh. Deep ocean water is cold, salty water found deep below the surface of Earth's oceans. This water has a uniform temperature of around 0-3 °C. The ocean temperature also depends on the amount of solar radiation falling on its surface. In the tropics, with the Sun nearly overhead, the temperature of the surface layers can rise to over 30 °C (86 °F). Near the poles the temperature in equilibrium with the sea ice is about −2 °C (28 °F).

<span class="mw-page-title-main">Effects of climate change on oceans</span> Impacts of increasing energy and carbon flows on marine environments

There are many effects of climate change on oceans. One of the main ones is an increase in ocean temperatures. More frequent marine heatwaves are linked to this. The rising temperature contributes to a rise in sea levels due to melting ice sheets. Other effects on oceans include sea ice decline, reducing pH values and oxygen levels, as well as increased ocean stratification. All this can lead to changes of ocean currents, for example a weakening of the Atlantic meridional overturning circulation (AMOC). The main root cause of these changes are the emissions of greenhouse gases from human activities, mainly burning of fossil fuels. Carbon dioxide and methane are examples of greenhouse gases. The additional greenhouse effect leads to ocean warming because the ocean takes up most of the additional heat in the climate system. The ocean also absorbs some of the extra carbon dioxide that is in the atmosphere. This causes the pH value of the seawater to drop. Scientists estimate that the ocean absorbs about 25% of all human-caused CO2 emissions.

<span class="mw-page-title-main">Josh Willis</span>

Joshua K. Willis is an oceanographer at NASA's Jet Propulsion Laboratory. His area of expertise is current sea level rise, as well as measuring ocean temperatures. When sea level fell from 2010 to 2011, Willis stated that this was due to an unusually large La Niña transferring more rainfall over land rather than over the ocean as usually happens. In addition, Willis is the project scientist for Jason-3.

References

    1. Top 700 meters:Lindsey, Rebecca; Dahlman, Luann (6 September 2023). "Climate Change: Ocean Heat Content". climate.gov. National Oceanic and Atmospheric Administration (NOAA). Archived from the original on 29 October 2023.Top 2000 meters: "Ocean Warming / Latest Measurement: December 2022 / 345 (± 2) zettajoules since 1955". NASA.gov. National Aeronautics and Space Administration. Archived from the original on 20 October 2023.
    2. 1 2 Dijkstra, Henk A. (2008). Dynamical oceanography ([Corr. 2nd print.] ed.). Berlin: Springer Verlag. p. 276. ISBN   9783540763758.
    3. 1 2 3 4 von Schuckmann, K.; Cheng, L.; Palmer, M. D.; Hansen, J.; et al. (7 September 2020). "Heat stored in the Earth system: where does the energy go?". Earth System Science Data. 12 (3): 2013–2041. Bibcode:2020ESSD...12.2013V. doi: 10.5194/essd-12-2013-2020 . hdl: 20.500.11850/443809 . CC-BY icon.svg Text was copied from this source, which is available under a Creative Commons Attribution 4.0 International License
    4. Cheng, Lijing; Abraham, John; Trenberth, Kevin; Fasullo, John; Boyer, Tim; Locarnini, Ricardo; et al. (2021). "Upper Ocean Temperatures Hit Record High in 2020". Advances in Atmospheric Sciences. 38 (4): 523–530. Bibcode:2021AdAtS..38..523C. doi: 10.1007/s00376-021-0447-x . S2CID   231672261.
    5. 1 2 3 4 5 Fox-Kemper, B., H.T. Hewitt, C. Xiao, G. Aðalgeirsdóttir, S.S. Drijfhout, T.L. Edwards, N.R. Golledge, M. Hemer, R.E. Kopp, G. Krinner, A. Mix, D. Notz, S. Nowicki, I.S. Nurhati, L. Ruiz, J.-B. Sallée, A.B.A. Slangen, and Y. Yu, 2021: Chapter 9: Ocean, Cryosphere and Sea Level Change Archived 2022-10-24 at the Wayback Machine . In Climate Change 2021: The Physical Science Basis. Contribution of Working Group I to the Sixth Assessment Report of the Intergovernmental Panel on Climate Change Archived 2021-08-09 at the Wayback Machine [Masson-Delmotte, V., P. Zhai, A. Pirani, S.L. Connors, C. Péan, S. Berger, N. Caud, Y. Chen, L. Goldfarb, M.I. Gomis, M. Huang, K. Leitzell, E. Lonnoy, J.B.R. Matthews, T.K. Maycock, T. Waterfield, O. Yelekçi, R. Yu, and B. Zhou (eds.)]. Cambridge University Press, Cambridge, United Kingdom and New York, NY, USA, pp. 1211–1362.
    6. 1 2 LuAnn Dahlman and Rebecca Lindsey (2020-08-17). "Climate Change: Ocean Heat Content". National Oceanic and Atmospheric Administration.
    7. "Study: Deep Ocean Waters Trapping Vast Store of Heat". Climate Central . 2016.
    8. Cheng, Lijing; Abraham, John; Trenberth, Kevin E.; Boyer, Tim; Mann, Michael E.; Zhu, Jiang; Wang, Fan; Yu, Fujiang; Locarnini, Ricardo; Fasullo, John; Zheng, Fei; Li, Yuanlong; et al. (2024). "New record ocean temperatures and related climate indicators in 2023". Advances in Atmospheric Sciences. doi: 10.1007/s00376-024-3378-5 . ISSN   0256-1530.
    9. 1 2 NOAA National Centers for Environmental Information, Monthly Global Climate Report for Annual 2023, published online January 2024, Retrieved on February 4, 2024 from https://www.ncei.noaa.gov/access/monitoring/monthly-report/global/202313.
    10. 1 2 3 Cheng, Lijing; Foster, Grant; Hausfather, Zeke; Trenberth, Kevin E.; Abraham, John (2022). "Improved Quantification of the Rate of Ocean Warming". Journal of Climate. 35 (14): 4827–4840. Bibcode:2022JCli...35.4827C. doi: 10.1175/JCLI-D-21-0895.1 . Archived 2017-10-16 at the Wayback Machine
    11. 1 2 "Vital Signs of the Plant: Ocean Heat Content". NASA. Retrieved 2021-11-15.
    12. Li, Zhi; England, Matthew H.; Groeskamp, Sjoerd (2023). "Recent acceleration in global ocean heat accumulation by mode and intermediate waters". Nature Communications. 14 (6888). doi: 10.1038/s41467-023-42468-z .
    13. Minière, Audrey; von Schuckmann, Karina; Sallée, Jean-baptiste; Vogt, Linus (2023). "Robust acceleration of Earth system heating observed over the past six decades". Scientific Reports. 13. doi: 10.1038/s41598-023-49353-1 .
    14. Storto, Andrea; Yang, Chunxue (2024). "Acceleration of the ocean warming from 1961 to 2022 unveiled by large-ensemble reanalyses". Nature Communications. 15 (545). doi: 10.1038/s41467-024-44749-7 .
    15. "Ocean warming : causes, scale, effects and consequences. And why it should matter to everyone. Executive summary" (PDF). International Union for Conservation of Nature. 2016.
    16. "TEOS-10: Thermodynamic Equation of Seawater - 2010". Joint Committee on the Properties of Seawater. Retrieved 12 February 2024.
    17. McDougall, Trevor J. (2003). "Potential Enthalpy: A Conservative Oceanic Variable for Evaluating Heat Content and Heat Fluxes". Journal of Physical Oceanography. 33 (5): 945–963. Bibcode:2003JPO....33..945M. doi: 10.1175/1520-0485(2003)033<0945:PEACOV>2.0.CO;2 .
    18. Graham, Felicity S.; McDougall, Trevor J. (2013-05-01). "Quantifying the Nonconservative Production of Conservative Temperature, Potential Temperature, and Entropy". Journal of Physical Oceanography. 43 (5): 838–862. Bibcode:2013JPO....43..838G. doi: 10.1175/jpo-d-11-0188.1 . ISSN   0022-3670.
    19. US EPA, OAR (2016-06-27). "Climate Change Indicators: Ocean Heat". www.epa.gov. Retrieved 2023-02-28.
    20. 1 2 McDougall, Trevor J.; Barker, Paul M.; Holmes, Ryan M.; Pawlowicz, Rich; Griffies, Stephen M.; Durack, Paul J. (2021-01-19). "The interpretation of temperature and salinity variables in numerical ocean model output, and the calculation of heat fluxes and heat content". Geoscientific Model Development Discussions. 14 (10): 6445–6466. doi: 10.5194/gmd-2020-426 . ISSN   1991-959X. S2CID   234212726.
    21. 1 2 3 Abraham; et al. (2013). "A review of global ocean temperature observations: Implications for ocean heat content estimates and climate change". Reviews of Geophysics. 51 (3): 450–483. Bibcode:2013RvGeo..51..450A. CiteSeerX   10.1.1.594.3698 . doi:10.1002/rog.20022. S2CID   53350907.
    22. "Getting started with TEOS-10 and the Gibbs Seawater (GSW) Oceanographic Toolbox" (PDF), teos-10.org, VERSION 3.06.12, 10 July 2020
    23. "photic zone (oceanography)". Encyclopædia Britannica Online. Retrieved 2021-12-15.
    24. MarineBio (2018-06-17). "The Deep Sea". MarineBio Conservation Society. Retrieved 2020-08-07.
    25. "What is a thermocline?". National Oceanic and Atmospheric Administration. Retrieved 2021-12-23.
    26. 1 2 "About Argo". Scripps Institute of Oceanography, UC San Diego. Retrieved 27 January 2023.
    27. Toni Feder (2000). "Argo Begins Systematic Global Probing of the Upper Oceans". Physics Today. 53 (7): 50. Bibcode:2000PhT....53g..50F. doi:10.1063/1.1292477.
    28. Dale C.S. Destin (5 December 2014). "The Argo revolution". climate.gov.
    29. "Ocean Surface Topography from Space: Ocean warming estimates from Jason". NASA Jet Propulsion Laboratory. 29 January 2020.
    30. Marti, Florence; Blazquez, Alejandro; Meyssignac, Benoit; Ablain, Michaël; Barnoud, Anne; et al. (2021). "Monitoring the ocean heat content change and the Earth energy imbalance from space altimetry and space gravimetry". Earth System Science Data. doi: 10.5194/essd-2021-220 .
    31. 1 2 Trenberth, Kevin E; Cheng, Lijing (2022-09-01). "A perspective on climate change from Earth's energy imbalance". Environmental Research: Climate. 1 (1): 013001. doi: 10.1088/2752-5295/ac6f74 . ISSN   2752-5295.
    32. 1 2 3 Michon Scott (24 April 2006). "Earth's Big Heat Bucket". NASA Earth Observatory.
    33. "Transfer and Storage of Heat in the Oceans". UCAR Center for Science Education. Retrieved 17 November 2023.
    34. Hansen, J.; Russell, G.; Lacis, A.; Fung, I.; Rind, D.; Stone, P. (1985). "Climate response times: Dependence on climate sensitivity and ocean mixing" (PDF). Science. 229 (4716): 857–850. Bibcode:1985Sci...229..857H. doi:10.1126/science.229.4716.857. PMID   17777925.
    35. "CERES Science". NASA. Retrieved 17 November 2023.
    36. 1 2 Loeb, Norman G.; Johnson, Gregory C.; Thorsen, Tyler J.; Lyman, John M.; et al. (15 June 2021). "Satellite and Ocean Data Reveal Marked Increase in Earth's Heating Rate". Geophysical Research Letters. 48 (13). Bibcode:2021GeoRL..4893047L. doi:10.1029/2021GL093047.
    37. Hakuba, M.Z.; Frederikse, T.; Landerer, F.W. (28 August 2021). "Earth's Energy Imbalance From the Ocean Perspective (2005–2019)". Geophysical Research Letters. 48 (16). doi:10.1029/2021GL093624.
    38. "Air-Sea interaction: Teacher's guide". American Meteorological Society. 2012. Retrieved 2022-02-22.
    39. "Ocean Motion : Definition : Wind Driven Surface Currents - Upwelling and Downwelling" . Retrieved 2022-02-22.
    40. "NASA Earth Science: Water Cycle". NASA. Retrieved 2021-10-27.
    41. Laura Snider (2021-01-13). "2020 was a record-breaking year for ocean heat - Warmer ocean waters contribute to sea level rise and strengthen storms". National Center for Atmospheric Research.
    42. "Deep Argo Mission". Scripps Institution of Oceanography, UC San Diego. Retrieved 17 November 2023.
    43. Arias, P.A., N. Bellouin, E. Coppola, R.G. Jones, G. Krinner, J. Marotzke, V. Naik, M.D. Palmer, G.-K. Plattner, J. Rogelj, M. Rojas, J. Sillmann, T. Storelvmo, P.W. Thorne, B. Trewin, K. Achuta Rao, B. Adhikary, R.P. Allan, K. Armour, G. Bala, R. Barimalala, S. Berger, J.G. Canadell, C. Cassou, A. Cherchi, W. Collins, W.D. Collins, S.L. Connors, S. Corti, F. Cruz, F.J. Dentener, C. Dereczynski, A. Di Luca, A. Diongue Niang, F.J. Doblas-Reyes, A. Dosio, H. Douville, F. Engelbrecht, V. Eyring, E. Fischer, P. Forster, B. Fox-Kemper, J.S. Fuglestvedt, J.C. Fyfe, N.P. Gillett, L. Goldfarb, I. Gorodetskaya, J.M. Gutierrez, R. Hamdi, E. Hawkins, H.T. Hewitt, P. Hope, A.S. Islam, C. Jones, et al. 2021: Technical Summary Archived 2022-07-21 at the Wayback Machine . In Climate Change 2021: The Physical Science Basis. Contribution of Working Group I to the Sixth Assessment Report of the Intergovernmental Panel on Climate Change Archived 2021-08-09 at the Wayback Machine [Masson-Delmotte, V., P. Zhai, A. Pirani, S.L. Connors, C. Péan, S. Berger, N. Caud, Y. Chen, L. Goldfarb, M.I. Gomis, M. Huang, K. Leitzell, E. Lonnoy, J.B.R. Matthews, T.K. Maycock, T. Waterfield, O. Yelekçi, R. Yu, and B. Zhou (eds.)]. Cambridge University Press, Cambridge, United Kingdom and New York, NY, USA, pp. 33−144.
    44. Jessica Blunden (25 August 2021). "Reporting on the State of the Climate in 2020". Climate.gov. National Oceanic and Atmospheric Administration.
    45. Balmaseda, Trenberth & Källén (2013). "Distinctive climate signals in reanalysis of global ocean heat content". Geophysical Research Letters. 40 (9): 1754–1759. Bibcode:2013GeoRL..40.1754B. doi: 10.1002/grl.50382 . Essay Archived 2015-02-13 at the Wayback Machine
    46. Levitus, Sydney (17 May 2012). "World ocean heat content and thermosteric sea level change (0–2000 m), 1955–2010". Geophysical Research Letters. 39 (10): 1–3. Bibcode:2012GeoRL..3910603L. doi: 10.1029/2012GL051106 . ISSN   0094-8276. S2CID   55809622 . Retrieved 28 April 2023.
    47. Meehl; et al. (2011). "Model-based evidence of deep-ocean heat uptake during surface-temperature hiatus periods". Nature Climate Change. 1 (7): 360–364. Bibcode:2011NatCC...1..360M. doi:10.1038/nclimate1229.
    48. Rob Painting (2 October 2011). "The Deep Ocean Warms When Global Surface Temperatures Stall". SkepticalScience.com . Retrieved 15 July 2016.
    49. Rob Painting (24 June 2013). "A Looming Climate Shift: Will Ocean Heat Come Back to Haunt us?". SkepticalScience.com. Retrieved 15 July 2016.
    50. Sirpa Häkkinen; Peter B Rhines; Denise L Worthen (2015). "Heat content variability in the North Atlantic Ocean in ocean reanalyses". Geophys Res Lett. 42 (8): 2901–2909. Bibcode:2015GeoRL..42.2901H. doi:10.1002/2015GL063299. PMC   4681455 . PMID   26709321.
    51. Messias, Marie-José; Mercier, Herlé (17 May 2022). "The redistribution of anthropogenic excess heat is a key driver of warming in the North Atlantic". Communications Earth & Environment. 3 (1): 118. Bibcode:2022ComEE...3..118M. doi: 10.1038/s43247-022-00443-4 . ISSN   2662-4435. S2CID   248816280 . Retrieved 27 April 2023.
    52. Lee, Sang-Ki; Park, Wonsun; Baringer, Molly O.; Gordon, Arnold L.; Huber, Bruce; Liu, Yanyun (June 2015). "Pacific origin of the abrupt increase in Indian Ocean heat content during the warming hiatus". Nature Geoscience. 8 (6): 445–449. Bibcode:2015NatGe...8..445L. doi:10.1038/ngeo2438. hdl: 1834/9681 .
    53. "The Great Barrier Reef: a catastrophe laid bare". The Guardian. 6 June 2016.
    54. Poloczanska, Elivra S.; Brown, Christopher J.; Sydeman, William J.; Kiessling, Wolfgang; Schoeman, David S.; Moore, Pippa J.; et al. (2013). "Global imprint of climate change on marine life" (PDF). Nature Climate Change. 3 (10): 919–925. Bibcode:2013NatCC...3..919P. doi:10.1038/nclimate1958.
    55. "So what are marine heat waves? - A NOAA scientist explains". National Oceanic and Atmospheric Administration. 2019-10-08.
    56. "El Niño & Other Oscillations". Woods Hole Oceanographic Institution. Retrieved 2021-10-08.
    57. Rahmstorf, Stefan (2003). "The concept of the thermohaline circulation". Nature. 421 (6924): 699. Bibcode:2003Natur.421..699R. doi: 10.1038/421699a . PMID   12610602. S2CID   4414604.
    58. Rahmstorf, Stefan; Box, Jason E.; Feulner, George; Mann, Michael E.; Robinson, Alexander; Rutherford, Scott; Schaffernicht, Erik J. (2015). "Exceptional twentieth-century slowdown in Atlantic Ocean overturning circulation" (PDF). Nature Climate Change . 5 (5): 475–480. Bibcode:2015NatCC...5..475R. doi:10.1038/nclimate2554.
    59. Frederikse, Thomas; Landerer, Felix; Caron, Lambert; Adhikari, Surendra; Parkes, David; Humphrey, Vincent W.; et al. (2020). "The causes of sea-level rise since 1900". Nature. 584 (7821): 393–397. doi:10.1038/s41586-020-2591-3. PMID   32814886. S2CID   221182575.
    60. "NASA-led study reveals the causes of sea level rise since 1900". NASA. 2020-08-21.
    61. Garcia-Soto, Carlos (2022-10-20). "An Overview of Ocean Climate Change Indicators: Sea Surface Temperature, Ocean Heat Content, Ocean pH, Dissolved Oxygen Concentration, Arctic Sea Ice Extent, Thickness and Volume, Sea Level and Strength of the AMOC (Atlantic Meridional Overturning Circulation)". Frontiers in Marine Science. 8. doi: 10.3389/fmars.2021.642372 . hdl: 10508/11963 .
    62. Rebecca Lindsey and Michon Scott (2021-09-21). "Climate Change: Arctic sea ice". National Oceanic and Atmospheric Administration.
    63. Maria-Jose Viñas and Carol Rasmussen (2015-08-05). "Warming seas and melting ice sheets". NASA.
    64. Slater, Thomas; Lawrence, Isobel R.; Otosaka, Inès N.; Shepherd, Andrew; et al. (25 January 2021). "Review article: Earth's ice imbalance". The Cryosphere. 15 (1): 233–246. Bibcode:2021TCry...15..233S. doi: 10.5194/tc-15-233-2021 .
    65. Michon Scott (2021-03-26). "Understanding climate: Antarctic sea ice extent". National Oceanic and Atmospheric Administration.
    66. Carly Cassella (2021-04-11). "Warm Water Under The 'Doomsday Glacier' Threatens to Melt It Faster Than We Predicted". sciencealert.com.
    67. British Antarctic Survey (2021-12-15). "The threat from Thwaites: The retreat of Antarctica's riskiest glacier". phys.org.
    68. Friedlingstein, M., O'Sullivan, M., M., Jones, Andrew, R., Hauck, J., Olson, A., Peters, G., Peters, W., Pongratz, J., Sitch, S., Le Quéré, C. and 75 others (2020). "Global carbon budget 2020". Earth System Science Data. 12 (4): 3269–3340. Bibcode:2020ESSD...12.3269F. doi: 10.5194/essd-12-3269-2020 . hdl: 10871/126892 .{{cite journal}}: CS1 maint: multiple names: authors list (link) CS1 maint: numeric names: authors list (link)
    69. Riebeek, Holli (16 June 2011). "The Carbon Cycle". Earth Observatory. NASA. Archived from the original on 5 March 2016. Retrieved 26 February 2022.
    70. Woolf D. K., Land P. E., Shutler J. D., Goddijn-Murphy L.M., Donlon, C. J. (2016). "On the calculation of air-sea fluxes of CO2 in the presence of temperature and salinity gradients". Journal of Geophysical Research: Oceans. 121 (2): 1229–1248. Bibcode:2016JGRC..121.1229W. doi: 10.1002/2015JC011427 .{{cite journal}}: CS1 maint: multiple names: authors list (link)
    71. Riebeek, Holli (1 July 2008). "The Ocean's Carbon Cycle". Earth Observatory. NASA. Retrieved 26 February 2022.
    72. Adam Voiland and Joshua Stevens (8 March 2016). "Methane Matters". NASA Earth Observatory. Retrieved 26 February 2022.