Continuous or discrete variable

Last updated

In mathematics and statistics, a quantitative variable may be continuous or discrete if they are typically obtained by measuring or counting , respectively. [1] If it can take on two particular real values such that it can also take on all real values between them (including values that are arbitrarily or infinitesimally close together), the variable is continuous in that interval. [2] If it can take on a value such that there is a non-infinitesimal gap on each side of it containing no values that the variable can take on, then it is discrete around that value. [3] In some contexts a variable can be discrete in some ranges of the number line and continuous in others.

Contents

Variables can be divided into two main categories: qualitative (categorical) and quantitative (numerical). Continuous and discrete variables are subcategories of quantitative variables. Note that this schematic is not exhaustive in terms of the types of variables. Continuous and discrete variables.png
Variables can be divided into two main categories: qualitative (categorical) and quantitative (numerical). Continuous and discrete variables are subcategories of quantitative variables. Note that this schematic is not exhaustive in terms of the types of variables.

Continuous variable

A continuous variable is a variable whose value is obtained by measuring, i.e., one which can take on an uncountable set of values.

For example, a variable over a non-empty range of the real numbers is continuous, if it can take on any value in that range. The reason is that any range of real numbers between and with is uncountable, with infinitely many values within the range. [4]

Methods of calculus are often used in problems in which the variables are continuous, for example in continuous optimization problems. [5]

In statistical theory, the probability distributions of continuous variables can be expressed in terms of probability density functions. [6]

In continuous-time dynamics, the variable time is treated as continuous, and the equation describing the evolution of some variable over time is a differential equation. [7] The instantaneous rate of change is a well-defined concept that takes the ratio of the change in the dependent variable to the independent variable at a specific instant.

This is an image of vials with different amounts of liquid. A continuous variable could be the volume of liquid in the vials. A discrete variable could be the number of vials. Continuous or discrete variables example.jpg
This is an image of vials with different amounts of liquid. A continuous variable could be the volume of liquid in the vials. A discrete variable could be the number of vials.

Discrete variable

In contrast, a variable is a discrete variable if and only if there exists a one-to-one correspondence between this variable and , the set of natural numbers. [8] In other words; a discrete variable over a particular interval of real values is one for which, for any value in the range that the variable is permitted to take on, there is a positive minimum distance to the nearest other permissible value. The value of a discrete variable can be obtained by counting, and the number of permitted values is either finite or countably infinite. Common examples are variables that must be integers, non-negative integers, positive integers, or only the integers 0 and 1. [9]

Methods of calculus do not readily lend themselves to problems involving discrete variables. Especially in multivariable calculus, many models rely on the assumption of continuity. [10] Examples of problems involving discrete variables include integer programming.

In statistics, the probability distributions of discrete variables can be expressed in terms of probability mass functions. [6]

In discrete time dynamics, the variable time is treated as discrete, and the equation of evolution of some variable over time is called a difference equation. [11] For certain discrete-time dynamical systems, the system response can be modeled by solving the difference equation for an analytical solution.

In econometrics and more generally in regression analysis, sometimes some of the variables being empirically related to each other are 0-1 variables, being permitted to take on only those two values. [12] The purpose of the discrete values of 0 and 1 is to use the dummy variable as a ‘switch’ that can ‘turn on’ and ‘turn off’ by assigning the two values to different parameters in an equation. A variable of this type is called a dummy variable. If the dependent variable is a dummy variable, then logistic regression or probit regression is commonly employed. In the case of regression analysis, a dummy variable can be used to represent subgroups of the sample in a study (e.g. the value 0 corresponding to a constituent of the control group). [13]

Mixture of continuous and discrete variables

A mixed multivariate model can contain both discrete and continuous variables. For instance, a simple mixed multivariate model could have a discrete variable , which only takes on values 0 or 1, and a continuous variable . [14] An example of a mixed model could be a research study on the risk of psychological disorders based on one binary measure of psychiatric symptoms and one continuous measure of cognitive performance. [15] Mixed models may also involve a single variable that is discrete over some range of the number line and continuous at another range.

In probability theory and statistics, the probability distribution of a mixed random variable consists of both discrete and continuous components. A mixed random variable does not have a cumulative distribution function that is discrete or everywhere-continuous. An example of a mixed type random variable is the probability of wait time in a queue. The likelihood of a customer experiencing a zero wait time is discrete, while non-zero wait times are evaluated on a continuous time scale. [16]

See also

Related Research Articles

<span class="mw-page-title-main">Discrete mathematics</span> Study of discrete mathematical structures

Discrete mathematics is the study of mathematical structures that can be considered "discrete" rather than "continuous". Objects studied in discrete mathematics include integers, graphs, and statements in logic. By contrast, discrete mathematics excludes topics in "continuous mathematics" such as real numbers, calculus or Euclidean geometry. Discrete objects can often be enumerated by integers; more formally, discrete mathematics has been characterized as the branch of mathematics dealing with countable sets. However, there is no exact definition of the term "discrete mathematics".

<span class="mw-page-title-main">Probability theory</span> Branch of mathematics concerning probability

Probability theory or probability calculus is the branch of mathematics concerned with probability. Although there are several different probability interpretations, probability theory treats the concept in a rigorous mathematical manner by expressing it through a set of axioms. Typically these axioms formalise probability in terms of a probability space, which assigns a measure taking values between 0 and 1, termed the probability measure, to a set of outcomes called the sample space. Any specified subset of the sample space is called an event.

<span class="mw-page-title-main">Probability distribution</span> Mathematical function for the probability a given outcome occurs in an experiment

In probability theory and statistics, a probability distribution is the mathematical function that gives the probabilities of occurrence of different possible outcomes for an experiment. It is a mathematical description of a random phenomenon in terms of its sample space and the probabilities of events.

<span class="mw-page-title-main">Random variable</span> Variable representing a random phenomenon

A random variable is a mathematical formalization of a quantity or object which depends on random events. The term 'random variable' can be misleading as its mathematical definition is not actually random nor a variable, but rather it is a function from possible outcomes in a sample space to a measurable space, often to the real numbers.

The likelihood function is the joint probability mass of observed data viewed as a function of the parameters of a statistical model. Intuitively, the likelihood function is the probability of observing data assuming is the actual parameter.

<span class="mw-page-title-main">Stochastic process</span> Collection of random variables

In probability theory and related fields, a stochastic or random process is a mathematical object usually defined as a sequence of random variables in a probability space, where the index of the sequence often has the interpretation of time. Stochastic processes are widely used as mathematical models of systems and phenomena that appear to vary in a random manner. Examples include the growth of a bacterial population, an electrical current fluctuating due to thermal noise, or the movement of a gas molecule. Stochastic processes have applications in many disciplines such as biology, chemistry, ecology, neuroscience, physics, image processing, signal processing, control theory, information theory, computer science, and telecommunications. Furthermore, seemingly random changes in financial markets have motivated the extensive use of stochastic processes in finance.

<span class="mw-page-title-main">Probability mass function</span> Discrete-variable probability distribution

In probability and statistics, a probability mass function is a function that gives the probability that a discrete random variable is exactly equal to some value. Sometimes it is also known as the discrete probability density function. The probability mass function is often the primary means of defining a discrete probability distribution, and such functions exist for either scalar or multivariate random variables whose domain is discrete.

<span class="mw-page-title-main">Logistic regression</span> Statistical model for a binary dependent variable

In statistics, the logistic model is a statistical model that models the log-odds of an event as a linear combination of one or more independent variables. In regression analysis, logistic regression is estimating the parameters of a logistic model. Formally, in binary logistic regression there is a single binary dependent variable, coded by an indicator variable, where the two values are labeled "0" and "1", while the independent variables can each be a binary variable or a continuous variable. The corresponding probability of the value labeled "1" can vary between 0 and 1, hence the labeling; the function that converts log-odds to probability is the logistic function, hence the name. The unit of measurement for the log-odds scale is called a logit, from logistic unit, hence the alternative names. See § Background and § Definition for formal mathematics, and § Example for a worked example.

A weight function is a mathematical device used when performing a sum, integral, or average to give some elements more "weight" or influence on the result than other elements in the same set. The result of this application of a weight function is a weighted sum or weighted average. Weight functions occur frequently in statistics and analysis, and are closely related to the concept of a measure. Weight functions can be employed in both discrete and continuous settings. They can be used to construct systems of calculus called "weighted calculus" and "meta-calculus".

<span class="mw-page-title-main">Dependent and independent variables</span> Concept in mathematical modeling, statistical modeling and experimental sciences

A variable is considered dependent if it depends on an independent variable. Dependent variables are studied under the supposition or demand that they depend, by some law or rule, on the values of other variables. Independent variables, in turn, are not seen as depending on any other variable in the scope of the experiment in question. In this sense, some common independent variables are time, space, density, mass, fluid flow rate, and previous values of some observed value of interest to predict future values.

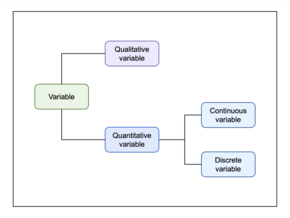
In statistics, a categorical variable is a variable that can take on one of a limited, and usually fixed, number of possible values, assigning each individual or other unit of observation to a particular group or nominal category on the basis of some qualitative property. In computer science and some branches of mathematics, categorical variables are referred to as enumerations or enumerated types. Commonly, each of the possible values of a categorical variable is referred to as a level. The probability distribution associated with a random categorical variable is called a categorical distribution.

<span class="mw-page-title-main">Joint probability distribution</span> Type of probability distribution

Given two random variables that are defined on the same probability space, the joint probability distribution is the corresponding probability distribution on all possible pairs of outputs. The joint distribution can just as well be considered for any given number of random variables. The joint distribution encodes the marginal distributions, i.e. the distributions of each of the individual random variables and the conditional probability distributions, which deal with how the outputs of one random variable are distributed when given information on the outputs of the other random variable(s).

<span class="mw-page-title-main">Mathematical statistics</span> Branch of statistics

Mathematical statistics is the application of probability theory, a branch of mathematics, to statistics, as opposed to techniques for collecting statistical data. Specific mathematical techniques which are used for this include mathematical analysis, linear algebra, stochastic analysis, differential equations, and measure theory.

This glossary of statistics and probability is a list of definitions of terms and concepts used in the mathematical sciences of statistics and probability, their sub-disciplines, and related fields. For additional related terms, see Glossary of mathematics and Glossary of experimental design.

In mathematics, a variable is a symbol that represents a mathematical object. A variable may represent a number, a vector, a matrix, a function, the argument of a function, a set, or an element of a set.

In probability theory, random element is a generalization of the concept of random variable to more complicated spaces than the simple real line. The concept was introduced by Maurice Fréchet (1948) who commented that the “development of probability theory and expansion of area of its applications have led to necessity to pass from schemes where (random) outcomes of experiments can be described by number or a finite set of numbers, to schemes where outcomes of experiments represent, for example, vectors, functions, processes, fields, series, transformations, and also sets or collections of sets.”

<span class="mw-page-title-main">Data transformation (statistics)</span>

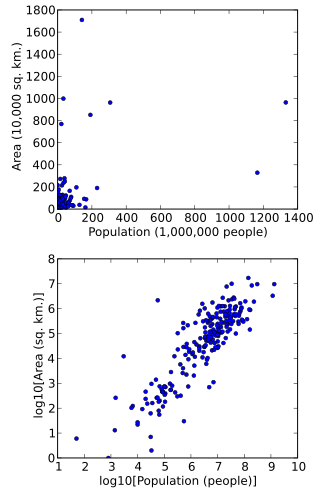
In statistics, data transformation is the application of a deterministic mathematical function to each point in a data set—that is, each data point zi is replaced with the transformed value yi = f(zi), where f is a function. Transforms are usually applied so that the data appear to more closely meet the assumptions of a statistical inference procedure that is to be applied, or to improve the interpretability or appearance of graphs.

In mathematical dynamics, discrete time and continuous time are two alternative frameworks within which variables that evolve over time are modeled.

In statistics, linear regression is a statistical model which estimates the linear relationship between a scalar response and one or more explanatory variables. The case of one explanatory variable is called simple linear regression; for more than one, the process is called multiple linear regression. This term is distinct from multivariate linear regression, where multiple correlated dependent variables are predicted, rather than a single scalar variable. If the explanatory variables are measured with error then errors-in-variables models are required, also known as measurement error models.

References

  1. Ali, Zulfiqar; Bhaskar, S. Bala (September 2016). "Basic statistical tools in research and data analysis". Indian Journal of Anaesthesia. 60 (9): 662–669. doi: 10.4103/0019-5049.190623 . PMC   5037948 .
  2. Kaliyadan, Feroze; Kulkarni, Vinay (January 2019). "Types of Variables, Descriptive Statistics, and Sample Size". Indian Dermatology Online Journal. 10 (1): 82–86. doi: 10.4103/idoj.IDOJ_468_18 . PMC   6362742 . PMID   30775310.
  3. K.D. Joshi, Foundations of Discrete Mathematics, 1989, New Age International Limited, , page 7.
  4. Brzychczy, Stanisaw; Gorniewicz, Lech (2011). "Continuous and discrete models of neural systems in infinite-dimensional abstract spaces". Neurocomputing. 74 (17): 2711–2715. doi:10.1016/j.neucom.2010.11.005.
  5. Griva, Igor; Nash, Stephen; Sofer, Ariela (2009). Linear and nonlinear optimization (2nd ed.). Philadelphia: Society for Industrial and Applied Mathematics. p. 7. ISBN   978-0-89871-661-0. OCLC   236082842.
  6. 1 2 Dekking, Frederik Michel; Kraaikamp, Cornelis; Lopuhaä, Hendrik Paul; Meester, Ludolf Erwin (2005). "A Modern Introduction to Probability and Statistics". Springer Texts in Statistics. doi:10.1007/1-84628-168-7. ISBN   978-1-85233-896-1. ISSN   1431-875X.
  7. Poyton, A. A.; Varziri, Mohammad Saeed; McAuley, Kimberley B.; MclellanPat James, Pat James; Ramsay, James O. (February 15, 2006). "Parameter estimation in continuous-time dynamic models using principal differential analysis". Computers & Chemical Engineering. 30 (4): 698–708. doi:10.1016/j.compchemeng.2005.11.008.
  8. Odifreddi, Piergiorgio (February 18, 1992). Classical Recursion Theory: The Theory of Functions and Sets of Natural Numbers. North Holland Publishing Company. p. 18. ISBN   978-0444894830.
  9. van Douwen, Eric (1984). Handbook of Set-Theoretic Topology. North Holland: Elsevier. pp. 113–167. ISBN   978-0-444-86580-9.
  10. Clogg, Clifford C.; Shockey, James W. (1988). Handbook of Multivariate Experimental Psychology. Boston, Massachusetts: Springer Publishing Company. pp. 337–365. ISBN   978-1-4613-0893-5.
  11. Thyagarajan, K.S. (2019). Introduction to Digital Signal Processing Using MATLAB with Application to Digital Communications (1 ed.). Springer Publishing Company. pp. 21–63. ISBN   978-3319760285.
  12. Miller, Jerry L.L.; Erickson, Maynard L. (May 1974). "On Dummy Variable Regression Analysis". Sociological Methods & Research. 2 (4): 395–519. doi:10.1177/004912417400200402.
  13. Hardy, Melissa A. (February 25, 1993). Regression with Dummy Variables (Quantitative Applications in the Social Sciences) (1st ed.). Newbury Park: Sage Publications, Inc. p. v. ISBN   0803951280.
  14. Olkin, Ingram; Tate, Robert (June 1961). "Multivariate Correlation Models with Mixed Discrete and Continuous Variables". The Annals of Mathematical Statistics. 32 (2): 448–465. doi: 10.1214/aoms/1177705052 .
  15. Fitzmaurice, Garrett M.; Laird, Nan M. (March 1997). "Regression Models for Mixed Discrete and Continuous Responses with Potentially Missing Values". Biometrics. 53 (1): 110–122. doi:10.2307/2533101.
  16. Sharma, Shalendra D. (March 1975). "On a Continuous/Discrete Time Queueing System with Arrivals in Batches of Variable Size and Correlated Departures". Journal of Applied Probability. 12 (1): 115–129. doi:10.2307/3212413.