Homogenization (climate)

Last updated

Homogenization in climate research means the removal of non-climatic changes. Next to changes in the climate itself, raw climate records also contain non-climatic jumps and changes, for example due to relocations or changes in instrumentation. The most used principle to remove these inhomogeneities is the relative homogenization approach in which a candidate station is compared to a reference time series based on one or more neighboring stations. The candidate and reference station(s) experience about the same climate, non-climatic changes that happen only in one station can thus be identified and removed.

Contents

Climate observations

To study climate change and variability, long instrumental climate records are essential, but are best not used directly. These datasets are essential since they are the basis for assessing century-scale trends or for studying the natural (long-term) variability of climate, amongst others. The value of these datasets, however, strongly depends on the homogeneity of the underlying time series. A homogeneous climate record is one where variations are caused only by variations in weather and climate. Long instrumental records are rarely, if ever homogeneous.

Results from the homogenization of instrumental western climate records indicate that detected inhomogeneities in mean temperature series occur at a frequency of roughly 15 to 20 years. [1] [2] [3] [4] [5] It should be kept in mind that most measurements have not been specifically made for climatic purposes, but rather to meet the needs of weather forecasting, agriculture and hydrology. [6] Moreover, the typical size of the breaks is often of the same order as the climatic change signal during the 20th century. [1] [2] [3] [4] [5] Inhomogeneities are thus a significant source of uncertainty for the estimation of secular trends and decadal-scale variability.

If all inhomogeneities would be purely random perturbations of the climate records, collectively their effect on the mean global climate signal would be negligible. However, certain changes are typical for certain periods and occurred in many stations, these are the most important causes as they can collectively lead to artificial biases in climate trends across large regions. [3] [7] [8]

Causes of inhomogeneities

Tokyo, an example of an urban heat island. Normal temperatures of Tokyo go up more than those of the surrounding area. HeatIsland Kanto en.png
Tokyo, an example of an urban heat island. Normal temperatures of Tokyo go up more than those of the surrounding area.

The best known inhomogeneity is the urban heat island effect. The temperature in cities can be warmer than in the surrounding country side, especially at night. Thus as cities grow, one may expect that temperatures measured in cities become higher. On the other hand, with the advent of aviation, many meteorological offices and thus their stations have often been relocated from cities to nearby, typically cooler, airports. [9]

Exterior of a Stevenson screen Stevenson screen exterior.JPG
Exterior of a Stevenson screen

Other non-climatic changes can be caused by changes in measurement methods. Meteorological instruments are typically installed in a screen to protect them from direct sun and wetting. [10] In the 19th century it was common to use a metal screen in front of a window on a North facing wall. However, the building may warm the screen leading to higher temperature measurements. When this problem was realized the Stevenson screen was introduced, typically installed in gardens, away from buildings. This is still the most typical weather screen with its characteristic double-louvre door and walls for ventilation. The historical Montsouri and Wilds screens were used around 1900 and are open to the North and to the bottom. This improves ventilation, but it was found that infra-red radiation from the ground can influence the measurement on sunny calm days. Therefore, they are no longer used. Nowadays automatic weather stations, which reduce labor costs, are becoming more common; they protect the thermometer by a number of white plastic cones. [8] This necessitated changes from manually recorded liquid and glass thermometers to automated electrical resistance thermometers, which reduced the recorded temperature values in the USA. [2]

Also other climate elements suffer from inhomogeneities. The precipitation amounts observed in the early instrumental period, roughly before 1900, are biased and are 10% lower than nowadays because the precipitation measurements were often made on a roof. At the time, instruments were installed on rooftops to ensure that the instrument is never shielded from the rain, but it was found later that due to the turbulent flow of the wind on roofs, some rain droplets and especially snow flakes did not fall into the opening. Consequently, measurements are nowadays performed closer to the ground.

Other typical causes of inhomogeneities are a change in measurement location; many observations, especially of precipitation are performed by volunteers in their garden or at their work place. Changes in the surrounding can often not be avoided, e.g., changes in the vegetation, the sealing of the land surface, and warm and sheltering buildings in the vicinity. There are also changes in measurement procedures such as the way the daily mean temperature is computed (by means of the minimum and maximum temperatures, or by averaging over 3 or 4 readings per day, or based on 10-minute data). Also changes in the observation times can lead to inhomogeneities. A recent review by Trewin focused on the causes of inhomogeneities. [9]

The inhomogeneities are not always errors. This is seen most clear for stations affected by warming due to the urban heat island effect. From the perspective of global warming, such local effects are undesirable, but to study the influence of climate on health such measurements are fine. Other inhomogeneities are due to compromises that have to be made between ventilation and protection against the sun and wetting in the design of a weather shelter. Trying to reduce one type of error (for a certain weather condition) in the design will often lead to the more errors from the other factors. Meteorological measurements are not made in the laboratory. Small errors are inevitable and may not be relevant for meteorological purposes, but if such an error changes, it may well be an inhomogeneity for climatology.

Homogenization

To reliably study the real development of the climate, non-climatic changes have to be removed. The date of the change is often documented (called meta data: data about data), but not always. Meta data is often only available in the local language. In the best case, there are parallel measurements with the original and the new set-up for several years. [11] This is a WMO (World Meteorological Organisation) guideline, but parallel measurements are unfortunately not very often performed, if only because the reason for stopping the original measurement is not known in advance, but probably more often to save money. By making parallel measurement with replicas of historical instruments, screens, etc. some of these inhomogeneities can still be studied today.

One way to study the influence of changes in measurement techniques is by making simultaneous measurements with historical and current instruments, procedures or screens. This picture shows three meteorological shelters next to each other in Murcia (Spain). The rightmost shelter is a replica of the Montsouri screen, in use in Spain and many European countries in the late 19th century and early 20th century. In the middle, Stevenson screen equipped with automatic sensors. Leftmost, Stevenson screen equipped with conventional meteorological instruments. Centre for Climate Change (C3) Terragona, weather screen intercomparison study.JPG
One way to study the influence of changes in measurement techniques is by making simultaneous measurements with historical and current instruments, procedures or screens. This picture shows three meteorological shelters next to each other in Murcia (Spain). The rightmost shelter is a replica of the Montsouri screen, in use in Spain and many European countries in the late 19th century and early 20th century. In the middle, Stevenson screen equipped with automatic sensors. Leftmost, Stevenson screen equipped with conventional meteorological instruments.

Because you are never sure that your meta data (station history) is complete, statistical homogenization should always be applied as well. The most commonly used statistical principle to detect and remove the effects of artificial changes is relative homogenization, which assumes that nearby stations are exposed to almost the same climate signal and that thus the differences between nearby stations can be utilized to detect inhomogeneities. [12] By looking at the difference time series, the year-to-year variability of the climate is removed, as well as regional climatic trends. In such a difference time series, a clear and persistent jump of, for example 1 °C, can easily be detected and can only be due to changes in the measurement conditions.

If there is a jump (break) in a difference time series, it is not yet clear which of the two stations it belongs to. Furthermore, time series typically have more than just one jump. These two features make statistical homogenization a challenging and beautiful statistical problem. Homogenization algorithms typically differ in how they try to solve these two fundamental problems. [13]

In the past, it was customary to compute a composite reference time series computed from multiple nearby stations, compare this reference to the candidate series and assume that any jumps found are due to the candidate series. [14] The latter assumption works because by using multiple stations as reference, the influence of inhomogeneities on the reference are much reduced. However, modern algorithms, no longer assume that the reference is homogeneous and can achieve better results this way. There are two main ways to do so. You can compute multiple composite reference time series from subsets of surrounding stations and test these references for homogeneity as well. [15] Alternatively, you can only use pairs of stations and by comparing all pairs with each other determine which station most likely is the one with the break. [4] If there is a break in 1950 in pair A&B and B&C, but not in A&C, the break is likely in station B; with more pairs such an inference can be made with more certainty.

If there are multiple breaks in a time series, the number of combinations easily becomes very large and it is becomes impossible to try them all. For example, in case of five breaks (k=5) in 100 years of annual data (n=100), the number of combinations is about 1005=1010 or 10 billion. This problem is sometimes solved iteratively/hierarchically, by first searching for the largest jump and then repeating the search in both sub-sections until they are too small. This does not always produce good results. A direct way to solve the problem is by an efficient optimization method called dynamic programming.

Sometimes there are no other stations in the same climate region. In this case, sometimes absolute homogenization is applied and the inhomogeneities are detected in the time series of one station. If there is a clear and large break at a certain date, one may be able to correct it, but smaller jumps and gradually occurring inhomogeneities (urban heat island or a growing vegetation) cannot be distinguished from real natural variability and climate change. Data homogenized this way does not have the quality you may expect and should be used with much care.

Inhomogeneities in climate data

By homogenizing climate datasets, it was found that sometimes inhomogeneities can cause biased trends in raw data; that homogenization is indispensable to obtain reliable regional or global trends. For example, for the Greater Alpine Region a bias in the temperature trend between the 1870s and 1980s of half a degree was found, which was due to decreasing urbanization of the network and systematic changes in the time of observation. [16] The precipitation records of the early instrumental period are biased by -10% due to the systematic higher installation of the gauges at the time. [17] Other possible bias sources are new types of weather shelters [3] [18] the change from liquid and glass thermometers to electrical resistance thermometers, [2] as well as the tendency to replace observers by automatic weather stations, [8] the urban heat island effect and the transfer of many urban stations to airports. [9]

Moreover, state-of-the-art relative homogenization algorithms developed to work with an inhomogeneous reference are shown to perform best. The study (from EGU) showed that automatic algorithms can perform as well as manual ones. [13]

See also

Related Research Articles

Climate Statistics of weather conditions in a given region over long periods

Climate is the long-term pattern of weather in an area, typically averaged over a period of 30 years. More rigorously, it is the mean and variability of meteorological variables over a time spanning from months to millions of years. Some of the meteorological variables that are commonly measured are temperature, humidity, atmospheric pressure, wind, and precipitation. In a broader sense, climate is the state of the components of the climate system, which includes the ocean, land, and ice on Earth. The climate of a location is affected by its latitude/longitude, terrain, and altitude, as well as nearby water bodies and their currents.

Climate variability and change Change in the statistical distribution of weather patterns for an extended period

Climate variability includes all the variations in the climate that last longer than individual weather events, whereas the term climate change only refers to those variations that persist for a longer period of time, typically decades or more. In addition to the general meaning in which "climate change" may refer to any time in Earth's history, the term is commonly used to describe the current climate change now underway. In the time since the Industrial Revolution, the climate has increasingly been affected by human activities that are causing global warming and climate change.

Climatology Scientific study of climate, defined as weather conditions averaged over a period of time

Climatology or climate science is the scientific study of climate, scientifically defined as weather conditions averaged over a period of time. This modern field of study is regarded as a branch of the atmospheric sciences and a subfield of physical geography, which is one of the Earth sciences. Climatology now includes aspects of oceanography and biogeochemistry.

Instrumental temperature record In situ measurements that provides the temperature of Earths climate system

The instrumental temperature record provides the temperature of Earth's climate system from the historical network of in situ measurements of surface air temperatures and ocean surface temperatures.

Weather station Facility for atmospheric research and prediction

A weather station is a facility, either on land or sea, with instruments and equipment for measuring atmospheric conditions to provide information for weather forecasts and to study the weather and climate. The measurements taken include temperature, atmospheric pressure, humidity, wind speed, wind direction, and precipitation amounts. Wind measurements are taken with as few other obstructions as possible, while temperature and humidity measurements are kept free from direct solar radiation, or insolation. Manual observations are taken at least once daily, while automated measurements are taken at least once an hour. Weather conditions out at sea are taken by ships and buoys, which measure slightly different meteorological quantities such as sea surface temperature (SST), wave height, and wave period. Drifting weather buoys outnumber their moored versions by a significant amount.

Proxy (climate) Preserved physical characteristics allowing reconstruction of past climatic conditions

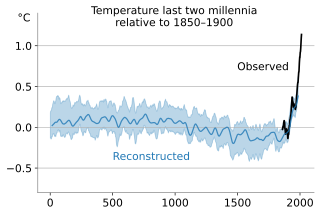
In the study of past climates ("paleoclimatology"), climate proxies are preserved physical characteristics of the past that stand in for direct meteorological measurements and enable scientists to reconstruct the climatic conditions over a longer fraction of the Earth's history. Reliable global records of climate only began in the 1880s, and proxies provide the only means for scientists to determine climatic patterns before record-keeping began.

Warren White is a professor emeritus, and a former Research Oceanographer at the Marine Biological Research Division at Scripps Institution of Oceanography at UC San Diego.

Sea surface temperature Water temperature close to the oceans surface

Sea surface temperature (SST), or ocean surface temperature, is the water temperature close to the ocean's surface. The exact meaning of surface varies according to the measurement method used, but it is between 1 millimetre (0.04 in) and 20 metres (70 ft) below the sea surface. Air masses in the Earth's atmosphere are highly modified by sea surface temperatures within a short distance of the shore. Localized areas of heavy snow can form in bands downwind of warm water bodies within an otherwise cold air mass. Warm sea surface temperatures are known to be a cause of tropical cyclogenesis over the Earth's oceans. Tropical cyclones can also cause a cool wake, due to turbulent mixing of the upper 30 metres (100 ft) of the ocean. SST changes diurnally, like the air above it, but to a lesser degree. There is less SST variation on breezy days than on calm days. In addition, ocean currents such as the Atlantic Multidecadal Oscillation (AMO), can effect SST's on multi-decadal time scales, a major impact results from the global thermohaline circulation, which affects average SST significantly throughout most of the world's oceans.

Automatic weather station Meteorological instrument

An automatic weather station (AWS) is an automated version of the traditional weather station, either to save human labour or to enable measurements from remote areas. An AWS will typically consist of a weather-proof enclosure containing the data logger, rechargeable battery, telemetry (optional) and the meteorological sensors with an attached solar panel or wind turbine and mounted upon a mast. The specific configuration may vary due to the purpose of the system. The system may report in near real time via the Argos System and the Global Telecommunications System, or save the data for later recovery.

Index of meteorology articles Wikipedia index

This is a list of meteorology topics. The terms relate to meteorology, the interdisciplinary scientific study of the atmosphere that focuses on weather processes and forecasting.

David Russell Legates is an American professor of geography at the University of Delaware. He is the former Director of the Center for Climatic Research at the same university and a former Delaware state climatologist. In September 2020, the Trump administration appointed him as deputy assistant secretary of commerce for observation and prediction at the National Oceanic and Atmospheric Administration.

The Winkler Index, sometimes known as the Winkler Scale or WinklerRegions, is a technique for classifying the climate of wine growing regions based on heat summation or growing degree-days. In the system, geographical areas are divided into five climate regions based on temperature converted to growing degree-days, and is commonly known as Regions I–V. The system was developed at the University of California, Davis by A. J. Winkler and Maynard Amerine.

The Global Historical Climatology Network (GHCN) is a database of temperature, precipitation and pressure records managed by the National Climatic Data Center (NDCC), Arizona State University and the Carbon Dioxide Information Analysis Center.

Mesonet

In meteorology, a mesonet, portmanteau of mesoscale network, is a network of (typically) automated weather and environmental monitoring stations designed to observe mesoscale meteorological phenomena. Dry lines, squall lines, and sea breezes are examples of phenomena that can be observed by mesonets. Due to the space and time scales associated with mesoscale phenomena, weather stations comprising a mesonet will be spaced closer together and report more frequently than synoptic scale observing networks, such as ASOS. The term mesonet refers to the collective group of these weather stations, which are typically owned and operated by a common entity. Mesonets usually record in situ surface weather observations but some involve other observation platforms, particularly vertical profiles of the planetary boundary layer (PBL).

Surface weather observation

Surface weather observations are the fundamental data used for safety as well as climatological reasons to forecast weather and issue warnings worldwide. They can be taken manually, by a weather observer, by computer through the use of automated weather stations, or in a hybrid scheme using weather observers to augment the otherwise automated weather station. The ICAO defines the International Standard Atmosphere (ISA), which is the model of the standard variation of pressure, temperature, density, and viscosity with altitude in the Earth's atmosphere, and is used to reduce a station pressure to sea level pressure. Airport observations can be transmitted worldwide through the use of the METAR observing code. Personal weather stations taking automated observations can transmit their data to the United States mesonet through the Citizen Weather Observer Program (CWOP), the UK Met Office through their Weather Observations Website (WOW), or internationally through the Weather Underground Internet site. A thirty-year average of a location's weather observations is traditionally used to determine the station's climate. In the US a network of Cooperative Observers make a daily record of summary weather and sometimes water level information.

European Climate Assessment and Dataset

The European Climate Assessment and Dataset (ECA&D) is a database of daily meteorological station observations across Europe and is gradually being extended to countries in the Middle East and North Africa. ECA&D has attained the status of Regional Climate Centre for high-resolution observation data in World Meteorological Organization Region VI.

Climate of Africa Climate of the continent

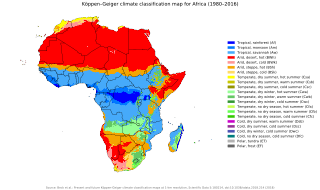
The climate of Africa is a range of climates such as the equatorial climate, the tropical wet and dry climate, the tropical monsoon climate, the semi-arid climate, the desert climate, and the subtropical highland climate. Temperate climates are rare across the continent except at very high elevations and along the fringes. In fact, the climate of Africa is more variable by rainfall amount than by temperatures, which are consistently high. African deserts are the sunniest and the driest parts of the continent, owing to the prevailing presence of the subtropical ridge with subsiding, hot, dry air masses. Africa holds many heat-related records: the continent has the hottest extended region year-round, the areas with the hottest summer climate, the highest sunshine duration, and more.

Global terrestrial stilling is the decrease of wind speed observed near the Earth's surface over the last three decades, originally termed "stilling". This slowdown of near-surface terrestrial winds has mainly affected mid-latitude regions of both hemispheres, with a global average reduction of −0.140 m s−1 dec−1 or between 5 and 15% over the past 50 years. With high-latitude showing increases in both hemispheres. In contrast to the observed weakening of winds over continental surfaces, winds have tended to strengthen over ocean regions. In the last few years, a break in this terrestrial decrease of wind speed has been detected suggesting a recovery at global scales since 2013.

Ingeborg Auer is an Austrian climatologist, known for her work on Project HISTALP.

Madeleine Renom Uruguayan meteorologist

Madeleine Renom Molina is a Uruguayan teacher, researcher and meteorologist. She was the first Graduate in Meteorological Sciences from the University of the Republic. Renom specialized in the University of Buenos Aires obtaining her doctorate in Atmospheric and Ocean Sciences. Renom is a professor in the Department of Atmospheric Sciences of the Physics Institute of the Faculty of Sciences, and a researcher at the PEDECIBA-Geosciences and level I researcher of the National System of Researchers of the ANII. She was the Director of the Uruguayan Institute of Meteorology (INUMET) up until July 15, 2020.

References

  1. 1 2 Auer, I., R. Bohm, A. Jurkovic, W. Lipa, A. Orlik, R. Potzmann, W. Schoner, M. Ungersbock, C. Matulla, P. Jones, D. Efthymiadis, M. Brunetti, T. Nanni, K. Briffa, M. Maugeri, L. Mercalli, O. Mestre, et al. "HISTALP - Historical instrumental climatological surface time series of the Greater Alpine Region". Int. J. Climatol., 27, pp. 17-46, doi : 10.1002/joc.1377, 2007.
  2. 1 2 3 4 Menne, M. J., Williams, C. N. jr., and Vose, R. S.: "The U.S. historical climatology network monthly temperature data, version 2". Bull. Am. Meteorol. Soc., 90, (7), 993-1007, doi : 10.1175/2008BAMS2613.1, 2009.
  3. 1 2 3 4 Brunetti M., Maugeri, M., Monti, F., and Nanni, T.: Temperature and precipitation variability in Italy in the last two centuries from homogenized instrumental time series. International Journal of Climatology, 26, pp. 345–381, doi : 10.1002/joc.1251, 2006.
  4. 1 2 3 Caussinus, H. and Mestre, O.: "Detection and correction of artificial shifts in climate series". Journal of the Royal Statistical Society: Series C (Applied Statistics), 53 (3), 405-425, doi : 10.1111/j.1467-9876.2004.05155.x, 2004.
  5. 1 2 Della-Marta, P. M., Collins, D., and Braganza, K.: "Updating Australia’s high quality annual temperature dataset". Austr. Meteor. Mag., 53, 277-292, 2004.
  6. Williams, C. N. jr., Menne, M. J., Thorne, P.W. "Benchmarking the performance of pairwise homogenization of surface temperatures in the United States. Journal of Geophysical Research-Atmospheres", 117, D5, doi : 10.1029/2011JD016761, 2012.
  7. Menne, M. J., Williams, C. N. jr., and Palecki M. A.: "On the reliability of the U.S. surface temperature record". J. Geophys. Res. Atmos., 115, no. D11108, doi : 10.1029/ , 2010.
  8. 1 2 3 Begert, M., Schlegel, T., and Kirchhofer, W.: "Homogeneous temperature and precipitation series of Switzerland from 1864 to 2000". Int. J. Climatol., doi : 10.1002/joc.1118, 25, 65–80, 2005.
  9. 1 2 3 Trewin, B.: "Exposure, instrumentation, and observing practice effects on land temperature measurements". WIREs Clim. Change, 1, 490–506, doi : 10.1002/wcc.46, 2010.
  10. Meulen, van der, J.P. and T. Brandsma. "Thermometer screen intercomparison in De Bilt (The Netherlands), part I: Understanding the weather-dependent temperature differences". Int. J. Climatol., doi : 10.1002/joc.1531, 28, 371-387, 2008.
  11. Aguilar E., Auer, I., Brunet, M., Peterson, T. C., and Wieringa, J.: Guidelines on climate metadata and homogenization. World Meteorological Organization, WMO-TD No. 1186, WCDMP No. 53, Geneva, Switzerland, 55 p., 2003.
  12. Conrad, V. and Pollak, C.: Methods in Climatology. Harvard University Press, Cambridge, MA, 459 p., 1950.
  13. 1 2 Venema, V., O. Mestre, E. Aguilar, I. Auer, J.A. Guijarro, P. Domonkos, G. Vertacnik, T. Szentimrey, P. Stepanek, P. Zahradnicek, J. Viarre, G. Müller-Westermeier, M. Lakatos, C.N. Williams, M.J. Menne, R. Lindau, D. Rasol, E. Rustemeier, K. Kolokythas, T. Marinova, L. Andresen, F. Acquaotta, S. Fratianni, S. Cheval, M. Klancar, M. Brunetti, Ch. Gruber, M. Prohom Duran, T. Likso, P. Esteban, Th. Brandsma. "Benchmarking homogenization algorithms for monthly data". Climate of the Past, 8, 89-115, doi : 10.5194/cp-8-89-2012, 2012.
  14. Alexandersson, A.: "A homogeneity test applied to precipitation data". J. Climatol., doi : 10.1002/joc.3370060607, 6, 661-675, 1986.
  15. Szentimrey, T.: "Multiple Analysis of Series for Homogenization (MASH)". Proceedings of the second seminar for homogenization of surface climatological data, Budapest, Hungary; WMO, WCDMP-No. 41, 27-46, 1999.
  16. Böhm R., Auer, I., Brunetti, M., Maugeri, M., Nanni, T., and Schöner, W.: "Regional temperature variability in the European Alps 1760–1998 from homogenized instrumental time series". International Journal of Climatology, doi : 10.1002/joc.689, 21, pp. 1779–1801, 2001.
  17. Auer I, Böhm, R., Jurkovic, A., Orlik, A., Potzmann, R., Schöner W., et al.: A new instrumental precipitation dataset for the Greater Alpine Region for the period 1800–2002. International Journal of Climatology, doi : 10.1002/joc.1135, 25, 139–166, 2005.
  18. Brunet, M., Asin, J., Sigró, J., Banón, M., García, F., Aguilar, E., Esteban Palenzuela, J., Peterson, T. C., and Jones, P.: "The minimization of the screen bias from ancient Western Mediterranean air temperature records: an exploratory statistical analysis". Int. J. Climatol., doi : 10.1002/joc.2192, 2010.