
Innovation is the practical implementation of ideas that result in the introduction of new goods or services or improvement in offering goods or services. ISO TC 279 in the standard ISO 56000:2020 defines innovation as "a new or changed entity, realizing or redistributing value". Others have different definitions; a common element in the definitions is a focus on newness, improvement, and spread of ideas or technologies.

The automotive industry comprises a wide range of companies and organizations involved in the design, development, manufacturing, marketing, selling, repairing, and modification of motor vehicles. It is one of the world's largest industries by revenue.
The knowledge economy, or knowledge-based economy, is an economic system in which the production of goods and services is based principally on knowledge-intensive activities that contribute to advancement in technical and scientific innovation. The key element of value is the greater dependence on human capital and intellectual property as the source of innovative ideas, information and practices. Organisations are required to capitalise on this "knowledge" in their production to stimulate and deepen the business development process. There is less reliance on physical input and natural resources. A knowledge-based economy relies on the crucial role of intangible assets within the organisations' settings in facilitating modern economic growth.
A value chain is a progression of activities that a business or firm performs in order to deliver goods and services of value to an end customer. The concept comes from the field of business management and was first described by Michael Porter in his 1985 best-seller, Competitive Advantage: Creating and Sustaining Superior Performance.
The idea of [Porter's Value Chain] is based on the process view of organizations, the idea of seeing a manufacturing organization as a system, made up of subsystems each with inputs, transformation processes and outputs. Inputs, transformation processes, and outputs involve the acquisition and consumption of resources – money, labour, materials, equipment, buildings, land, administration and management. How value chain activities are carried out determines costs and affects profits.
Productivity is the efficiency of production of goods or services expressed by some measure. Measurements of productivity are often expressed as a ratio of an aggregate output to a single input or an aggregate input used in a production process, i.e. output per unit of input, typically over a specific period of time. The most common example is the (aggregate) labour productivity measure, one example of which is GDP per worker. There are many different definitions of productivity and the choice among them depends on the purpose of the productivity measurement and data availability. The key source of difference between various productivity measures is also usually related to how the outputs and the inputs are aggregated to obtain such a ratio-type measure of productivity.

The open-design movement involves the development of physical products, machines and systems through use of publicly shared design information. This includes the making of both free and open-source software (FOSS) as well as open-source hardware. The process is generally facilitated by the Internet and often performed without monetary compensation. The goals and philosophy of the movement are identical to that of the open-source movement, but are implemented for the development of physical products rather than software. Open design is a form of co-creation, where the final product is designed by the users, rather than an external stakeholder such as a private company.
User innovation refers to innovation by intermediate users or consumer users, rather than by suppliers. This is a concept closely aligned to co-design and co-creation, and has been proven to result in more innovative solutions than traditional consultation methodologies.

Design management is a field of inquiry that uses design, strategy, project management and supply chain techniques to control a creative process, support a culture of creativity, and build a structure and organization for design. The objective of design management is to develop and maintain an efficient business environment in which an organization can achieve its strategic and mission goals through design. Design management is a comprehensive activity at all levels of business, from the discovery phase to the execution phase. "Simply put, design management is the business side of design. Design management encompasses the ongoing processes, business decisions, and strategies that enable innovation and create effectively-designed products, services, communications, environments, and brands that enhance our quality of life and provide organizational success." The discipline of design management overlaps with marketing management, operations management, and strategic management.

Workforce productivity is the amount of goods and services that a group of workers produce in a given amount of time. It is one of several types of productivity that economists measure. Workforce productivity, often referred to as labor productivity, is a measure for an organisation or company, a process, an industry, or a country.
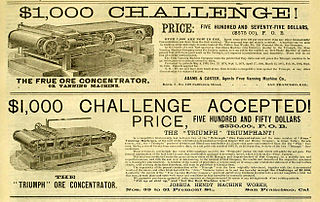
In economics, competition is a scenario where different economic firms are in contention to obtain goods that are limited by varying the elements of the marketing mix: price, product, promotion and place. In classical economic thought, competition causes commercial firms to develop new products, services and technologies, which would give consumers greater selection and better products. The greater the selection of a good is in the market, the lower prices for the products typically are, compared to what the price would be if there was no competition (monopoly) or little competition (oligopoly).
The Gerschenkron effect, developed by Alexander Gerschenkron, claims that changing the base year for an index determines the growth rate of the index. This effect is applicable only to aggregation method using reference price structure or reference volume structure. However, if production is measured by "real" tearms, this effect does not exist.
The Information Technology and Innovation Foundation (ITIF) is a U.S. nonprofit public policy think tank based in Washington, D.C., focused on public policy surrounding industry and technology. As of 2019, the University of Pennsylvania ranks ITIF as the most authoritative science and technology policy think tank in the world. In its role in developing industrial and technological policies, ITIF has attracted controversy for its affiliations with various technology companies.
Service innovation is used to refer to many things. These include but not limited to:
- Innovation in services, in service products – new or improved service products. Often this is contrasted with “technological innovation”, though service products can have technological elements. This sense of service innovation is closely related to service design and "new service development".
- Innovation in service processes – new or improved ways of designing and producing services. This may include innovation in service delivery systems, though often this will be regarded instead as a service product innovation. Innovation of this sort may be technological, technological - or expertise -based, or a matter of work organization.
- Innovation in service firms, organizations, and industries – organizational innovations, as well as service product and process innovations, and the management of innovation processes, within service organizations.
Cambashi is an Anglo-American industry analyst firm, focused on the market for Information Technology in the manufacturing, distribution, energy, utilities and construction industries. The company serves both suppliers and users of Information technology. It provides advisory services suppliers in its field, especially in the fields of Product Lifecycle Management and Industrial Automation applications such as Manufacturing Operations Management.
The National Competitiveness Report of Armenia (ACR) is an annual publication of EV Consulting and the Economy and Values Research Center that aims to encourage and foster in-depth dialogue and analysis on improving Armenia's competitiveness.

Manufacturing is a vital economic sector in the United States. The United States is the world's second-largest manufacturer after the People's Republic of China with a record high real output in 2021 of $2.5 trillion.

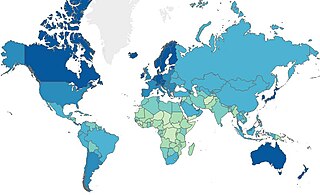
The Global Innovation Index is an annual ranking of countries by their capacity for, and success in, innovation, published by the World Intellectual Property Organization (WIPO). It was started in 2007 by INSEAD and World Business, a British magazine. Until 2021 it was published by WIPO, in partnership with Cornell University, INSEAD and other organisations and institutions. It is based on both subjective and objective data derived from several sources, including the International Telecommunication Union, the World Bank and the World Economic Forum.

Nicholas Everett Hollis, born May 11, 1944, in Randolph, Vermont, became a leading trade expansionist over the last three decades of the twentieth century sponsoring dozens of high-level trade/investment missions and international conferences utilizing influential business and government positions in organizations, including the U.S. Chamber of Commerce, National Association of Manufacturers (NAM), Industry Center for Trade Negotiations (ICTN), U.S. Department of State/Agency for International Development (USAID), Agri-Energy Roundtable (AER), and most recently as president of The Agribusiness Council (ABC), a nonprofit organization founded by Henry Heinz II in 1967.
The Social Progress Index (SPI) measures the extent to which countries provide for the social and environmental needs of their citizens. Fifty-four indicators in the areas of basic human needs, foundations of well-being, and opportunity to progress show the relative performance of nations. The index is published by the nonprofit Social Progress Imperative, and is based on the writings of Amartya Sen, Douglass North, and Joseph Stiglitz. The SPI measures the well-being of a society by observing social and environmental outcomes directly rather than the economic factors. The social and environmental factors include wellness, equality, inclusion, sustainability and personal freedom and safety.
The Indigo Era is a concept publicized by businessman Mikhail Fridman, describing what he views as an emerging new era of economies and economics based on ideas, innovation, and creativity, replacing those based on the possession of natural resources. Fridman is the co-founder of LetterOne, an international investment business, and first publicized the idea in early 2016. The word "indigo" was initially chosen based on the term indigo children, which has been used to describe people with unusual and innovative abilities.
