This is a list of countries by age at first marriage. This list is current from contemporary surveys and does not treat the topic in history. Currency of information varies by country. Because the age distribution of people at first marriage is skewed with a longer tail towards older ages, [1] the majority of people marry before the average age of first marriage. The median age is a more precise representation of when the majority of people marry; for most reporting sources, however, only the average age at marriage is reported.
Country | Men | Women | Average | Age Gap | Age Ratio | Year | Source |
---|---|---|---|---|---|---|---|
Algeria (more info) | 32.4 | 28.2 | 30.3 | 4.2 | 1.15 | 2012 | [2] |
Angola | 24.7 | 21.4 | 23.1 | 3.3 | 1.15 | 2001 | [3] |
Benin [lower-alpha 1] | 23.8 | 18.7 | 21.3 | 5.1 | 1.27 | 2006 | [3] |
Botswana | 30.9 | 26.4 | 28.7 | 4.5 | 1.17 | 2001 | [2] |
Burkina Faso [lower-alpha 1] | 24.3 | 17.9 | 21.1 | 6.4 | 1.36 | 2010 | [3] |
Burundi [lower-alpha 1] | 23.6 | 20.3 | 22 | 3.3 | 1.16 | 2010 | [3] |
Cape Verde [lower-alpha 1] | 26.2 | 21.5 | 23.9 | 4.7 | 1.22 | 2010 | [3] |
Cameroon [lower-alpha 1] (more info) | 25.8 | 19.0 | 22.4 | 6.8 | 1.36 | 2011 | [3] |
Central African Republic | 21.7 | 17.3 | 19.5 | 4.4 | 1.25 | 2010 | [2] |
Chad | 24.7 | 18.8 | 21.8 | 5.9 | 1.31 | 2004 | [2] |
Comoros [lower-alpha 1] | 25.6 | 20.4 | 23 | 5.2 | 1.25 | 1996 | [3] |
Congo [lower-alpha 1] | 25.1 | 21.0 | 23.1 | 4.1 | 1.2 | 2009 | [3] |
Ivory Coast [lower-alpha 1] | 26.7 | 19.5 | 23.1 | 7.2 | 1.37 | 2005 | [3] |
DR Congo [lower-alpha 1] | 24.2 | 19.0 | 21.6 | 5.2 | 1.27 | 2007 | [3] |
Djibouti | 30.8 | 26.9 | 28.9 | 3.9 | 1.14 | 2002 | [2] |
Egypt (more info) | 31.0 | 25.0 | 28 | 6 | 1.24 | 2019 | [4] |
Equatorial Guinea | 26.1 | 20.5 | 23.3 | 5.6 | 1.27 | 2011 | [2] |
Eritrea | 29.1 | 20.6 | 24.9 | 8.5 | 1.41 | 2002 | [2] |
Eswatini | 30.5 | 26.5 | 28.5 | 4 | 1.15 | 2007 | [2] |
Ethiopia | 25.8 | 21.3 | 23.6 | 4.5 | 1.21 | 2016 | [2] |
Gabon [lower-alpha 1] | 24.7 | 20.4 | 22.6 | 4.3 | 1.21 | 2000 | [3] |
Gambia | 29.7 | 21.5 | 25.6 | 8.2 | 1.38 | 2013 | [2] |
Ghana [lower-alpha 1] (more info) | 25.7 | 21.7 | 23.7 | 4 | 1.18 | 2008 | [3] |
Guinea | 28.0 | 19.8 | 23.9 | 8.2 | 1.41 | 2014 | [2] |
Guinea-Bissau | 28.1 | 20.9 | 24.5 | 7.2 | 1.34 | 2000 | [2] |
Kenya [lower-alpha 1] | 24.8 | 20.2 | 22.5 | 4.6 | 1.23 | 2008-2009 | [3] |
Lesotho [lower-alpha 1] | 25.5 | 20.9 | 23.2 | 4.6 | 1.22 | 2009 | [3] |
Liberia [lower-alpha 1] | 23.4 | 18.9 | 21.2 | 4.5 | 1.24 | 2007 | [3] |
Libya | 32.0 | 29.2 | 30.6 | 2.8 | 1.1 | 1995 | [5] |
Madagascar [lower-alpha 1] | 22.3 | 18.4 | 20.4 | 3.9 | 1.21 | 2008 | [3] |
Malawi [lower-alpha 1] | 22.3 | 17.9 | 20.1 | 4.4 | 1.25 | 2010 | [3] |
Mali [lower-alpha 1] | 25.8 | 18.8 | 22.3 | 7 | 1.37 | 2018 | [2] |
Mauritania [lower-alpha 1] (more info) | 27.1 | 19.0 | 23.1 | 8.1 | 1.43 | 2000-2001 | [3] |
Mauritius | 29.8 | 25.4 | 27.6 | 4.4 | 1.17 | 2000 | [3] |
Morocco | 31.3 | 25.7 | 28.5 | 5.6 | 1.22 | 2019 | [6] |
Mozambique | 23.4 | 18.7 | 21.1 | 4.7 | 1.25 | 2017 | [2] |
Namibia [lower-alpha 1] | 31.7 | 29.2 | 30.5 | 2.5 | 1.09 | 2006-2007 | [3] |
Niger | 24.0 | 17.2 | 20.6 | 6.8 | 1.4 | 2015 | [2] |
Nigeria (more info) | 28.6 | 21.2 | 24.9 | 7.4 | 1.35 | 2013 | [2] |
Rwanda [lower-alpha 1] | 24.7 | 20.6 | 22.7 | 4.1 | 1.2 | 2010 | [3] |
São Tomé and Príncipe [lower-alpha 1] | 23.8 | 18.8 | 21.3 | 5 | 1.27 | 2008-2009 | [3] |
Senegal | 30.6 | 22.2 | 26.4 | 8.4 | 1.38 | 2017 | [2] |
Seychelles | 27.3 | 25.2 | 26.3 | 2.1 | 1.08 | 2002 | [2] |
Somalia | 26.5 | 20.6 | 23.6 | 5.9 | 1.29 | 1982 | [2] |
South Africa [lower-alpha 2] (more info) | 37.0 | 33.0 | 35 | 4 | 1.12 | 2019 | [7] |
South Sudan | 25.6 | 18.4 | 22 | 7.2 | 1.39 | 2010 | [2] |
Sudan (more info) | 28.9 | 21.9 | 25.4 | 7 | 1.32 | 2014 | [2] |
Tanzania [lower-alpha 1] | 23.8 | 18.9 | 21.4 | 4.9 | 1.26 | 2010 | [3] |
Togo | 27.6 | 22.3 | 25 | 5.3 | 1.24 | 2014 | [2] |
Tunisia | 32.9 | 28.2 | 30.6 | 4.7 | 1.17 | 2014 | [2] |
Uganda [lower-alpha 1] | 22.4 | 18.2 | 20.3 | 4.2 | 1.23 | 2011 | [3] |
Zambia [lower-alpha 1] | 23.7 | 18.7 | 21.2 | 5 | 1.27 | 2007 | [3] |
Zimbabwe [lower-alpha 1] | 24.6 | 19.9 | 22.3 | 4.7 | 1.24 | 2010-2011 | [3] |
Country | Men | Women | Average | Age Gap | Age Ratio | Year | Source |
---|---|---|---|---|---|---|---|
Antigua and Barbuda | 29.0 | 25.0 | 27 | 4 | 1.16 | 2001 | [2] |
Argentina | 34.1 | 33.2 | 33.7 | 0.9 | 1.03 | 2015 | [8] |
Bahamas | 30.6 | 27.0 | 28.8 | 3.6 | 1.13 | 2010 | [2] |
Barbados | 34.3 | 31.8 | 33.1 | 2.5 | 1.08 | 1990 | [2] |
Belize | 30.1 | 28.6 | 29.4 | 1.5 | 1.05 | 2010 | [2] |
Bolivia | 26.6 | 24.1 | 25.4 | 2.5 | 1.1 | 2012 | [2] |
Brazil | 33.0 | 30.0 | 31.5 | 3 | 1.1 | 2014 | [9] |
Canada (more info) | 31.0 | 29.6 | 30.3 | 1.4 | 1.05 | 2008 | [10] |
Chile (more info) | 35.3 | 32.6 | 34 | 2.7 | 1.08 | 2013 | [11] |
Colombia | 26.8 | 22.7 | 24.8 | 4.1 | 1.18 | 2015 | [2] |
Costa Rica | 34.0 | 31.0 | 32.5 | 3 | 1.1 | 2020 | [12] |
Cuba (more info) | 25.4 | 21.3 | 23.4 | 4.1 | 1.19 | 2012 | [2] |
Ecuador | 25.0 | 21.8 | 23.4 | 3.2 | 1.15 | 2010 | [2] |
El Salvador | 25.5 | 22.5 | 24 | 3 | 1.13 | 2007 | [2] |
Grenada | 34.4 | 31.0 | 32.7 | 3.4 | 1.11 | 1991 | [2] |
Guatemala | 23.6 | 21.3 | 22.5 | 2.3 | 1.11 | 1994 | [2] |
Guyana | 25.4 | 21.5 | 23.5 | 3.9 | 1.18 | 2009 | [2] |
Haiti | 28.7 | 24.9 | 26.8 | 3.8 | 1.15 | 2016 | [2] |
Honduras | 24.1 | 21.2 | 22.7 | 2.9 | 1.14 | 2012 | [2] |
Jamaica | 34.8 | 33.2 | 34 | 1.6 | 1.05 | 2021 | [2] |
Mexico | 33.4 | 30.5 | 32 | 2.9 | 1.1 | 2021 | [13] |
Nicaragua | 24.4 | 20.6 | 22.5 | 3.8 | 1.18 | 2005 | [2] |
Panama | 25.3 | 21.6 | 23.5 | 3.7 | 1.17 | 2010 | [2] |
Paraguay (more info) | 26.8 | 22.7 | 24.8 | 4.1 | 1.18 | 2002 | [2] |
Peru | 27.5 | 23.5 | 25.5 | 4 | 1.17 | 2012 | [2] |
Saint Kitts and Nevis | 32.1 | 31.3 | 31.7 | 0.8 | 1.03 | 1980 | [2] |
Saint Lucia | 35.1 | 33.7 | 34.4 | 1.4 | 1.04 | 1991 | [2] |
Saint Vincent and the Grenadines | 27.8 | 21.2 | 24.5 | 6.6 | 1.31 | 2012 | [2] |
Suriname | 32.8 | 29.3 | 31.1 | 3.5 | 1.12 | 2012 | [2] |
Trinidad and Tobago | 31.8 | 29.2 | 30.5 | 2.6 | 1.09 | 2011 | [2] |
United States (more info) | 30.2 | 28.4 | 29.3 | 1.8 | 1.06 | 2023 | [14] |
Uruguay | 26.5 | 24.0 | 25.3 | 2.5 | 1.1 | 2011 | [2] |
Venezuela | 26.0 | 22.7 | 24.4 | 3.3 | 1.15 | 2001 | [2] |
Country | Men | Women | Average | Age Gap | Age Ratio | Year | Source |
---|---|---|---|---|---|---|---|
Afghanistan | 24.7 | 21.5 | 23.1 | 3.2 | 1.15 | 2015 | [2] |
Armenia | 30.5 | 27.1 | 28.8 | 3.4 | 1.13 | 2019 | [15] |
Azerbaijan | 28.1 | 24.0 | 26.1 | 4.1 | 1.17 | 2019 | [15] |
Bahrain | 30.0 | 26.3 | 28.2 | 3.7 | 1.14 | 2001 | [2] |
Bangladesh [lower-alpha 1] (more info) | 26.5 | 25.0 | 25.8 | 1.5 | 1.06 | 2019 | [3] |
Bhutan | 25.4 | 22.8 | 24.1 | 2.6 | 1.11 | 2007 | [2] |
Brunei | 27.3 | 25.1 | 26.2 | 2.2 | 1.09 | 1991 | [2] |
Cambodia [lower-alpha 1] (more info) | 23.4 | 21.0 | 22.2 | 2.4 | 1.11 | 2010 | [3] |
China (more info) | 27.1 | 24.9 | 26 | 2.2 | 1.09 | 2017 | [16] |
Cyprus (more info) | 30.7 | 29.6 | 30.2 | 1.1 | 1.04 | 2019 | [15] |
Georgia | 30.7 | 28.1 | 29.4 | 2.6 | 1.09 | 2019 | [15] |
Hong Kong | 32.1 | 30.6 | 31.4 | 1.5 | 1.05 | 2022 | [17] |
India (more info) | 28.0 | 25.3 | 26.7 | 2.7 | 1.11 | 2020 | [18] |
Indonesia (more info) | 24.0 | 20.0 | 22 | 4 | 1.2 | 2017 | [2] |
Iran (more info) | 27.4 | 23.8 | 25.6 | 3.6 | 1.15 | 2015 | [19] |
Iraq | 28.2 | 25.3 | 26.8 | 2.9 | 1.11 | 2004 | [2] |
Israel (more info) | 30.6 | 28.2 | 29.4 | 2.4 | 1.09 | 2018 | [15] |
Japan (more info) | 32.0 | 30.0 | 31 | 2 | 1.07 | 2020 | [20] |
Jordan (more info) | 31.3 | 26.6 | 29 | 4.7 | 1.18 | 2019 | [21] |
Kazakhstan [lower-alpha 1] | 27.6 | 25.0 | 26.3 | 2.6 | 1.1 | 2019 | [15] |
Kuwait | 28.9 | 27.5 | 28.2 | 1.4 | 1.05 | 2005 | [2] |
Kyrgyzstan | 27.2 | 23.6 | 25.4 | 3.6 | 1.15 | 2019 | [15] |
Laos | 23.3 | 20.5 | 21.9 | 2.8 | 1.14 | 2012 | [2] |
Lebanon | 32.8 | 28.8 | 30.8 | 4 | 1.14 | 2006 | [22] |
Malaysia (more info) | 27.0 | 25.0 | 26 | 2 | 1.08 | 2010 | [23] |
Maldives [lower-alpha 1] | 24.1 | 21.6 | 22.9 | 2.5 | 1.12 | 2009 | [3] |
Mongolia [lower-alpha 1] | 29.0 | 26.0 | 27.5 | 3 | 1.12 | 2019 | [24] |
Myanmar [lower-alpha 1] (more info) | 24.0 | 20.5 | 22.3 | 3.5 | 1.17 | 2007 | [3] |
Nepal [lower-alpha 1] | 23.6 | 20.1 | 21.9 | 3.5 | 1.17 | 2016 | [2] |
North Korea (more info) | 29.0 | 25.5 | 27.3 | 3.5 | 1.14 | 2008 | [2] |
Oman | 28.1 | 24.8 | 26.5 | 3.3 | 1.13 | 2003 | [2] |
Pakistan (more info) | 26.9 | 23.2 | 25.1 | 3.7 | 1.16 | 2017 | [2] |
Palestine [lower-alpha 3] | 25.4 | 20.1 | 22.8 | 5.3 | 1.26 | 2010 | [3] |
Philippines (more info) | 28.0 | 25.3 | 26.7 | 2.7 | 1.11 | 2011 | [25] |
Qatar | 27.3 | 25.4 | 26.4 | 1.9 | 1.07 | 2010 | [2] |
Saudi Arabia (more info) | 25.3 | 20.4 | 22.9 | 4.9 | 1.24 | 2018 | [26] |
Singapore (more info) | 30.1 | 27.9 | 29 | 2.2 | 1.08 | 2014 | [27] |
Sri Lanka | 27.2 | 23.4 | 25.3 | 3.8 | 1.16 | 2012 | [2] |
South Korea (more info) | 33.0 | 31.0 | 32 | 2 | 1.06 | 2022 | [28] |
Syria | 31.8 | 26.3 | 29.1 | 5.5 | 1.21 | 2016 | [29] |
Taiwan (more info) | 32.6 | 30.4 | 31.5 | 2.2 | 1.07 | 2019 | [30] |
Tajikistan | 26.2 | 22.1 | 24.2 | 4.1 | 1.19 | 2019 | [15] |
Thailand [lower-alpha 1] | 24.4 | 21.0 | 22.7 | 3.4 | 1.16 | 2010 | [3] |
East Timor [lower-alpha 1] | 25.0 | 20.6 | 22.8 | 4.4 | 1.21 | 2009-2010 | [3] |
Turkey (more info) | 27.9 | 25.0 | 26.5 | 2.9 | 1.12 | 2019 | [15] |
Turkmenistan | 24.6 | 23.3 | 24 | 1.3 | 1.06 | 2006 | [3] |
United Arab Emirates | 26.8 | 25.3 | 26.1 | 1.5 | 1.06 | 2005 | [2] |
Uzbekistan | 26.6 | 22.7 | 24.7 | 3.9 | 1.17 | 2019 | [15] |
Vietnam (more info) | 26.2 | 22.8 | 24.5 | 3.4 | 1.15 | 2009 | [31] |
Yemen | 26.1 | 23.0 | 24.6 | 3.1 | 1.13 | 2013 | [2] |
Country | Men | Women | Average | Age Gap | Age Ratio | Year | Source |
---|---|---|---|---|---|---|---|
Albania | 30.9 | 27.8 | 29.4 | 3.1 | 1.11 | 2019 | [15] |
Austria (more info) | 33.0 | 30.8 | 31.9 | 2.2 | 1.07 | 2019 | [15] |
Belarus | 28.3 | 26.1 | 27.2 | 2.2 | 1.08 | 2019 | [15] |
Belgium | 32.3 | 30.0 | 31.2 | 2.3 | 1.08 | 2015 | [15] |
Bosnia and Herzegovina | 29.5 | 26.8 | 28.2 | 2.7 | 1.1 | 2019 | [15] |
Bulgaria (more info) | 32.0 | 29.1 | 30.6 | 2.9 | 1.1 | 2019 | [15] |
Croatia | 31.5 | 28.9 | 30.2 | 2.6 | 1.09 | 2019 | [15] |
Czech Republic (more info) | 32.2 | 29.8 | 31 | 2.4 | 1.08 | 2017 | [15] |
Denmark | 35.0 | 32.7 | 33.9 | 2.3 | 1.07 | 2019 | [15] |
Estonia | 32.3 | 30.4 | 31.4 | 1.9 | 1.06 | 2019 | [15] |
Finland (more info) | 34.2 | 32.1 | 33.2 | 2.1 | 1.07 | 2019 | [15] |
France (more info) | 33.7 | 32.0 | 32.9 | 1.7 | 1.05 | 2013 | [2] |
Germany (more info) | 34.5 | 32.1 | 33.3 | 2.4 | 1.07 | 2019 | [15] |
Greece (more info) | 32.9 | 30.1 | 31.5 | 2.8 | 1.09 | 2017 | [15] |
Hungary | 32.8 | 30.1 | 31.5 | 2.7 | 1.09 | 2019 | [15] |
Iceland | 34.6 | 32.7 | 33.7 | 1.9 | 1.06 | 2011 | [15] |
Ireland (more info) | 36.8 | 34.8 | 35.8 | 2 | 1.06 | 2019 | [32] |
Italy (more info) | 33.7 | 31.5 | 32.6 | 2.2 | 1.07 | 2018 | [15] |
Latvia | 32.7 | 30.6 | 31.7 | 2.1 | 1.07 | 2019 | [15] |
Liechtenstein | 33.9 | 31.2 | 32.6 | 2.7 | 1.09 | 2019 | [15] |
Lithuania | 30.7 | 28.3 | 29.5 | 2.4 | 1.08 | 2019 | [15] |
Luxembourg | 34.3 | 31.8 | 33.1 | 2.5 | 1.08 | 2019 | [15] |
Malta | 30.5 | 28.5 | 29.5 | 2 | 1.07 | 2011 | [15] |
Moldova | 28.9 | 26.0 | 27.5 | 2.9 | 1.11 | 2019 | [15] |
Monaco | 33.4 | 30.4 | 31.9 | 3 | 1.1 | 2008 | [2] |
Montenegro | 31.1 | 28.0 | 29.6 | 3.1 | 1.11 | 2019 | [15] |
Netherlands | 33.0 | 30.9 | 32 | 2.1 | 1.07 | 2019 | [15] |
North Macedonia | 29.6 | 26.9 | 28.3 | 2.7 | 1.1 | 2019 | [15] |
Norway | 37.1 | 34.9 | 36 | 2.2 | 1.06 | 2023 | [33] |
Poland (more info) | 28.9 | 27.0 | 28 | 1.9 | 1.07 | 2019 | [15] |
Portugal | 33.9 | 32.4 | 33.2 | 1.5 | 1.05 | 2019 | [15] |
Romania | 31.6 | 28.3 | 30 | 3.3 | 1.12 | 2019 | [15] |
Russia (more info) | 28.1 | 25.5 | 26.8 | 2.6 | 1.1 | 2013 | [15] |
San Marino | 33.5 | 30.7 | 32.1 | 2.8 | 1.09 | 2014 | [2] |
Serbia | 31.4 | 28.6 | 30 | 2.8 | 1.1 | 2019 | [15] |
Slovakia (more info) | 31.9 | 29.4 | 30.7 | 2.5 | 1.09 | 2019 | [15] |
Slovenia | 32.8 | 30.7 | 31.8 | 2.1 | 1.07 | 2019 | [15] |
Spain (more info) | 35.6 | 33.6 | 34.6 | 2 | 1.06 | 2019 | [15] |
Sweden | 36.3 | 33.9 | 35.1 | 2.4 | 1.07 | 2019 | [15] |
Switzerland (more info) | 32.3 | 30.1 | 31.2 | 2.2 | 1.07 | 2019 | [15] |
Ukraine (more info) | 28.6 | 25.9 | 27.3 | 2.7 | 1.1 | 2019 | [15] |
United Kingdom (more info) | 33.6 | 31.7 | 32.7 | 1.9 | 1.06 | 2017 | [15] |
Note: the reported age for these countries is the median, not the mean (average). All countries in italics have their data in the mean and not the median.
Country | Men | Women | Median | Age Gap | Age Ratio | Year | Source |
---|---|---|---|---|---|---|---|
Australia (more info) | 32.1 | 30.5 | 31.3 | 1.6 | 1.05 | 2021 | [34] |
Fiji | 27.7 | 24.1 | 25.9 | 3.6 | 1.15 | 2007 | [2] |
Kiribati [lower-alpha 4] | 23.6 | 20.1 | 21.9 | 3.5 | 1.17 | 2009 | [35] |
Marshall Islands | 25.7 | 24.2 | 25 | 1.5 | 1.06 | 2011 | [36] |
Micronesia | 27.5 | 25.5 | 26.5 | 2 | 1.08 | 2010 | [37] |
Nauru [lower-alpha 5] | 22.8 | 21.2 | 22.0 | 1.6 | 1.08 | 2007 | [38] |
New Zealand (more info) | 30.6 | 29.4 | 30.0 | 1.2 | 1.04 | 2019 | [39] |
Palau | 28.9 | 26.6 | 27.8 | 2.3 | 1.09 | 2005 | [2] |
Papua New Guinea | 25.0 | 21.4 | 23.2 | 3.6 | 1.17 | 2006 | [2] |
Samoa | 28.7 | 24.1 | 26.4 | 4.6 | 1.19 | 2009 | [2] |
Solomon Islands [lower-alpha 5] | 25.6 | 20.3 | 23.0 | 5.3 | 1.26 | 2007 | [40] |
Tonga [lower-alpha 6] | 25.0 | 23.6 | 24.3 | 1.4 | 1.06 | 2012 | [41] |
Tuvalu [lower-alpha 5] | 27.2 | 22.1 | 24.7 | 5.1 | 1.23 | 2007 | [42] |
Vanuatu [lower-alpha 4] | 24.4 | 20.8 | 22.6 | 3.6 | 1.17 | 2013 | [43] |
Demographic features of the population of Cambodia include population density, ethnicity, education level, health of the populace, economic status, religious affiliations and other aspects of the population.
The demographics of Ethiopia encompass the demographic features of inhabitants in Ethiopia, including ethnicity, languages, population density, education level, health, economic status, religious affiliations and other aspects of the population.
India is the most populous country in the world with one-sixth of the world's population. According to estimates from the United Nations (UN), India has overtaken China as the country with the largest population in the world, with a population of 1,425,775,850 at the end of April 2023.
Demographic features of the population of Lesotho include population density, ethnicity, education level, health of the populace, economic status, religious affiliations and other aspects.
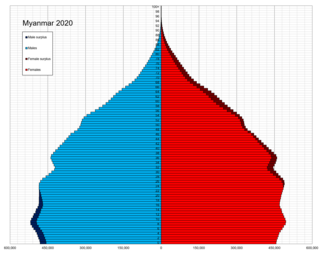
This is a demography of Myanmar including statistics such as population, ethnicity, language, education level, and religious affiliations.
The demographics of Nauru, an island country in the Pacific Ocean, are known through national censuses, which have been analysed by various statistical bureaus since the 1920s. The Nauru Bureau of Statistics have conducted this task since 1977—the first census since Nauru gained independence in 1968. The most recent census of Nauru was on 30 October 2021, when population had reached 11,680 people. The population density is 554 inhabitants per square kilometre, and the overall life expectancy is 63.9 years. The population rose steadily from the 1960s until 2006 when the Government of Nauru repatriated thousands of Tuvaluan and I-Kiribati workers from the country. Since 1992, Nauru's birth rate has exceeded its death rate; the natural growth rate is positive. In terms of age structure, the population is dominated by the 15–59-year-old segment (57%). The median age of the population is 21.6, and the estimated gender ratio of the population is 101.8 males per 100 females.
The current population of Nepal is 29,164,578 as per the 2021 census. The population growth rate is 0.92% per year.
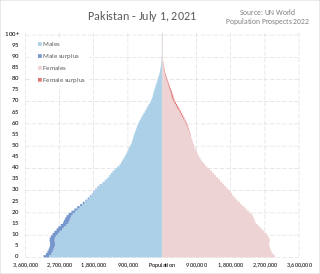
Pakistan had a population of 241,492,197 according to the final results of the 2023 Census. This figure includes Pakistan's four provinces e.g. Punjab, Sindh, KPK, Balochistan and Islamabad Capital Territory. AJK and Gilgit-Baltistan's census data is yet to be approved by CCI Council of Pakistan. Pakistan is the world's fifth most populous country.
This is a demography of the population of Sri Lanka including population density, ethnicity, education level, health of the population, economic status, religious affiliations and other aspects of the population.
Demographic features of the population of Vanuatu include population density, ethnicity, education level, health of the populace, economic status, religious affiliations and other aspects. 4% of the people living in Vanuatu are Europeans.
Adams County is a county in the U.S. state of Ohio. As of the 2020 census, the population was 27,477. Its county seat and largest village is West Union. The county is named after John Adams, the second President of the United States.
The demographic characteristics of the population of The Gambia are known through national censuses, conducted in ten-year intervals and analyzed by The Gambian Bureau of Statistics (GBOS) since 1963. The latest census was conducted in 2013. The population of The Gambia at the 2013 census was 1.8 million. The population density is 176.1 per square kilometer, and the overall life expectancy in The Gambia is 64.1 years. Since the first census of 1963, the population of The Gambia has increased every ten years by an average of 43.2 percent. Since 1950s, the birth rate has constantly exceeded the death rate; the natural growth rate is positive. The Gambia is in the second stage of demographic transition. In terms of age structure, The Gambia is dominated by 15- to 24-year-old segment (57.6%). The median age of the population is 19.9 years, and the gender ratio of the total population is 0.98 males per female.
The United States had an official estimated resident population of 334,914,895 on July 1, 2023, according to the U.S. Census Bureau. This figure includes the 50 states and the Washington, D.C. but excludes the population of five unincorporated U.S. territories as well as several minor island possessions. The United States is the third most populous country in the world, and the most populous in the Americas and the Western Hemisphere. The Census Bureau showed a population increase of 0.4% for the twelve-month period ending in July 2022, below the world average annual rate of 0.9%. The total fertility rate in the United States estimated for 2022 is 1.665 children per woman, which is below the replacement fertility rate of approximately 2.1. By several metrics, including racial and ethnic background, religious affiliation, and percentage of rural and urban divide, Illinois is the most representative of the larger demography of the United States.
Uinta County is a county in the U.S. state of Wyoming. As of the 2020 United States Census, the population was 20,450. Its county seat is Evanston. Its south and west boundary lines abut the Utah state line.
Calhoun County is a county in the U.S. state of South Carolina. As of the 2020 census, its population was 14,119, making it the third-least populous county in the state. Its county seat is St. Matthews. In terms of land area, it is also the smallest county in the state.
Madison County is a county located in the U.S. state of Idaho. As of the 2020 census, the population was 52,913. The county seat and largest city is Rexburg.
Demographic features of the population of Serbia include vital statistics, ethnicity, religious affiliations, education level, health of the populace, and other aspects of the population.
The Australian Bureau of Statistics (ABS) is an Australian Government agency that collects and analyses statistics on economic, population, environmental, and social issues to advise the Australian Government.
Personal income is an individual's total earnings from wages, investment interest, and other sources. The Bureau of Labor Statistics reported a median weekly personal income of $1,037 for full-time workers in the United States in Q1 2022. For the year 2020, the U.S. Census Bureau estimates that the median annual earnings for all workers was $41,535; and more specifically estimates that median annual earnings for those who worked full-time, year round, was $61,417 for men and $50,982 for women.
The demographics of Asian Americans describe a heterogeneous group of people in the United States who trace their ancestry to one or more Asian countries.
{{cite report}}
: CS1 maint: multiple names: authors list (link){{cite web}}
: CS1 maint: archived copy as title (link){{cite web}}
: CS1 maint: multiple names: authors list (link)In 2019, the median age at first marriage or civil union was 29.4 years for women and 30.6 years for men, compared with 27.0 and 28.9, respectively, in 1999...The median age at marriage for all marriages (rather than just first marriages) has been slowly increasing since the early 2000s...The median age for females in 2019 was the highest on record (the highest male median age was 32.6 years in 2006).
{{cite report}}
: CS1 maint: ignored ISBN errors (link)