This is a list of world regions by life expectancy at birth.
Estimation of the World Bank Group for 2021. [1] [2] [3] The values in the World Bank Group tables are rounded. All calculations are based on raw data, so due to the nuances of rounding, in some places illusory inconsistencies of indicators arose, with a size of 0.01 year.
| World regions | 2021 | Historical data | COVID-19 impact | ||||||||||||
|---|---|---|---|---|---|---|---|---|---|---|---|---|---|---|---|
| All | Male | Female | Sex gap | 2000 | 2000 →2014 | 2014 | 2014 →2019 | 2019 | 2019 →2020 | 2020 | 2020 →2021 | 2021 | 2019 →2021 | 2014 →2021 | |
| European Union | 80.39 | 77.66 | 83.27 | 5.61 | 77.08 | 3.80 | 80.87 | 0.44 | 81.31 | −0.86 | 80.45 | −0.06 | 80.39 | −0.93 | −0.48 |
| North America | 76.98 | 74.24 | 79.85 | 5.62 | 76.89 | 2.25 | 79.14 | 0.01 | 79.14 | −1.68 | 77.46 | −0.49 | 76.98 | −2.16 | −2.16 |
| Europe & Central Asia | 76.63 | 73.51 | 79.95 | 6.44 | 73.13 | 4.16 | 77.30 | 0.89 | 78.19 | −1.23 | 76.96 | −0.33 | 76.63 | −1.56 | −0.67 |
| East Asia & Pacific | 76.39 | 73.64 | 79.33 | 5.69 | 71.55 | 4.18 | 75.73 | 1.07 | 76.80 | −0.04 | 76.76 | −0.37 | 76.39 | −0.40 | 0.66 |
| Central Europe & the Baltics | 74.93 | 71.32 | 78.73 | 7.41 | 72.72 | 3.96 | 76.68 | 0.59 | 77.27 | −1.18 | 76.09 | −1.16 | 74.93 | −2.33 | −1.74 |
| Middle East & North Africa | 72.75 | 70.64 | 75.08 | 4.44 | 69.28 | 3.34 | 72.62 | 1.34 | 73.96 | −1.01 | 72.95 | −0.20 | 72.75 | −1.21 | 0.12 |
| Latin America & Caribbean | 72.15 | 68.80 | 75.70 | 6.90 | 71.23 | 3.32 | 74.55 | 0.49 | 75.04 | −2.00 | 73.04 | −0.89 | 72.15 | −2.89 | −2.40 |
| World | 71.33 | 68.89 | 73.95 | 5.06 | 67.70 | 4.18 | 71.88 | 1.10 | 72.98 | −0.74 | 72.24 | −0.92 | 71.33 | −1.65 | −0.55 |
| Arab world | 70.81 | 68.83 | 72.99 | 4.16 | 67.30 | 3.20 | 70.49 | 1.35 | 71.84 | −0.92 | 70.92 | −0.11 | 70.81 | −1.03 | 0.32 |
| South Asia | 67.58 | 65.89 | 69.43 | 3.54 | 62.89 | 5.75 | 68.64 | 1.83 | 70.47 | −0.72 | 69.75 | −2.17 | 67.58 | −2.89 | −1.06 |
| Africa Eastern & Southern | 62.45 | 59.89 | 65.08 | 5.18 | 51.96 | 9.37 | 61.34 | 2.42 | 63.76 | −0.44 | 63.31 | −0.86 | 62.45 | −1.30 | 1.12 |
| Sub-Saharan Africa | 60.24 | 58.26 | 62.28 | 4.01 | 51.26 | 7.88 | 59.14 | 2.10 | 61.24 | −0.40 | 60.85 | −0.61 | 60.24 | −1.00 | 1.10 |
| Africa Western & Central | 56.99 | 55.90 | 58.10 | 2.20 | 50.22 | 5.70 | 55.92 | 1.63 | 57.56 | −0.33 | 57.23 | −0.24 | 56.99 | −0.57 | 1.07 |
Estimation of the analytical agency of the UN. [4] [5] [6] By default, the list is sorted by 2022.
| World regions | 2019 | 2019 →2021 | 2021 | 2021 →2022 | 2022 | 2019 →2022 | |||||||||
|---|---|---|---|---|---|---|---|---|---|---|---|---|---|---|---|
| overall | male | female | F Δ M | overall | male | female | F Δ M | overall | male | female | F Δ M | ||||
| East Asia & Pacific | 75.4 | 73.1 | 78.0 | 4.9 | 0.2 | 75.6 | 72.9 | 78.5 | 5.6 | 0.6 | 76.2 | 73.6 | 79.0 | 5.4 | 0.8 |
| Latin America & Caribbean | 75.6 | 72.4 | 78.7 | 6.3 | −3.5 | 72.1 | 68.8 | 75.6 | 6.8 | 1.6 | 73.7 | 70.6 | 76.9 | 6.3 | −1.9 |
| Europe & Central Asia | 74.4 | 71.1 | 77.7 | 6.6 | −1.5 | 72.9 | 69.4 | 76.4 | 7.0 | 0.7 | 73.6 | 70.2 | 77.0 | 6.8 | −0.8 |
| World | 72.8 | 70.6 | 75.0 | 4.4 | −1.4 | 71.4 | 68.9 | 74.0 | 5.1 | 0.6 | 72.0 | 69.6 | 74.5 | 4.9 | −0.8 |
| Arab states | 72.1 | 70.4 | 73.9 | 3.5 | −1.2 | 70.9 | 68.9 | 73.1 | 4.2 | 0.4 | 71.3 | 69.3 | 73.5 | 4.2 | −0.8 |
| South Asia | 69.9 | 68.7 | 71.3 | 2.6 | −2.0 | 67.9 | 66.1 | 69.8 | 3.7 | 0.5 | 68.4 | 66.7 | 70.4 | 3.7 | −1.5 |
| Sub-Saharan Africa | 61.5 | 59.8 | 63.3 | 3.5 | −1.4 | 60.1 | 58.2 | 62.1 | 3.9 | 0.5 | 60.6 | 58.7 | 62.6 | 3.9 | −0.9 |
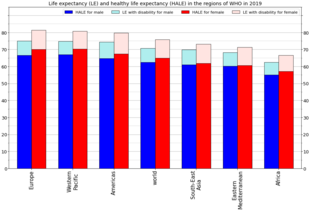
Estimation of the World Health Organization for 2019. [7]
| WHO regions [8] | Life expectancy at birth | HALE at birth | Life expectancy at age 60 | HALE at age 60 | ||||||||||||||||
|---|---|---|---|---|---|---|---|---|---|---|---|---|---|---|---|---|---|---|---|---|
| All | M | F | FΔM | Δ 2000 | All | M | F | FΔM | Δ 2000 | All | M | F | FΔM | Δ 2000 | All | M | F | FΔM | Δ 2000 | |
| Europe [9] | 78.2 | 75.1 | 81.3 | 6.2 | 5.7 | 68.3 | 66.6 | 70.0 | 3.4 | 4.6 | 22.5 | 20.5 | 24.3 | 3.8 | 2.9 | 17.1 | 15.8 | 18.3 | 2.5 | 2.1 |
| Western Pacific [10] | 77.7 | 74.8 | 80.8 | 6.0 | 5.3 | 68.6 | 67.0 | 70.2 | 3.2 | 4.3 | 21.8 | 19.8 | 23.9 | 4.1 | 2.5 | 16.5 | 15.4 | 17.7 | 2.3 | 1.8 |
| Americas [11] | 77.2 | 74.5 | 79.8 | 5.3 | 3.1 | 66.2 | 64.8 | 67.5 | 2.7 | 2.1 | 22.7 | 21.2 | 24.0 | 2.8 | 1.6 | 16.6 | 15.7 | 17.4 | 1.7 | 0.9 |
| World | 73.3 | 70.8 | 75.9 | 5.1 | 6.5 | 63.7 | 62.5 | 64.9 | 2.4 | 5.4 | 21.1 | 19.5 | 22.7 | 3.2 | 2.3 | 15.8 | 14.8 | 16.6 | 1.8 | 1.7 |
| South-East Asia [12] | 71.4 | 69.9 | 73.1 | 3.2 | 8.0 | 61.5 | 61.1 | 61.9 | 0.8 | 7.0 | 19.1 | 18.2 | 20.0 | 1.8 | 2.5 | 13.7 | 13.3 | 14.1 | 0.8 | 1.7 |
| Eastern Mediterranean [13] | 69.7 | 68.3 | 71.3 | 3.0 | 4.7 | 60.4 | 60.2 | 60.7 | 0.5 | 3.8 | 18.5 | 17.8 | 19.3 | 1.5 | 1.1 | 13.6 | 13.4 | 13.9 | 0.5 | 0.7 |
| Africa [14] | 64.5 | 62.4 | 66.6 | 4.2 | 11.8 | 56.0 | 55.0 | 57.1 | 2.1 | 10.2 | 17.9 | 16.7 | 19.0 | 2.3 | 2.4 | 13.3 | 12.6 | 13.9 | 1.3 | 1.8 |
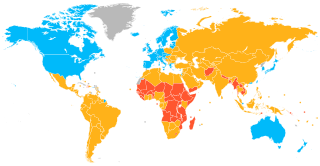
A developed country, or high-income country, is a sovereign state that has a high quality of life, developed economy, and advanced technological infrastructure relative to other less industrialized nations. Most commonly, the criteria for evaluating the degree of economic development are the gross domestic product (GDP), gross national product (GNP), the per capita income, level of industrialization, amount of widespread infrastructure and general standard of living. Which criteria are to be used and which countries can be classified as being developed are subjects of debate. Different definitions of developed countries are provided by the International Monetary Fund and the World Bank; moreover, HDI ranking is used to reflect the composite index of life expectancy, education, and income per capita. Another commonly used measure of a developed country is the threshold of GDP (PPP) per capita of at least US$22,000. In 2023, 40 countries fit all four criteria, while an additional 15 countries fit three out of four.