Human life expectancy is a statistical measure of the estimate of the average remaining years of life at a given age. The most commonly used measure is life expectancy at birth. This can be defined in two ways. Cohort LEB is the mean length of life of a birth cohort and can be computed only for cohorts born so long ago that all their members have died. Period LEB is the mean length of life of a hypothetical cohort assumed to be exposed, from birth through death, to the mortality rates observed at a given year. National LEB figures reported by national agencies and international organizations for human populations are estimates of period LEB.
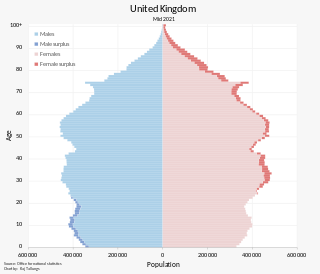
The population of the United Kingdom was estimated at over 67.0 million in 2020. It is the 21st most populated country in the world and has a population density of 270 people per square kilometre, with England having significantly greater density than Wales, Scotland, and Northern Ireland. Almost a third of the population lives in south east England, which is predominantly urban and suburban, with about 9 million in the capital city, London, whose population density is just over 5,200 per square kilometre.

The United States had an official estimated resident population of 334,914,895 on July 1, 2023, according to the U.S. Census Bureau. This figure includes the 50 states and the District of Columbia but excludes the population of five unincorporated U.S. territories as well as several minor island possessions. The United States is the third most populous country in the world. The Census Bureau showed a population increase of 0.4% for the twelve-month period ending in July 2022, below the world average annual rate of 0.9%. The total fertility rate in the United States estimated for 2022 is 1.665 children per woman, which is below the replacement fertility rate of approximately 2.1.

Seminole County is a county located in the U.S. state of Oklahoma. As of the 2020 census, the population was 23,556. Its county seat is Wewoka. Most of the county was a reservation for the Seminole Nation of Oklahoma which still retains jurisdiction over some land in the county. A small portion of land at the eastern end of the county belonged to the Muscogee (Creek) Nation.
Lee County is a county located in the U.S. state of Kentucky. As of the 2020 census, the population was 7,395. Its county seat is Beattyville. The county was formed in 1870 from parts of Breathitt, Estill, Owsley and Wolfe counties. The county was named for Robert E. Lee. The area of Kentucky where Lee County is located was a pro-union region of Kentucky but the legislature that created the county was controlled by former Confederates. The town of Proctor, named for the Rev. Joseph Proctor, was the first county seat. The first court was held on April 25, 1870, in the old Howerton House. The local economy at the time included coal mining, salt gathering, timber operations, and various commercial operations. It had a U.S. post office from 1843 until 1918.

Stilwell / ᏍᏗᎳᏪᎵ is a city located in the sovereign territory of the Cherokee Nation. It is also the county seat of Adair County, Oklahoma. The population was 3,700 as of the 2020 U.S. census, a decline of 6.7 percent from the 3,949 population recorded in 2010. The Oklahoma governor and legislature proclaimed Stilwell as the "Strawberry Capital of the World” in 1949, but the role of strawberries in the local economy has diminished significantly since then. Today, residents of Stilwell are among the poorest and most impoverished in the United States. Stilwell also serves as a gateway to Lake Tenkiller and Adair Park, formerly called Adair State Park before it was defunded.

The illegal drug trade, drug trafficking, or narcotrafficking is a global black market dedicated to the cultivation, manufacture, distribution and sale of prohibited drugs. Most jurisdictions prohibit trade, except under license, of many types of drugs through the use of drug prohibition laws. The think tank Global Financial Integrity's Transnational Crime and the Developing World report estimates the size of the global illicit drug market between US$426 and US$652 billion in 2014 alone. With a world GDP of US$78 trillion in the same year, the illegal drug trade may be estimated as nearly 1% of total global trade. Consumption of illegal drugs is widespread globally, and it remains very difficult for local authorities to reduce the rates of drug consumption.

In demography and medical geography, epidemiological transition is a theory which "describes changing population patterns in terms of fertility, life expectancy, mortality, and leading causes of death." For example, a phase of development marked by a sudden increase in population growth rates brought by improved food security and innovations in public health and medicine, can be followed by a re-leveling of population growth due to subsequent declines in fertility rates. Such a transition can account for the replacement of infectious diseases by chronic diseases over time due to increased life span as a result of improved health care and disease prevention. This theory was originally posited by Abdel Omran in 1971.

Foreign nationals (aliens) can violate US immigration laws by entering the United States unlawfully or lawfully entering but then remaining after the expiration of their visas, parole, or temporary protected status. Illegal immigration has been a matter of intense debate in the United States since the 1980s.
Crime has been recorded in the United States since its founding and has fluctuated significantly over time, with a sharp rise after 1900 and reaching a broad bulging peak between the 1970s and early 1990s. After 1992, crime rates have generally trended downwards each year, with the exceptions of a slight increase in property crimes in 2001 and increases in violent crimes in 2005-2006, 2014-2016 and 2020-2021. While official federal crime data beginning in 2021 has a wide margin of error due to the incomplete adoption of the National Incident-Based Reporting System by government agencies, federal data for 2020-2021 and limited data from select U.S. cities collected by the nonpartisan Council on Criminal Justice showed significantly elevated rates of homicide and motor vehicle theft in 2020-2022. Although overall crime rates have fallen far below the peak of crime seen in the United States during the late 1980s and early 1990s, the homicide rate in the U.S. has remained high, relative to other "high income"/developed nations, with eight major U.S. cities ranked among the 50 cities with the highest homicide rate in the world in 2022. The aggregate cost of crime in the United States is significant, with an estimated value of $4.9 trillion reported in 2021. Data from the first half of 2023, from government and private sector sources show that the murder rate has dropped, as much as 12% in as many as 90 cities across the United States. The drop in homicide rates is not uniform across the country however, with some cities such as Memphis, TN, showing an uptick in murder rates.

The ageing of Europe, also known as the greying of Europe, is a demographic phenomenon in Europe characterised by a decrease in fertility, a decrease in mortality rate, and a higher life expectancy among European populations. Low birth rates and higher life expectancy contribute to the transformation of Europe's population pyramid shape. The most significant change is the transition towards a much older population structure, resulting in a decrease in the proportion of the working age while the number of the retired population increases. The total number of the older population is projected to increase greatly within the coming decades, with rising proportions of the post-war baby-boom generations reaching retirement. This will cause a high burden on the working age population as they provide for the increasing number of the older population.

Japan has the highest proportion of elderly citizens of any country in the world. 2014 estimates showed that about 38% of the Japanese population was above the age of 60, and 25.9% was above the age of 65, a figure that increased to 29.1% by 2022. By 2050, an estimated one-third of the population in Japan is expected to be 65 and older.

Crime and violence affect the lives of millions of people in Latin America. Some consider social inequality to be a major contributing factor to levels of violence in Latin America, where the state fails to prevent crime and organized crime takes over State control in areas where the State is unable to assist the society such as in impoverished communities. In the years following the transitions from authoritarianism to democracy, crime and violence have become major problems in Latin America. The region experienced more than 2.5 million murders between 2000 and 2017. Several studies indicated the existence of an epidemic in the region; the Pan American Health Organization called violence in Latin America "the social pandemic of the 20th century." Apart from the direct human cost, the rise in crime and violence has imposed significant social costs and has made much more difficult the processes of economic and social development, democratic consolidation and regional integration in the Americas.
Crime in Atlanta, Georgia is above the national median and has been a major problem for the city since the middle 20th century.
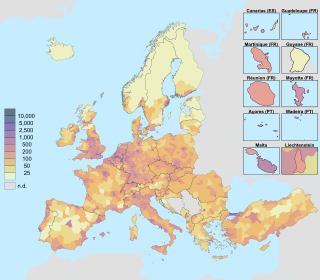
The demographics of the European Union show a highly populated, culturally diverse union of 27 member states. As of 1 January 2023, the population of the EU is around 448 million people.
Health in Russia deteriorated rapidly following the dissolution of the Soviet Union, and particularly for men, as a result of social and economic changes.
In 2012, there were 451,142 crimes reported in the U.S. state of New York, including 686 murders. In 2014, 409,386 crimes were reported in the state, including 616 murders. This number further decreased in 2019, in which 335,736 crimes were reported, with 558 cases of murder. Throughout 2010-2019, violent crime dropped by 8.0%, and property crime dropped by -29.0%.