List of European Union member states by health expense per person

Last updated

This is a list of European Union member states by health expense per person.

Contents

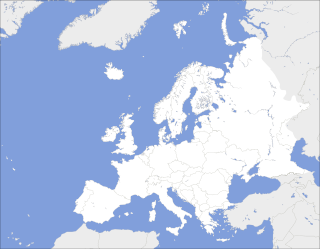
Map

The table uses 2013 data from the World Bank. [1] Numbers are in international dollar.

Table

The table uses an interval of years from the World Bank. [2] Numbers are in international dollars.

EU member state20102011201220132014
Flag of Austria.svg Austria4,5314,6774,8634,8895,039
Flag of Belgium (civil).svg Belgium3,9064,1664,2374,2624,391
Flag of Bulgaria.svg Bulgaria1,0881,0701,1311,2701,398
Flag of Croatia.svg Croatia1,6061,6011,6431,6661,652
Flag of Cyprus.svg Cyprus2,2702,3132,2152,1122,062
Flag of the Czech Republic.svg Czech Republic1,9292,0412,0572,0642,146
Flag of Denmark.svg Denmark4 5454 5544 6154 552
Flag of Estonia.svg Estonia1 3001 3561 4161 453
Flag of Finland.svg Finland3 2973 4633 4973 604
Flag of France.svg France4 0394 2024 2134 334
Flag of Germany.svg Germany4 4264 6124 6354 812
Flag of Greece.svg Greece2 6852 6482 3552 513
Flag of Hungary.svg Hungary1 7011 7981 7661 839
Flag of Ireland.svg Ireland3 7963 7483 8173 867
Flag of Italy.svg Italy3,2753,3303,3043,2573,238
Flag of Latvia.svg Latvia804830869894940
Flag of Lithuania.svg Lithuania1,3871,5321,5841,6681,718
Flag of Luxembourg.svg Luxembourg6,5196,7016,5146,5666,812
Flag of Malta.svg Malta2,3272,7622,5302,652
Flag of the Netherlands.svg Netherlands4,6984,8945,1155,1695,201
Flag of Poland.svg Poland1,4371,5091,5441,5291,570
Flag of Portugal.svg Portugal2,8102,7082,6242,6342,689
Flag of Romania.svg Romania9649711,0051,0701,079
Flag of Slovakia.svg Slovakia2,0391,9632,0642,0802,179
Flag of Slovenia.svg Slovenia2,4522,5392,6172,6192,697
Flag of Spain.svg Spain2,9963,0182,9972,9282,965
Flag of Sweden.svg Sweden3,7614,8865,0075,1775,218

See also

Plotted maps

Related Research Articles

Per capita income Average income of an economy

Per capita income (PCI) or total income measures the average income earned per person in a given area in a specified year. It is calculated by dividing the area's total income by its total population.

The following table lists the independent European states and their memberships in selected organisations and treaties.
European countries by percentage of urban population

The map data is for year 2014 from the World Bank. Numbers are in percentage.

European countries by electricity consumption per person

The map data is for year 2012 from the World Bank. Numbers are in kWh per year.

This is a list of total public and private health expenditure for European countries, divided by the population of the country to give expenditure per capita. It includes health services, family planning, nutrition activities, and emergency health aid.

References

  1. "Health expenditure per capita, PPP (constant 2011 international $)". The World Bank. Retrieved 11 August 2015.
  2. "Health expenditure per capita, PPP (constant 2011 international $)". The World Bank. Retrieved 9 August 2016.