Budget of the European Union

Last updated

The EU's budget in 2022 was around EUR170bn. Of this, EUR54bn subsidised agriculture enterprise, EUR42bn was spent on transport, building and the environment, EUR16bn on education and research, EUR13bn on welfare, EUR20bn on foreign and defence policy, EUR2bn in finance, EUR2bn in energy, EUR1.5bn in communications, and EUR13bn in administration. EU budget 2022, long format.png
The EU's budget in 2022 was around €170bn. Of this, €54bn subsidised agriculture enterprise, €42bn was spent on transport, building and the environment, €16bn on education and research, €13bn on welfare, €20bn on foreign and defence policy, €2bn in finance, €2bn in energy, €1.5bn in communications, and €13bn in administration.
 () Budget of the European Union
Submitted by European Commission
Submitted to European Parliament and Council of the European Union
Total revenue€170.6 billion (2022)
Total expenditures€170.6 billion (2022)
Program Spending€170.6 billion (2022)
Website Budget online

The budget of the European Union is used to finance EU funding programmes (such as the European Regional Development Fund, the Cohesion Fund, Horizon Europe, or Erasmus+) and other expenditure at the European level.

Contents

The EU budget is primarily an investment budget. Representing around 2% of all EU public spending, it aims to complement national budgets. Its purpose is to implement the priorities that all EU members have agreed upon. It provides European added-value by supporting actions which, in line with the principle of subsidiarity and proportionality, can be more effective than actions taken at national, regional or local level.

The EU had a long-term budget of €1,082.5 billion for the period 2014–2020, representing 1.02% of the EU-28's Gross National Income (GNI) [1] and of €1,074.3 billion for the 2021–2027 period. [2] The long-term budget, also called the Multiannual Financial Framework, is a seven-year spending plan, allowing the EU to plan and invest in long-term projects.

Initially, the EU budget used to fund mainly agriculture. In the 1980s and 1990s, Member States and the European Parliament broadened the scope of EU competences through changes in the Union's founding Treaties. Recognising the need to support the new single market, they increased the resources available under the Structural Funds to support economic, social and territorial cohesion. In parallel, the EU enhanced its role in areas such as transport, space, health, education and culture, consumer protection, environment, research, justice cooperation and foreign policy.

Since 2000, the EU budget has been adjusted to the arrival of 13 new Member States with diverse socioeconomic situations and by successive EU strategies to support jobs and growth and enhanced actions for the younger generation through the Youth Employment Initiative and Erasmus+. In 2015, it has set up the European Fund for Strategic Investments (EFSI), "so called Juncker plan” allowing to reinforce investments in the EU.

The largest share of the EU budget (around 70% for the period 2014–2020) goes to agriculture and regional development. During the period 2014–2020, the share of EU spending on farming is set at 39%. In 1985, 70% was spent on farming. Farming's relatively large share of the EU budget is due to the fact that it is the only policy funded almost entirely from the common budget. This means that EU spending replaces national expenditure to a large extent.

The second share of EU spending goes to regional development (34% for the period 2014–2020). EU funding for regional and social development is an important source for key investment projects. In some EU countries that have otherwise limited means, European funding finances up to 80% of public investment. [3] However, EU regional spending does not just help poorer regions. It invests in every EU country, supporting the economy of the EU as a whole.

6% of the EU budget goes for the administration of all the European Institutions, including staff salaries, pensions, buildings, information technology, training programmes, translation, and the running of the European School system for the provision of education for the children of EU staff.

EU budget lifecycle

The EU budget is adopted through the budgetary procedure by the European Parliament and the Council of the European Union. The EU budget must remain within the limits set out in the Multiannual Financial Framework (MFF) and the Own Resource Celling. [4] The MFF is the EU's long-term budget. It is established at least for five years [4] (usually seven years).

Adoption

The European Commission submits the draft budget no later than 1 September each year. The Council of the European Union adopts its position no later than 1 October. If the European Parliament may accept the Council's position or fails to take a decision within 42 days, then the budget is adopted. If the Parliament adopts its position then the Conciliation Committee is convened. The Conciliation Committee has 21 days to adopt a joint text if the committee fails to adopt a joint text or the joint text is not adopted within 14 days by the Council and the Parliament the budgetary procedure needs to start again. [5]

Implementation

The European Commission, in cooperation with Member States, is responsible for the implementation of the EU budget in accordance with the Financial Regulation. [6] The EU budget is implemented in accordance with the principles of unity and of budgetary accuracy, annuality, equilibrium, unit of account, universality, specification, sound financial management and performance and transparency. [7] The EU programmes are managed in three ways:

Audit and discharge

The Commission reports on how it has implemented the budget in various ways, most importantly by publishing the Integrated Financial Reporting Package, which consists of the annual accounts, the Annual Management and Performance Report, and other accountability reports. [9]

The annual discharge procedure allows the European Parliament and the Council to hold the Commission politically accountable for the implementation of the EU budget. The European Parliament decides, after a recommendation by the Council, on whether or not to provide its final approval, known as 'granting discharge', to the way the Commission implemented the EU budget in a given year. When granted, it leads to the formal closure of the accounts of the institution for a given year.

When deciding whether to grant, postpone or refuse the discharge, the Parliament takes into consideration the Integrated Financial Reporting Package prepared by the Commission along with the European Court of Auditors' Annual Report on how the budget has been spent and any relevant Special Reports from the Court. More particularly, every year the European Court of Auditors, [10] which is the EU's independent external auditor, examines the reliability of accounts, whether all revenue has been received and all expenditure incurred in a lawful and regular manner, and whether the financial management has been sound.  

The European Court of Auditors has signed off the EU accounts every year since 2007. In October 2018, the European Court of Auditors gave the EU annual accounts a clean bill of health [11] for the 11th year in a row, finding them true and fair. The Court has given, for a second year in a row, a qualified opinion on the 2017 payments. The report thus shows further improvements in terms of compliance and performance, and confirms that the commission is on the right path. While a clean opinion means that the figures are true and fair, a qualified opinion means that there are minor issues still to be fixed. If Member States or final beneficiaries are found to spend EU money incorrectly, the Commission takes corrective measures. In 2017, the Commission recovered €2.8 billion, equal to 2.1% of the payments to the EU budget. Therefore, the actual amount at risk is below the 2% threshold, once corrections and recoveries have been taken into account.2% of any public budget is very high however hence the qualification.

Revenue

Sources of income

Pie chart showing EU revenue sources (2017) [12]

  VAT-based resources (12.2%)
  GNI-based resources (56.1%)
  Traditional own resources (14.7%)
  Other (12.4%)
  Surplus from 2016 (4.6%)

The EU obtains its revenue from four main sources:

  1. Traditional own resources, comprising customs duties on imports from outside the EU and sugar levies;
  2. VAT-based resources, comprising a percentage (0.3% except Germany, Netherlands and Sweden that apply 0.15%) of Member State's standardised value added tax (VAT) base;
  3. GNI-based resources, comprising a percentage (around 0.7%) of each member state's gross national income (GNI);
  4. Other revenue, including taxes from EU staff salaries, bank interest, fines and contributions from third countries;
  5. Own resources as levies collected by the EU.

Traditional own resources

[12]

Traditional own resources are taxes raised on behalf of the EU as a whole, principally import duties on goods brought into the EU. These are collected by the Member States and passed on to the EU. Member States are allowed to keep a proportion of the duty to cover administration (20%), 25% as per 2021. The European Commission operates a system of inspections to control the collection of these duties in Member States and thus ensure compliance with the EU rules.

In 2017, the EU's revenue from customs duties was €20,325 million (14.6% of its total revenue). A production charge paid by sugar producers brought in revenue of €134 million. The total revenue from TORs (customs duties and sugar levies) was €20,459 million (14.7% of the EU's total revenue).

Countries are liable to make good any loss of revenue due to their own administrative failure.

VAT-based own resources

[13]

The VAT-based own resource is a source of EU revenue based on the proportion of VAT levied in each member country. VAT rates and exemptions vary in different countries, so a formula is used to create the so-called "harmonised VAT base", upon which the EU charge is levied. The starting point for calculations is the total VAT raised in a country. This is then adjusted using a weighted average rate of VAT rates applying in that country, producing the intermediate tax base. Further adjustments are made where there is a derogation from the VAT directive allowing certain goods to be exempt. The tax base is capped, such that it may not be greater than 50% of a Member State's gross national income (GNI). In 2017, eight Member States saw their VAT contribution reduced thanks to this 50% cap (Estonia, Croatia, Cyprus, Luxembourg, Malta, Poland, Portugal and Slovenia).

Member countries generally pay 0.3% of their harmonised VAT base into the budget, but there are some exceptions. The rate for Germany, the Netherlands and Sweden is 0.15% for the 2014-2020 period, while Austria also had a reduced rate in the 2007-2013 period.

The EU's total revenue from the VAT own resource was 16,947 million euros (12.2% of total revenue) in 2017.

Member States are required to send a statement of VAT revenues to the EU before July after the end of the budget year. The EU examines the submission for accuracy, including inspection visits by officials from the Directorate-General for Budget and Eurostat, who report back to the country concerned.

The country has a legal obligation to respond to any issues raised in the report, and discussions continue until both sides are satisfied, or the matter may be referred to the European Court of Justice for a final ruling. The Advisory Committee on Own Resources (ACOR), which has representatives from each Member State, gives its opinion where Member States have asked for authorisations to leave certain calculations out of account or to use approximate estimates. The ACOR also receives and discusses the inspection results. In 2018, 15 inspections were reported by inspectors to the ACOR. It is anticipated that 12 countries will be visited in 2019.

GNI-based own resources

[12]

National contributions from the Member States are the largest source of the EU budget and are calculated based on gross national income. The Gross National Income (GNI)-based resource is an 'additional' resource that provides the revenue required to cover expenditure in excess of the amount financed by traditional own resources, VAT-based contributions and other revenue in any year.

The GNI-based resource ensures that the general budget of the Union is always initially balanced.

The GNI call rate is determined by the additional revenue needed to finance the budgeted expenditure not covered by the other resources (VAT-based payments, traditional own resources and other revenue). Thus a uniform call rate is applied to the GNI of each of the Member States.

Due to this covering mechanism the rate to be applied to the Member States' gross national income varies from one financial year to another.

Nowadays this resource represents the largest source of revenue of the EU Budget (generally around 70% of the total financing). In 2017, due to the higher than usual other revenues and surplus from the previous year the rate of call of GNI was 0.5162548% and the total amount of the GNI resource levied was €78,620 million (representing 56.6% of total revenue). In 2017, Denmark, the Netherlands and Sweden benefited from an annual gross reduction in their GNI-based contribution (of respectively €130 million, €695 million and €185 million – all amounts are expressed in 2011 prices).

The total amount of own resources that may be collected for the EU Budget from Member States in any given year is limited with reference to Member States' GNI. Currently, the total amount of own resources allocated to the Union to cover annual appropriations for payments cannot exceed 1.20% of the sum of all the Member States' GNI.

The GNI for own resource purposes [14] is calculated by National Statistical Institutes according to European law governing the sources and methods to compile GNI and the transmission of GNI data and related methodological information to the commission (Eurostat). Basic information must be provided by the countries concerned to Eurostat before 22 September in the year following the budget year concerned.

Eurostat carries out information visits to the National Statistical Institutes forming part of the European Statistical System. Based on assessment reports by Eurostat, the Directorate-General for Budget of the Commission may notify to the Permanent Representative of the Member State concerned required corrections and improvements in the form of reservations on the Member State's GNI data. Payments are made monthly by Member States to the commission. Own resources payments are made monthly. Custom duties are made available by Member States after their collection. Payments of VAT- and GNI-based resources are based upon the budget estimates made for that year, subject to later correction.

Other revenue

[12]

Other revenue accounted for 12.4% of EU revenue in 2017. This includes tax and other deductions from EU staff remunerations, contributions from non-EU countries to certain programmes (e.g. relating to research), interest on late payments and fines, and other diverse items.

As the balance from the previous year's budget is usually positive in comparison to the budget estimates, there is usually a surplus at the end of the year. This positive difference is returned to the Member States in the form of reduced contributions the following year.

Own resources

As per the 2021-2027 period a system of own resources will be introduced relying on levies collected by the EU. [15]

Correction mechanisms

The EU budget has had a number of correction mechanisms designed to re-balance contributions by certain member states: [16]

  1. The UK rebate, which reimbursed the UK by 66%[ citation needed ] of the difference between its contributions to the budget and the expenditures received by the UK. This rebate was not paid to the UK, but was rather deducted from the amount the UK was due to pay. The effect of this rebate was to increase contributions required from all other member states, to make up the loss from the overall budget. Austria, Germany, the Netherlands and Sweden all had their contributions to make up for the UK rebate capped to 25% of their base contributions. As of the UK's departure from the EU, the rebate is no longer in effect.
  2. Lump-sum payments to reduce annual GNI contributions for Austria, Denmark, the Netherlands and Sweden in the 2014-2020 budget (€60 million, €130 million, €695 million and €185 million respectively). (Austria's reduction expired in 2016.)
  3. A reduced VAT call rate of 0.15% (versus the regular rate of 0.30%) for Germany, the Netherlands and Sweden in the 2014-2020 budget.

The United Kingdom withdrawal from the European Union has led the EU to reconsider its funding mechanisms, with the rebates likely to change. [17] European Commissioner for Budget and Human Resources Günther Oettinger has stated that "I want to propose a budget framework that does not only do without the mother of all rebates [the U.K.'s] but without all of its children as well". [18] The Multiannual Financial Framework for the 2021-2027 period will shift €53.2 billion as national rebates to Germany and the frugal Four funded by the Member States according to their GNI. [19]

Expenditure

2014 EU expenditure in millions of euros (total: 142,496 million)

  Growth (including infrastructure projects) (47.01%)
  Natural resources (including CAP) (38.80%)
  Security and citizenship (1.64%)
  EU as a global partner (6.12%)
  Administration (6.43%)
  Compensations (0.003%)

Proportional outgoings

Approximately 94% of the EU budget funds programmes and projects both within member states and outside the EU. [20] Less than 7% of the budget is used for administrative costs, and less than 3% is spent on EU civil servants' salaries. [21]

2014–2020 period

For the period 2014–2020, the EU budget had expenditures amounting to a total of €1,050,851 million: €900,638.1 million for the EU-28 member states, €62,021.8 million for non-EU expenditures, €56,022.9 million earmarked, and €32,168 million for other expenditures. [22]

The expenditures were divided into six categories or "headings": [23]

  1. Smart and inclusive growth - aimed at enhancing competitiveness for growth and jobs and economic, social and territorial cohesion.
  2. Sustainable growth: natural resources - included the common agricultural policy (CAP), common fisheries policy, rural development and environmental measures.
  3. Security and citizenship - included justice and home affairs, border protection, immigration and asylum policy, public health, consumer protection, culture, youth, information and dialogue with citizens.
  4. Global Europe - covered all external action ("foreign policy") by the EU, such as development assistance or humanitarian aid, with the exception of the European Development Fund (EDF).
  5. Administration - covered the administrative expenditure of all the European institutions and European Schools, as well as pensions.
  6. Compensations - temporary payments designed to ensure that Croatia, which joined the EU in July 2013, did not contribute more to the EU budget than it benefited from it in the first year following its accession.

Besides those six categories, there were also expenditures allocated to "special instruments" (Emergency Aid Reserve, European Union Solidarity Fund, etc.). [22] [24]

2021–2027 period

MFF and NGEU expenditures MFF2021-2027andNGEU2021-2024.png
MFF and NGEU expenditures

The EU budget for the 2021–2027 period has expenditures of €1,074.3 billion. [2] It goes together with the Next Generation EU recovery package of €750 billion in grants and loans over the period 2021–2024 to meet the unparalleled economic challenge of the COVID-19 pandemic. [25] An important part (95.5 billion euros) of the budget goes to the framework programme for research and development Horizon Europe. Around 25 billion euros are dedicated to Excellent Science (Pillar I), 53,5 billion euros to Global Challenges and European Industrial Competitiveness (Pillar II), and 13,5 billion euros to Innovative Europe (Pillar III). The transversal part about Widening the Participation and Strengthening the European Research Area receives around 3,3 billion euros. [26]

Funding by member states

Net receipts or contributions vary over time, and there are various ways of calculating net contributions to the EU budget, depending, for instance, on whether countries' administrative expenditure is included. Also, one can use either absolute figures, the proportion of gross national income (GNI), or per capita amounts. Different countries may tend to favour different methods, to present their country in a more favourable light.[ citation needed ]

EU-27 contributions (2007–13)

Note: in this budget period, "EU 27" meant the 27 member states prior to the accession of Croatia.

Financing of the general budget by member state (2007–2013)
Member stateTotal national contributions [27]
(€ millions)
Share of total EU contributions [27]
(%)
Average net contributions [28]
(€ millions)
Average net contributions [28]
(% of GNI)
Flag of Austria.svg  Austria 16,9212.507330.24
Flag of Belgium (civil).svg  Belgium 22,9493.161,3030.35
Flag of Bulgaria.svg  Bulgaria 2,2940.32-873-2.33
Flag of Cyprus.svg  Cyprus 1,0770.1500
Flag of the Czech Republic.svg  Czech Republic 8,9951.24-1,931-1.32
Flag of Denmark.svg  Denmark 15,2462.108530.34
Flag of Estonia.svg  Estonia 1,0010.14-515-3.3
Flag of Finland.svg  Finland 11,9951.654640.24
Flag of France.svg  France 128,83917.765,9140.29
Flag of Germany.svg  Germany 144,35019.909,5070.35
Flag of Greece.svg  Greece 14,4541.99-4,706-2.23
Flag of Hungary.svg  Hungary 5,8600.81-2,977-3.14
Flag of Ireland.svg  Ireland 9,2051.27-474-0.32
Flag of Italy.svg  Italy 98,47513.574,3560.27
Flag of Latvia.svg  Latvia 1,3230.18-651-3.07
Flag of Lithuania.svg  Lithuania 1,9070.26-1,269-4.22
Flag of Luxembourg.svg  Luxembourg 1,9000.26750.28
Flag of Malta.svg  Malta 0,3920.05-0,49-0.75
Flag of the Netherlands.svg  Netherlands 27,3973.782,0730.33
Flag of Poland.svg  Poland 22,2493.07-8,508-2.42
Flag of Portugal.svg  Portugal 10,8121.49-3,196-1.89
Flag of Romania.svg  Romania 8,0191.11-1,820-1.38
Flag of Slovakia.svg  Slovakia 4,0160.55-1,040-1.56
Flag of Slovenia.svg  Slovenia 2,3030.32-337-0.94
Flag of Spain.svg  Spain 66,3439.15-3,114-0.29
Flag of Sweden.svg  Sweden 19,4642.681,3180.32
Flag of the United Kingdom.svg  United Kingdom 77,65510.704,8720.25

EU-28 contributions (2014–2020)

In the 2014–2020 period, the EU budget had revenues amounting to total of €1,069,945.7 million: €825,759.1 million from national contributions (VAT-based own resources and GNI-based own resources), €139,351.6 million from traditional own resources (TOR) and €104,835 million from other revenues. [22]

Financing of the general budget and EU expenditure by member state (2014–2020) [22]
Member
state
Total national contributions
(€ millions)
Total national contributions + TOR
(€ millions)
Total EU expenditure in member state
(€ millions)
Flag of Austria.svg  Austria 20,543.222,017.413,132.2
Flag of Belgium (civil).svg  Belgium 26,482.640,473.855,011.8
Flag of Bulgaria.svg  Bulgaria 3,155.43,702.615,828.5
Flag of Croatia.svg  Croatia 2,904.93,198.68,655.6
Flag of Cyprus.svg  Cyprus 1,235.31,390.41,631.0
Flag of the Czech Republic.svg  Czech Republic 10,818.212,590.034,969.9
Flag of Denmark.svg  Denmark 16,112.418,469.610,375.6
Flag of Estonia.svg  Estonia 1,422.11,639.25,444.3
Flag of Finland.svg  Finland 13,400.014,368.510,005.6
Flag of France.svg  France 140,441.9151,999.898,698.3
Flag of Germany.svg  Germany 169,665.5197,490.880,304.1
Flag of Greece.svg  Greece 10,492.611,710.441,826.8
Flag of Hungary.svg  Hungary 7,075.58,185.139,488.8
Flag of Ireland.svg  Ireland 13,270.015,202.413,815.9
Flag of Italy.svg  Italy 101,994.8114,276.578,021.6
Flag of Latvia.svg  Latvia 1,621.31,871.57,424.5
Flag of Lithuania.svg  Lithuania 2,405.23,000.712,029.4
Flag of Luxembourg.svg  Luxembourg 2,313.62,446.913,491.9
Flag of Malta.svg  Malta 648.3737.51,418.7
Flag of the Netherlands.svg  Netherlands 33,836.251,510.816,836.4
Flag of Poland.svg  Poland 27,021.031,640.3104,159.7
Flag of Portugal.svg  Portugal 11,618.712,681.829,587.4
Flag of Romania.svg  Romania 10,703.211,832.941,559.7
Flag of Slovakia.svg  Slovakia 4,892.35,537.417,066.7
Flag of Slovenia.svg  Slovenia 2,562.43,050.16,016.8
Flag of Spain.svg  Spain 68,261.078,367.082,841.4
Flag of Sweden.svg  Sweden 23,030.626,598.412,082.1
Flag of the United Kingdom.svg  United Kingdom 97,830.9119,120.348,913.5
Total825,759.1965,110.7900,638.1

EU-27 contributions (2023)

The 2023 draft EU budget has a total in own resources of 154,186 M€, decomposed into: total in national contributions own resources: 132,596 M€ and total in net traditional own resources: 21,590 M€.

Financing of the general budget by member state (2023). [29]
Member
state
Share in national contributions (%)
(VAT and GNI-based own resources)
Flag of Belgium (civil).svg  Belgium 3.61
Flag of Bulgaria.svg  Bulgaria 0.54
Flag of the Czech Republic.svg  Czech Republic 1.77
Flag of Denmark.svg  Denmark 2.09
Flag of Germany.svg  Germany 23.60
Flag of Estonia.svg  Estonia 0.24
Flag of Ireland.svg  Ireland 2.36
Flag of Greece.svg  Greece 1.33
Flag of Spain.svg  Spain 9.11
Flag of France.svg  France 18.55
Flag of Croatia.svg  Croatia 0.42
Flag of Italy.svg  Italy 12.77
Flag of Cyprus.svg  Cyprus 0.16
Flag of Latvia.svg  Latvia 0.25
Flag of Lithuania.svg  Lithuania 0.39
Flag of Luxembourg.svg  Luxembourg 0.40
Flag of Hungary.svg  Hungary 1.20
Flag of Malta.svg  Malta 0.10
Flag of the Netherlands.svg  Netherlands 4.61
Flag of Austria.svg  Austria 2.51
Flag of Poland.svg  Poland 4.70
Flag of Portugal.svg  Portugal 1.65
Flag of Romania.svg  Romania 1.87
Flag of Slovenia.svg  Slovenia 0.39
Flag of Slovakia.svg  Slovakia 0.74
Flag of Finland.svg  Finland 1.75
Flag of Sweden.svg  Sweden 2.88

See also

Related Research Articles

<span class="mw-page-title-main">Common Agricultural Policy</span> Agricultural policy of the European Union

The Common Agricultural Policy (CAP) is the agricultural policy of the European Commission. It implements a system of agricultural subsidies and other programmes. It was introduced in 1962 and has since then undergone several changes to reduce the EEC budget cost and consider rural development in its aims. It has however, been criticised on the grounds of its cost, its environmental, and humanitarian effects.

<span class="mw-page-title-main">Politics of the European Union</span> Political system of the European Union

The political structure of the European Union (EU) is similar to a confederation, where many policy areas are federalised into common institutions capable of making law; the competences to control foreign policy, defence policy, or the majority of direct taxation policies are mostly reserved for the twenty-seven state governments. These areas are primarily under the control of the EU's member states although a certain amount of structured co-operation and coordination takes place in these areas. For the EU to take substantial actions in these areas, all Member States must give their consent. Union laws that override State laws are more numerous than in historical confederations; however, the EU is legally restricted from making law outside its remit or where it is no more appropriate to do so at a state or local level (subsidiarity) when acting outside its exclusive competences. The principle of subsidiarity does not apply to areas of exclusive competence.

<span class="mw-page-title-main">European Defence Agency</span> Agency of the European Union

The European Defence Agency (EDA) is an agency of the European Union (EU) that promotes and facilitates integration between member states within the EU's Common Security and Defence Policy (CSDP). The EDA is headed by the EU High Representative for Foreign Affairs and Security Policy, European Commission’s Vice President (HR/VP), and reports to the Council. The EDA was established on 12 July 2004 and is based in Brussels, Belgium, along with a number of other CSDP bodies.

<span class="mw-page-title-main">Economy of the European Union</span>

The economy of the European Union is the joint economy of the member states of the European Union (EU). It is the second largest economy in the world in nominal terms, after the United States and the third one in purchasing power parity (PPP) terms, after China and the United States. The European Union's GDP estimated to be around $19.35 trillion (nominal) in 2024 representing around one sixth of the global economy. Germany has the biggest national GDP of all EU countries, followed by France and Italy.

Statistics in the European Union are collected by Eurostat.

The UK rebate was a financial mechanism that reduced the United Kingdom's contribution to the EU budget in effect since 1985. It was a complex calculation which equated to a reduction of approximately 66% of the UK's net contribution – the amount paid by the UK into the EU budget less receipts from the EU budget. Based on a net contribution of €11.7 (£9.6) billion in 2016, the UK Treasury estimated the 2017 rebate amounted to €6.6 (£5.6) billion reducing the ultimate UK contribution for the 2017 budget to €10.4 (£8.9) billion. Although the rebate was not set in the EU treaties, it was negotiated as part of the Multiannual Financial Framework (MFF) every seven years and had to be unanimously agreed.

<span class="mw-page-title-main">European Structural and Investment Funds</span> European Union financial tools

The European Structural and Investment Funds are financial tools governed by a common rulebook, set up to implement the regional policy of the European Union, as well as the structural policy pillars of the Common Agricultural Policy and the Common Fisheries Policy. They aim to reduce regional disparities in income, wealth and opportunities. Europe's poorer regions receive most of the support, but all European regions are eligible for funding under the policy's various funds and programmes. The current framework is set for a period of seven years, from 2021 to 2027.

In France, taxation is determined by the yearly budget vote by the French Parliament, which determines which kinds of taxes can be levied and which rates can be applied.

<span class="mw-page-title-main">Multiannual Financial Framework</span> European Union framework regulating the annual budget

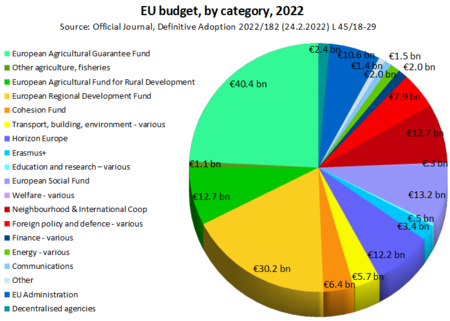
The Multiannual Financial Framework (MFF) of the European Union, also called the financial perspective, is a seven-year framework regulating its annual budget. It is laid down in a unanimously adopted Council Regulation with the consent of the European Parliament. The financial framework sets the maximum amount of spendings in the EU budget each year for broad policy areas ("headings") and fixes an overall annual ceiling on payment and commitment appropriations.

<span class="mw-page-title-main">Directorate-General for International Partnerships</span> European Commission department

The Directorate-General for International Partnerships is the European Commission department responsible for international development policy. It operates under the authority of the European Commissioner for International Partnerships, Jutta Urpilainen.

<span class="mw-page-title-main">European Development Fund</span> Fund for European Union aid to other areas

The European Development Fund (EDF) is the main instrument for European Union (EU) aid for development cooperation in Africa, the Caribbean, and Pacific countries and the Overseas Countries and Territories (OCT). Funding is provided by voluntary donations by EU member states. Until 2020 the EDF was subject to its own financial rules and procedures, and was managed by the European Commission (EC) and the European Investment Bank. The EDF has been incorporated into the EU's general budget as of the 2021–2027 multi-annual financial framework.

Taxation in Greece is based on the direct and indirect systems. The total tax revenue in 2017 was €47.56 billion from which €20.62 billion came from direct taxes and €26.94 billion from indirect taxes. The total tax revenue represented 39.4% of GDP in 2017. Taxes in Greece are collected by the Independent Authority for Public Revenue.

On 26 November 2008, the European Commission proposed a European stimulus plan amounting to 200 billion euros to cope with the effects of the global financial crisis on the economies of the members countries. It aims at limiting the economic slowdown of the economies through national economic policies, with measures extended over a period of two years.

Gross national income at market prices in the European Union of 27 Member States (GNI) amounted to EUR 44.778 per inhabitant in 2020.

<span class="mw-page-title-main">LIFE programme</span>

The LIFE programme is the European Union's funding instrument for the environment and climate action. The general objective of LIFE is to contribute to the implementation, updating and development of EU environmental and climate policy and legislation by co-financing projects with European added value. LIFE began in 1992 and to date there have been five phases of the programme. During this period, LIFE has co-financed some 4600 projects across the EU, with a total contribution of approximately 6.5 billion Euros to the protection of the environment and of climate. For the next phase of the programme (2021–2027) the European Commission proposed to raise the budget to 5.45 billion Euro.

<span class="mw-page-title-main">Taxation in South Africa</span>

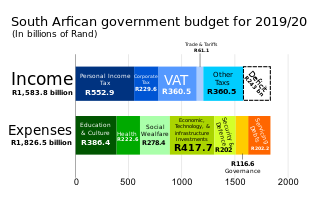
Taxation may involve payments to a minimum of two different levels of government: central government through SARS or to local government. Prior to 2001 the South African tax system was "source-based", where in income is taxed in the country where it originates. Since January 2001, the tax system was changed to "residence-based" wherein taxpayers residing in South Africa are taxed on their income irrespective of its source. Non residents are only subject to domestic taxes.

<span class="mw-page-title-main">Digital Single Market</span>

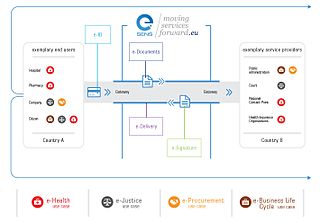
On 6 May 2015, the European Commission, led at the time by Jean-Claude Juncker, established the Digital Single Market strategy, intended to remove virtual borders, boost digital connectivity, and make it easier for consumers to access cross-border online content across the European Union. The Digital Single Market, which is one of the Commission's 10 political priorities, aims to fit the EU's single market for the digital age, moving from 28 national digital markets to a single one, and then opening up digital services to all citizens and strengthen business competitiveness in the digital economy. In other words, the Digital Single Market is a market characterized by ensuring the free movement of people, services and capital and allowing individuals and businesses to seamlessly access and engage in online activities irrespective of their nationality or place of residence. Fair competition conditions and a high level of protection of personal and consumer data are applied.

The term Brexit Divorce bill refers to payment due to the European Union (EU) from the United Kingdom (UK) when it left the EU to settle the UK's share of the financing of all the obligations undertaken while it was a member of the EU. In the Withdrawal Agreement, it is officially referred to as the "financial settlement".

<span class="mw-page-title-main">Next Generation EU</span> COVID-19 support funding

Next Generation EU is a European Commission economic recovery package to support the EU member states to recover from the COVID-19 pandemic, in particular those that have been particularly hard hit. Agreed in principle by the European Council on 21 July 2020 and adopted on 14 December 2020, the instrument is worth €750 billion. NGEU will operate from 2021 to 2026, and will be tied to the regular 2021–2027 budget of the EU's Multiannual Financial Framework (MFF). The comprehensive NGEU and MFF packages are projected to reach €1824.3 billion.

The EU's Support to mitigate Unemployment Risks in an Emergency instrument is a temporary support for mitigating the risks of unemployment in emergency situations. It was created in April 2020 to help protect jobs and workers affected by the COVID-19 epidemic.

References

  1. European Union, Integrated Financial Reporting Package Overview, Financial year 2017. 2018. https://europa.eu/!hK34QQ
  2. 1 2 European Council conclusions, 10-11 December 2020 Retrieved 15 January 2021.
  3. European Structural and Investment Funds
  4. 1 2 Article 312(1) of the Treaty on the Functioning of the European Union.
  5. "The budgetary procedure". European Parliament. Retrieved 27 December 2022.
  6. Article 317(1) of the Treaty on the Functioning of the European Union.
  7. Title II of the Regulation (EU, Euratom) 2018/1046 of the European Parliament and of the Council of 18 July 2018 on the financial rules applicable to the general budget of the Union, amending Regulations (EU) No 1296/2013, (EU) No 1301/2013, (EU) No 1303/2013, (EU) No 1304/2013, (EU) No 1309/2013, (EU) No 1316/2013, (EU) No 223/2014, (EU) No 283/2014, and Decision No 541/2014/EU and repealing Regulation (EU, Euratom) No 966/2012.
  8. "Funding by management mode". European Commission. Retrieved 27 December 2022.
  9. Integrated Financial Reporting Package
  10. European Court of Auditors
  11. European Court of Auditors signs off EU accounts for 11th time in a row
  12. 1 2 3 4 © European Union, Revenue section, EU Budget 2017 Financial Report, 2018. https://europa.eu/!hy73fY
  13. © European Union, Revenue section, EU Budget 2017 Financial Report, 2018. https://europa.eu/!hy73fY https://europa.eu/!hy73fY
  14. "Statistics Explained". ec.europa.eu. Retrieved 15 April 2019.
  15. Charles Michel (2020). MFF-draft (PDF). Retrieved 15 January 2021.
  16. "The EU's own resources". Europa. European Commission. Retrieved 22 October 2015.
  17. "Brexit Fallout Could End Rebates for All EU States, Denmark Says". Bloomberg L.P. 20 September 2016. Retrieved 24 June 2017.
  18. Delcker, Janosch (6 January 2017). "Oettinger wants to scrap all rebates in post-Brexit EU budget". Politico. Retrieved 24 September 2017.
  19. Special meeting of the European Council, 17-21 July 2020 – paragraph A30. Retrieved 15 November 2020.
  20. "FAQ 6. Where does the money go?". Europa. Retrieved 22 October 2015.
  21. "FAQ 7. How much goes on administration?". Europa. Retrieved 22 October 2015.
  22. 1 2 3 4 "EU spending and revenue 2014-2020". European Commission. Retrieved 31 January 2024.
  23. "EU budget headings and ceilings". European Commission. Archived from the original on 15 April 2023. Retrieved 31 January 2024.
  24. "Flexibility and special instruments". European Commission. 25 October 2018. Archived from the original on 29 November 2023. Retrieved 31 January 2024.
  25. Special European Council, 17-21 July 2020 – Main results Retrieved 15 January 2021.
  26. "What is the budget of Horizon Europe?". EU Funds. 6 May 2021. Retrieved 9 September 2022.
  27. 1 2 Cipriani, Gabriele (2014). Financing the EU Budget (PDF). Centre for European Policy Studies. ISBN   978-1-78348-330-3 . Retrieved 22 October 2015.
  28. 1 2 "EU expenditure and revenue 2007-2013". Europa. European Commission. Retrieved 22 October 2015.
  29. Table 6, column (9)