List of sovereign states in Europe by Human Development Index

Last updated

Map of the European countries by HDI value in 2022 (includes transcontinental countries).
Very high HDI
.mw-parser-output .legend{page-break-inside:avoid;break-inside:avoid-column}.mw-parser-output .legend-color{display:inline-block;min-width:1.25em;height:1.25em;line-height:1.25;margin:1px 0;text-align:center;border:1px solid black;background-color:transparent;color:black}.mw-parser-output .legend-text{}
>= 0.920
0.890-0.919
0.850-0.889
0.800-0.849
High HDI
< 0.800 EuropeHDI2022.svg
Map of the European countries by HDI value in 2022 (includes transcontinental countries).
Very high HDI
  ≥ 0.920
  0.890–0.919
  0.850–0.889
  0.800–0.849
High HDI
  < 0.800

The Human Development Index (HDI) is a summary measure of average achievement in key dimensions of human development: a long and healthy life, knowledge, and a decent standard of living. It is a standard means of measuring well-being. It is used to distinguish whether the country is a developed, developing, or underdeveloped country, and also to measure the impact of economic policies on quality of life. Countries fall into four broad categories based on their HDI: very high, high, medium, and low human development. Currently, all European countries fall into the very high or high human development category.

Contents

List

The table below presents the latest Human Development Index (HDI) [1] for countries in Europe as included in a United Nations Development Programme's Human Development Report (released in 2020). [2] [3] Previous HDI values and rankings are retroactively recalculated using the same updated data sets and current methodologies, as presented in Table 2 of the Statistical Annex of the Human Development Report. [4]

Countries that are not entirely located in Europe are shown here in italics, but HDI figures are given for the whole country. Monaco and Vatican City are not ranked as they are not included in the latest report by the United Nations Development Programme. Kosovo is also not included.

List of European countries by Human Development Index
RankCountryHuman Development Index (HDI)
RegionWorldHDI 2022 [5] HDI 2021(revalued) [6] HDI 2021 [2] Change in HDI
value 2021–22
Very High Human Development
11Flag of Switzerland (Pantone).svg  Switzerland 0.9670.9640.962Increase2.svg 0.002
22Flag of Norway.svg  Norway 0.9660.9640.961Increase2.svg 0.002
33Flag of Iceland.svg  Iceland 0.9590.9570.959Increase2.svg 0.002
45Flag of Denmark.svg  Denmark 0.9520.9470.948Increase2.svg 0.005
Flag of Sweden.svg  Sweden 0.9520.9490.947Increase2.svg 0.003
57Flag of Ireland.svg  Ireland 0.9500.9460.945Increase2.svg 0.004
Flag of Germany.svg  Germany 0.9480.942Increase2.svg 0.002
610Flag of the Netherlands.svg  Netherlands 0.9460.9410.941Increase2.svg 0.005
712Flag of Belgium (civil).svg  Belgium 0.9420.9380.937Increase2.svg 0.004
Flag of Finland.svg  Finland 0.9420.9410.940Increase2.svg 0.001
Flag of Liechtenstein.svg  Liechtenstein 0.9420.9360.935Increase2.svg 0.006
815Flag of the United Kingdom.svg  United Kingdom 0.9400.9310.929Increase2.svg 0.009
920Flag of Luxembourg.svg  Luxembourg 0.9270.9270.930Steady2.svg
1022Flag of Slovenia.svg  Slovenia 0.9260.9160.918Increase2.svg 0.010
Flag of Austria.svg  Austria 0.9260.9200.916Increase2.svg 0.006
1125Flag of Malta.svg  Malta 0.9150.9120.918Increase2.svg 0.003
1227Flag of Spain.svg  Spain 0.9110.9040.905Increase2.svg 0.007
1328Flag of France.svg  France 0.9100.9060.903Increase2.svg 0.004
1429Flag of Cyprus.svg  Cyprus [N 1] 0.9070.9010.896Increase2.svg 0.006
1530Flag of Italy.svg  Italy 0.9060.8990.895Increase2.svg 0.007
1631Flag of Estonia.svg  Estonia 0.8990.8900.890Increase2.svg 0.009
1732Flag of the Czech Republic.svg  Czech Republic 0.8950.8910.889Increase2.svg 0.004
1833Flag of Greece.svg  Greece 0.8930.8870.887Increase2.svg 0.006
1935Flag of Andorra.svg  Andorra 0.8840.8550.858Increase2.svg 0.029
2036Flag of Poland.svg  Poland 0.8810.8760.876Increase2.svg 0.005
2137Flag of Latvia.svg  Latvia 0.8790.8650.863Increase2.svg 0.014
Flag of Lithuania.svg  Lithuania 0.8790.8750.875Increase2.svg 0.004
2239Flag of Croatia.svg  Croatia 0.8780.8670.858Increase2.svg 0.011
2342Flag of Portugal.svg  Portugal 0.8740.8650.866Increase2.svg 0.009
2443Flag of San Marino.svg  San Marino 0.8670.8530.853Increase2.svg 0.014
2545Flag of Slovakia.svg  Slovakia 0.8550.8520.848Increase2.svg 0.003
Flag of Turkey.svg  Turkey [N 2] 0.8550.8410.838Increase2.svg 0.014
2647Flag of Hungary.svg  Hungary 0.8510.8460.846Increase2.svg 0.005
2750Flag of Montenegro.svg  Montenegro 0.8440.8400.832Increase2.svg 0.004
2853Flag of Romania.svg  Romania 0.8270.8250.821Increase2.svg 0.002
2952Flag of Russia.svg  Russia [N 3] 0.8210.8180.822Increase2.svg 0.003
3060Flag of Georgia.svg  Georgia 0.8140.8090.802Increase2.svg 0.005
3165Flag of Serbia.svg  Serbia 0.8050.8040.802Increase2.svg 0.001
3267Flag of Kazakhstan.svg  Kazakhstan [N 4] 0.8020.8010.811Increase2.svg 0.001
3269Flag of Belarus.svg  Belarus 0.8010.8010.808Steady2.svg
High Human Development
3470Flag of Bulgaria.svg  Bulgaria 0.7990.7960.795Increase2.svg 0.003
4574Flag of Albania.svg  Albania 0.7890.7850.796Increase2.svg 0.004
3676Flag of Armenia.svg  Armenia [N 5] 0.7860.7740.759Increase2.svg 0.012
3780Flag of Bosnia and Herzegovina.svg  Bosnia and Herzegovina 0.7790.7760.780Increase2.svg 0.003
3883Flag of North Macedonia.svg  North Macedonia 0.7650.7640.770Increase2.svg 0.001
3986Flag of Moldova.svg  Moldova 0.7630.7670.767Decrease2.svg 0.004
4089Flag of Azerbaijan.svg  Azerbaijan [N 6] 0.7600.7380.745Increase2.svg 0.022
41100Flag of Ukraine.svg  Ukraine 0.7340.7550.773Decrease2.svg 0.021

Map

This is the map of the list of European countries by the Human Development Index for the year 2022. [2] The colour indicators are as follows:   High Human Development and   Very High Human Development.

See also

Notes

  1. Geographically, Cyprus is generally included in Western Asia or the Middle East, but it has been historically and culturally a European country.
  2. The European portion of Turkey comprises 3% of the country, making it a transcontinental country.
  3. Geographically, the majority of Russia lies in North Asia, but Russia is culturally and ethnically a part of Europe. European Russia is home to 78% of Russia's total population, but covers less than 25% of Russia's total land area.
  4. Kazakhstan is mainly located in Central Asia with a small portion west of the Ural River located in Eastern Europe.
  5. Armenia is located in the South Caucasus, south of the most commonly used dividing line between Europe and Asia. Some less common definitions include the entire Caucasus region in Europe. The country has political, historical and cultural ties with Europe.
  6. Geographically, Azerbaijan is located in the South Caucasus region of Eurasia, straddling Western Asia and Eastern Europe.

Related Research Articles

<span class="mw-page-title-main">Visegrád Group</span> Cultural and political alliance in Europe

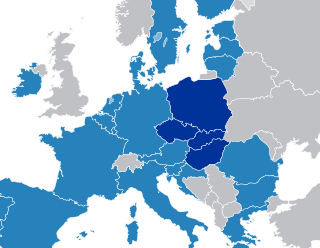
The Visegrád Group is a cultural and political alliance of four Central European countries: the Czech Republic, Hungary, Poland, and Slovakia. The alliance aims to advance co-operation in military, economic, cultural and energy affairs, and to further their integration with the EU. All four states are also members of the European Union (EU), the North Atlantic Treaty Organization (NATO), and the Bucharest Nine (B9).

<span class="mw-page-title-main">Developed country</span> Country with a developed industry and infrastructure

A developed country, or advanced country, is a sovereign state that has a high quality of life, developed economy, and advanced technological infrastructure relative to other less industrialized nations. Most commonly, the criteria for evaluating the degree of economic development are the gross domestic product (GDP), gross national product (GNP), the per capita income, level of industrialization, amount of widespread infrastructure and general standard of living. Which criteria are to be used and which countries can be classified as being developed are subjects of debate. Different definitions of developed countries are provided by the International Monetary Fund and the World Bank; moreover, HDI ranking is used to reflect the composite index of life expectancy, education, and income per capita. Another commonly used measure of a developed country is the threshold of GDP (PPP) per capita of at least US$22,000. In 2023, 40 countries fit all four criteria, while an additional 15 countries fit three out of four.

The category of newly industrialized country (NIC), newly industrialized economy (NIE) or middle income country is a socioeconomic classification applied to several countries around the world by political scientists and economists. They represent a subset of developing countries whose economic growth is much higher than that of other developing countries; and where the social consequences of industrialization, such as urbanization, are reorganizing society.

<span class="mw-page-title-main">World economy</span> Economy of the world

The world economy or global economy is the economy of all humans in the world, referring to the global economic system, which includes all economic activities conducted both within and between nations, including production, consumption, economic management, work in general, financial transactions and trade of goods and services. In some contexts, the two terms are distinct: the "international" or "global economy" is measured separately and distinguished from national economies, while the "world economy" is simply an aggregate of the separate countries' measurements. Beyond the minimum standard concerning value in production, use and exchange, the definitions, representations, models and valuations of the world economy vary widely. It is inseparable from the geography and ecology of planet Earth.

<span class="mw-page-title-main">Human Development Index</span> Composite statistic of life expectancy, education, and income indices

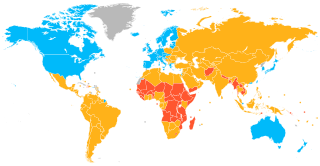
The Human Development Index (HDI) is a statistical composite index of life expectancy, education, and per capita income indicators, which is used to rank countries into four tiers of human development. A country scores a higher level of HDI when the lifespan is higher, the education level is higher, and the gross national income GNI (PPP) per capita is higher. It was developed by Pakistani economist Mahbub ul-Haq and was further used to measure a country's development by the United Nations Development Programme (UNDP)'s Human Development Report Office.

The following are links to some international rankings of the United States.

References

  1. "Table 1: Human Development Index (HDI) and its components".
  2. 1 2 3 Human Development Report 2021-22 Uncertain Times, Unsettled Lives: Shaping our Future in a Transforming World. United Nations Development Programme. 8 September 2022. pp. 284–288. Retrieved 14 March 2024.
  3. "Human Development Report 2019 – "Human Development Indices and Indicators"" (PDF). HDRO (Human Development Report Office) United Nations Development Programme. pp. 22–25. Retrieved 9 December 2019.
  4. "Table 2: Trends in the Human Development Index, 1990-2015".
  5. Human Development Report 2023-24 – Breaking the gridlock: Reimagining cooperation in a polarized world. United Nations Development Programme. 13 March 2024. pp. 288–292.{{cite book}}: CS1 maint: date and year (link)
  6. Human Development Report 2023-24 – Breaking the gridlock: Reimagining cooperation in a polarized world. United Nations Development Programme. 13 March 2024. pp. 288–292.{{cite book}}: CS1 maint: date and year (link)