
Scientific visualization is an interdisciplinary branch of science concerned with the visualization of scientific phenomena. It is also considered a subset of computer graphics, a branch of computer science. The purpose of scientific visualization is to graphically illustrate scientific data to enable scientists to understand, illustrate, and glean insight from their data. Research into how people read and misread various types of visualizations is helping to determine what types and features of visualizations are most understandable and effective in conveying information.

Visualization or visualisation is any technique for creating images, diagrams, or animations to communicate a message. Visualization through visual imagery has been an effective way to communicate both abstract and concrete ideas since the dawn of humanity. Examples from history include cave paintings, Egyptian hieroglyphs, Greek geometry, and Leonardo da Vinci's revolutionary methods of technical drawing for engineering and scientific purposes.

In scientific visualization and computer graphics, volume rendering is a set of techniques used to display a 2D projection of a 3D discretely sampled data set, typically a 3D scalar field.
Parallel rendering is the application of parallel programming to the computational domain of computer graphics. Rendering graphics can require massive computational resources for complex scenes that arise in scientific visualization, medical visualization, CAD applications, and virtual reality. Recent research has also suggested that parallel rendering can be applied to mobile gaming to decrease power consumption and increase graphical fidelity. Rendering is an embarrassingly parallel workload in multiple domains and thus has been the subject of much research.
General-purpose computing on graphics processing units is the use of a graphics processing unit (GPU), which typically handles computation only for computer graphics, to perform computation in applications traditionally handled by the central processing unit (CPU). The use of multiple video cards in one computer, or large numbers of graphics chips, further parallelizes the already parallel nature of graphics processing.
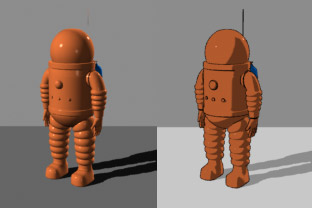
Non-photorealistic rendering (NPR) is an area of computer graphics that focuses on enabling a wide variety of expressive styles for digital art, in contrast to traditional computer graphics, which focuses on photorealism. NPR is inspired by other artistic modes such as painting, drawing, technical illustration, and animated cartoons. NPR has appeared in movies and video games in the form of cel-shaded animation as well as in scientific visualization, architectural illustration and experimental animation.
PowerVR is a division of Imagination Technologies that develops hardware and software for 2D and 3D rendering, and for video encoding, decoding, associated image processing and DirectX, OpenGL ES, OpenVG, and OpenCL acceleration. PowerVR also develops AI accelerators called Neural Network Accelerator (NNA).

The Visualization Toolkit (VTK) is an open-source software system for 3D computer graphics, image processing and scientific visualization.
Volume ray casting, sometimes called volumetric ray casting, volumetric ray tracing, or volume ray marching, is an image-based volume rendering technique. It computes 2D images from 3D volumetric data sets. Volume ray casting, which processes volume data, must not be mistaken with ray casting in the sense used in ray tracing, which processes surface data. In the volumetric variant, the computation doesn't stop at the surface but "pushes through" the object, sampling the object along the ray. Unlike ray tracing, volume ray casting does not spawn secondary rays. When the context/application is clear, some authors simply call it ray casting. Because ray marching does not necessarily require an exact solution to ray intersection and collisions, it is suitable for real time computing for many applications for which ray tracing is unsuitable.
Tiled rendering is the process of subdividing a computer graphics image by a regular grid in optical space and rendering each section of the grid, or tile, separately. The advantage to this design is that the amount of memory and bandwidth is reduced compared to immediate mode rendering systems that draw the entire frame at once. This has made tile rendering systems particularly common for low-power handheld device use. Tiled rendering is sometimes known as a "sort middle" architecture, because it performs the sorting of the geometry in the middle of the graphics pipeline instead of near the end.
3D Slicer (Slicer) is a free and open source software package for image analysis and scientific visualization. Slicer is used in a variety of medical applications, including autism, multiple sclerosis, systemic lupus erythematosus, prostate cancer, lung cancer, breast cancer, schizophrenia, orthopedic biomechanics, COPD, cardiovascular disease and neurosurgery.

A 3D city model is digital model of urban areas that represent terrain surfaces, sites, buildings, vegetation, infrastructure and landscape elements in three-dimensional scale as well as related objects belonging to urban areas. Their components are described and represented by corresponding two- and three-dimensional spatial data and geo-referenced data. 3D city models support presentation, exploration, analysis, and management tasks in a large number of different application domains. In particular, 3D city models allow "for visually integrating heterogeneous geoinformation within a single framework and, therefore, create and manage complex urban information spaces."
Order-independent transparency (OIT) is a class of techniques in rasterisational computer graphics for rendering transparency in a 3D scene, which do not require rendering geometry in sorted order for alpha compositing.
Computer graphics is a sub-field of computer science which studies methods for digitally synthesizing and manipulating visual content. Although the term often refers to the study of three-dimensional computer graphics, it also encompasses two-dimensional graphics and image processing.

Computer graphics deals with generating images and art with the aid of computers. Today, computer graphics is a core technology in digital photography, film, video games, digital art, cell phone and computer displays, and many specialized applications. A great deal of specialized hardware and software has been developed, with the displays of most devices being driven by computer graphics hardware. It is a vast and recently developed area of computer science. The phrase was coined in 1960 by computer graphics researchers Verne Hudson and William Fetter of Boeing. It is often abbreviated as CG, or typically in the context of film as computer generated imagery (CGI). The non-artistic aspects of computer graphics are the subject of computer science research.

The Scientific Computing and Imaging (SCI) Institute is a permanent research institute at the University of Utah that focuses on the development of new scientific computing and visualization techniques, tools, and systems with primary applications to biomedical engineering. The SCI Institute is noted worldwide in the visualization community for contributions by faculty, alumni, and staff. Faculty are associated primarily with the School of Computing, Department of Bioengineering, Department of Mathematics, and Department of Electrical and Computer Engineering, with auxiliary faculty in the Medical School and School of Architecture.

MeVisLab is a cross-platform application framework for medical image processing and scientific visualization. It includes advanced algorithms for image registration, segmentation, and quantitative morphological and functional image analysis. An IDE for graphical programming and rapid user interface prototyping is available.

Christopher Ray Johnson is an American computer scientist. He is a distinguished professor of computer science at the University of Utah, and founding director of the Scientific Computing and Imaging Institute (SCI). His research interests are in the areas of scientific computing and scientific visualization.

Tachyon is a parallel/multiprocessor ray tracing software. It is a parallel ray tracing library for use on distributed memory parallel computers, shared memory computers, and clusters of workstations. Tachyon implements rendering features such as ambient occlusion lighting, depth-of-field focal blur, shadows, reflections, and others. It was originally developed for the Intel iPSC/860 by John Stone for his M.S. thesis at University of Missouri-Rolla. Tachyon subsequently became a more functional and complete ray tracing engine, and it is now incorporated into a number of other open source software packages such as VMD, and SageMath. Tachyon is released under a permissive license.
Visual computing is a generic term for all computer science disciplines dealing with images and 3D models, such as computer graphics, image processing, visualization, computer vision, virtual and augmented reality and video processing. Visual computing also includes aspects of pattern recognition, human computer interaction, machine learning and digital libraries. The core challenges are the acquisition, processing, analysis and rendering of visual information. Application areas include industrial quality control, medical image processing and visualization, surveying, robotics, multimedia systems, virtual heritage, special effects in movies and television, and computer games.
