2011 South African municipal elections

Last updated

2011 South African municipal elections
Flag of South Africa.svg
  2006 18 May 2011 2016  

All councillors for all 8 metropolitan municipalities

All councillors for all 226 local municipalities

40% of councillors for all 44 district municipalities
 First partySecond partyThird party
  Jacob Zuma 2014 (cropped).jpg Helen Zille - two.jpg Mangosuthu Buthelezi (1983).jpg
Leader Jacob Zuma Helen Zille Mangosuthu Buthelezi
Party ANC Democratic Alliance IFP
Last election64.82%16.24%7.53%
Popular vote16,548,9706,393,890954,021
Percentage61.95%23.94%3.57%
SwingDecrease2.svg 2.87%Increase2.svg 7.7%Decrease2.svg 3.96%
Two ballot papers from the 2011 South African municipal election in Cape Town. The ballot on the left is for the party-list proportional representation vote for the Cape Town City Council and the ballot on the right is for the election of the local councillor in Ward 59. South African municipal election, 2011 ballot.jpg
Two ballot papers from the 2011 South African municipal election in Cape Town. The ballot on the left is for the party-list proportional representation vote for the Cape Town City Council and the ballot on the right is for the election of the local councillor in Ward 59.

Municipal elections were held in South Africa on 18 May 2011, [1] electing new councils for all municipalities in the country. Municipal elections are held every five years, [2] and the previous municipal elections were held in 2006. The first municipal elections following the reorganisation of municipalities took place in December 2000.

Contents

Half of the seats (rounded up for odd numbers) in each municipality are elected on the first past the post system in single member wards. The other half of the seats are allocated to restore proportionality as follows:

The total number of seats are allocated using the largest remainder method by using a modified Hare quota. Proportional seats are allocated based on the difference. Overhang seats are theoretically possible. These do not affect the quota but will reduce the number of remainder seats if any. Independent candidates are allowed for in the ward seats, and the proportionality calculations effectively ignore votes for these candidates and are adjusted for seats allocated to them. [3]

Background

Election campaign poster for the Democratic Alliance DA 2011 Election Poster.jpg
Election campaign poster for the Democratic Alliance

The ruling party of South Africa, the African National Congress (ANC), has been facing a growing opposition from the Democratic Alliance (DA). The DA holds control of the Western Cape area, with Cape Town the major city of the province. The DA had made it known that there was a possibility of victory in the Northern Cape province. [4]

The ANC faced tough challenges from the opposition parties over issues of service delivery, corruption, healthcare reform, poverty and unemployment rates.

The Congress of the People (COPE) (a breakaway party formed from within the ANC) and the Inkatha Freedom Party (IFP) were determined to prove that they could increase their control in areas as well. Various other parties were expected to contest the elections as well; however, based on previous elections and expected changes since then, they are expected to hold a minority power relative to the ANC, DA, Cope and IFP parties respectively.

The election was generally peaceful, with the exception of an attack on an IFP councilor that resulted in his death. [5]

Cities

Former DA leader Helen Zille attempted to improve her party's success at multi-party governance in Cape Town and also bring the ANC's support under 50% in other major cities. Initial reports suggested that Port Elizabeth was the most vulnerable for the ANC, with Pretoria, Johannesburg, Ekurhuleni and almost all municipalities in the Northern Cape facing stiff challenges from the DA and COPE.

Port Elizabeth lies in a unique region roughly at the border between the Black and Coloured (i.e. mixed raced) population groups. It was predicted that there would be a strong effort from minorities in the city to try to gain control of the council. Although the Nelson Mandela Bay municipality is over 60% black, the DA hoped that by using COPE and the United Democratic Movement, the vote for the ANC could have possibly been lowered under 50% (i.e. minority power) enabling the DA to form a coalition with smaller parties and assume governance of the area. The Nelson Mandela Bay municipality was heavily contested in the elections with the ANC managing to secure 63 seats to the DA's 48 seats. Zille attributed the failure of the DA to win the metro to the decline of COPE, claiming that the latter's retention of votes could have unseated the ANC allowing a coalition government in the metro. [6]

Election boycott

The Poor People's Alliance called for a boycott of the election under the slogan No Land! No House! No Vote!. [7]

There were vote boycott campaigns by a number of civil society organisations including Soundz of the South, the Mandela Park Backyarders, the Mitchell's Plain Backyarders Association and various communities such as Blikkiesdorp in Western Cape, Morutsi in Limpopo, King William's Town and Grahamstown in the Eastern Cape, Cato Ridge in KwaZulu-Natal, Ermelo in Mpumalanga and elsewhere around the country. [8]

There was also significant abstention by ANC members and supporters who felt the selection of ANC candidates was biased but refused to vote for any other party. [9]

Election results

The statistics in this section are all sourced from the Independent Electoral Commission's official website unless specified otherwise.

Map showing the outcome of the election in the metropolitan and local municipalities
.mw-parser-output .legend{page-break-inside:avoid;break-inside:avoid-column}.mw-parser-output .legend-color{display:inline-block;min-width:1.25em;height:1.25em;line-height:1.25;margin:1px 0;text-align:center;border:1px solid black;background-color:transparent;color:black}.mw-parser-output .legend-text{}
ANC outright winner
ANC largest party
DA outright winner
DA largest party
IFP outright winner
IFP largest party
NFP outright winner
NFP largest party
ANC, DA tied
ANC, IFP tied
Other party largest South Africa 2011 LGE council winners.svg
Map showing the outcome of the election in the metropolitan and local municipalities
   ANC outright winner
  ANC largest party
   DA outright winner
  DA largest party
   IFP outright winner
  IFP largest party
   NFP outright winner
  NFP largest party
  ANC, DA tied
  ANC, IFP tied
  Other party largest
Map showing the party of the elected councillor in each ward.
ANC
DA
IFP
NFP
Other party
Independent South Africa 2011 LGE ward winners.svg
Map showing the party of the elected councillor in each ward.
  ANC
  DA
  IFP
  NFP
  Other party
  Independent

The voter turnout for this election was predicted to be higher than the previous election in 2006. 23.65 million people were registered to vote (with more than five million people eligible to vote not being registered), [10] while the actual turnout of voters was 13.66 million people representing a 57.64% turnout, making it the highest voter turnout ever since the first municipal election in 2000. [11] The percentage of spoilt votes was 1.89%.

The ANC won just under 62% of the vote and the DA won just under 24% of the vote. [12] There was a decline in ANC support and an increase in support for the DA as the ANC lost voters in every province with the exception of Kwa-ZuluNatal where it captured votes from former IFP voters. [13]

PartyWardPRWard + PRDC
Votes%Votes%Votes%Votes%
ANC 8,143,39761.0%8,405,42962.9%16,548,826 62.0% 5,455,41169.4%
Democratic Alliance 3,177,88323.8%3,216,00624.1%6,393,886 23.9% 1,202,56215.3%
IFP 478,4003.6%475,6213.6%954,021 3.6% 406,3195.2%
NFP 326,5652.4%318,3522.4%644,917 2.4% 247,3403.1%
COPE 274,0742.1%296,6242.2%570,698 2.1% 236,3963.0%
UDM 83,7280.6%84,6230.6%168,351 0.6% 67,4870.9%
ACDP 86,8650.7%78,7370.6%165,602 0.6% 43,9480.6%
FF Plus 66,5880.5%53,9310.4%120,519 0.5% 32,6400.4%
PAC 63,9760.5%54,8460.4%118,822 0.4% 28,9180.4%
Minority Front 60,1530.5%53,0420.4%113,1950.4% 9580.0%
African People's Convention 38,1590.3%54,3320.4%92,491 0.3% 22,6500.3%
United Christian Democratic Party 25,0310.2%25,9710.2%51,002 0.2% 4660.0%
Azanian People's Organisation 24,3310.2%26,3000.2%50,631 0.2% 19,2020.2%
108 other parties202,5951.5%213,6971.6%416,292 1.6% 93,5121.2%
Independent 302,2422.3%N/A302,242 1.1% N/A
Total 13,353,987 13,357,511 26,711,498 7,857,809
Spoilt votes 235,014235,345470,359196,248

Note: "Ward" column indicates votes cast for individual ward councillors. "PR" column indicates proportional representation votes cast for parties in the election of local and metropolitan municipal councils. "DC" column indicate proportional representation votes cast for parties for the directly elected components of district councils. All voters cast Ward and PR ballots, but those resident in the metropolitan municipalities (approximately 40% of the population) do not cast DC ballots.

Regional summary

Eastern Cape

In the Eastern Cape, the ANC captured a majority in all but one municipality; the lone exception, Baviaans, was won by the DA with four seats to the ANC's three. The Nelson Mandela Bay Metro was closely contested however, with the ANC dropping 15% of the vote, but retaining a narrow majority.

Metropolitan Municipalities
Municipality ANC COPE DA UDM OthersTotalControl
Buffalo City 7132105100ANC Majority
Nelson Mandela Bay 6364812120ANC Majority
Two-tier Municipalities
Camdeboo 8060014ANC Majority
Blue Crane Route 7040011ANC Majority
Ikwezi 502007ANC Majority
Makana 20160128ANC Majority
Ndlambe 13060120ANC Majority
Sundays River Valley 12030116ANC Majority
Baviaans 304007DA Majority
Kouga 150140029ANC Majority
Kou-Kamma 6050011ANC Majority
Mbhashe 41917361ANC Majority
Mnquma 47724262ANC Majority
Great Kei 11020013ANC Majority
Amahlathi 33320240ANC Majority
Ngqushwa 24010025ANC Majority
Nkonkobe 35220241ANC Majority
Nxuba 502018ANC Majority
Inxuba Yethemba 12060018ANC Majority
Tsolwana 7110110ANC Majority
Inkwanca 511007ANC Majority
Lukhanji 45251154ANC Majority
Intsika Yethu 37202142ANC Majority
Emalahleni 30111134ANC Majority
Engcobo 35003240ANC Majority
Sakhisizwe 14110117ANC Majority
Elundini 28022234ANC Majority
Senqu 32021237ANC Majority
Maletswai 9021012ANC Majority
Gariep 7030010ANC Majority
Ngquza Hill 55411162ANC Majority
Port St Johns 32121339ANC Majority
Nyandeni 53224061ANC Majority
Mhlontlo 48103052ANC Majority
King Sabata Dalindyebo 462218270ANC Majority
Matatiele 39231752ANC Majority
Umzimvubu 46122354ANC Majority
Mbizana 54211361ANC Majority
Ntabankulu 31211136ANC Majority
Total10845616955511415

Free State

The ANC won a majority in every municipality in the Free State, including the newly upgraded Mangaung Metropolitan Municipality, in which it won 65 of the 97 available seats, against the DA's 26.

Municipality ANC COPE DA OthersTotal
Mangaung 65326397
Letsemeng 812011
Kopanong 1013115
Mohokare 902011
Naledi 61108
Masilonyana 1612120
Tokologo 51118
Tswelopele 1212015
Matjhabeng 52316172
Nala 1823124
Setsoto 2626135
Dihlabeng 3018140
Nketoana 1402218
Maluti-a-Phofung 52141269
Phumelela 1203015
Mantsopa 1313017
Moqhaka 34311250
Ngwathe 2819139
Metsimaholo 26015142
Mafube 1223017
Total4482512228623

Gauteng

The ANC won a majority in all but one of the municipalities in Gauteng, the lone exception being Midvaal, which was won by the DA. The following table shows the number of seats won by the various parties in the metropolitan and local municipalities in the province.

Municipality ANC COPE DA IFP VF+ OthersTotal
Ekurhuleni (East Rand)1252622110202
City of Johannesburg 153390419260
City of Tshwane (Pretoria)118282044210
Emfuleni 6412101289
Midvaal 1101501027
Lesedi 190601026
Mogale City (Krugersdorp)4112311168
Randfontein 2711600044
Westonaria 231410231
Merafong City 4111110256
Total62211330910301013

KwaZulu-Natal

Outcome of the election in KwaZulu-Natal
ANC outright winner
ANC largest party
IFP outright winner
IFP largest party
NFP outright winner
NFP largest party
ANC, IFP tied KwaZulu-Natal 2011 LGE council winners.svg
Outcome of the election in KwaZulu-Natal
   ANC outright winner
  ANC largest party
   IFP outright winner
  IFP largest party
   NFP outright winner
  NFP largest party
  ANC, IFP tied

In the following table, green rows indicate municipalities won by the ANC, red rows indicate those won by the Inkatha Freedom Party (IFP), yellow rows indicate those won by the National Freedom Party (NFP), and grey rows indicate those with no majority party.

Municipality ANC DA IFP NFP OthersTotalCoalitions
eThekwini 1264391017205
Vulamehlo 12025020
Umdoni 12411119
Umzumbe 26128138
uMuziwabantu 12124019
Ezingoleni 8012011
Hibiscus Coast 411132158
uMshwathi 19232026
uMngeni 14900023
Mpofana 511007
Impendle 601007
Msunduzi 491544173
Mkhambathini 9131014
Richmond 11100214
Emnambithi/Ladysmith 34486153
Indaka 6086020ANC-NFP
Umtshezi 8153017ANC-NFP
Okhahlamba 13186028ANC-NFP
Imbabazane 12157025ANC-NFP
Endumeni 6321012ANC-NFP
Nquthu 141145034ANC-NFP
Msinga 120214037
Umvoti 10192022ANC-NFP
Newcastle 335125661
eMadlangeni 412108ANC-NFP
Dannhauser 11163122ANC-NFP
eDumbe 4128015
uPhongolo 11178027ANC-NFP
Abaqulusi 173167144ANC-NFP
Nongoma 601719042NFP-ANC
Ulundi 602813047
uMhlabuyalingana 22084034
Jozini 200164040ANC-NFP
The Big Five False Bay 303107ANC-NFP
Hlabisa 4084016ANC-NFP
Mtubatuba 160157038ANC-NFP
Mbonambi 170103030
uMhlathuze 366106260
Ntambanana 7063016ANC-NFP
uMlalazi 241189052ANC-NFP
Mthonjaneni 5051011ANC-NFP
Nkandla 110133027ANC-NFP
Mandeni 23146034
KwaDukuza 37842253
Ndwedwe 25155137
Maphumulo 12082022
Ingwe 16132022
Kwa Sani 520007
Greater Kokstad 12300116
Ubuhlebezwe 18123024
Umzimkhulu 36012140
Total906137341210391633

Limpopo

The ANC's complete dominance of Limpopo remained unchallenged as other parties achieved only small minorities.

Municipality ANC COPE DA OthersTotal
Greater Giyani 5002860
Greater Letaba 5141157
Greater Tzaneen 5925268
Ba-Phalaborwa 2924136
Maruleng 1922427
Musina 910212
Mutale 2311126
Thulamela 7023580
Makhado 6435375
Blouberg 3712141
Aganang 3221237
Molemole 2411127
Polokwane 6139376
Lepelle-Nkumpi 4742457
Thabazimbi 1605223
Lephalale 201324
Mookgophong 612110
Modimolle 1304118
Bela-Bela 1204117
Mogalakwena 5325363
Ephraim Mogale 2312632
Elias Motsoaledi 41141460
Makhuduthamaga 5231561
Fetakgomo 2121125
Greater Tubatse 5033662
Total8824272781074

Mpumalanga

The ANC's control of this province was not significantly challenged with the DA only gaining some support in the more urbanised municipalities.

Municipality ANC COPE DA OthersTotal
Albert Luthuli 4413149
Msukaligwa 3115138
Mkhondo 2806438
Pixley ka Seme 1603221
Lekwa 2306130
Dipaleseng 702312
Govan Mbeki 45116163
Delmas 1303117
Emalahleni 49018168
Steve Tshwete 39117158
Emakhazeni 1104015
Thembisile Hani 5104964
Dr JS Moroka 5214562
Thaba Chweu 2006127
Mbombela 66010278
Umjindi 1503018
Nkomazi 6004165
Bushbuckridge 55331374
Total625811747797

North West

The North West remains firmly under ANC control with the DA getting some support in the larger towns.

Municipality ANC COPE DA OthersTotal
Moretele 4613555
Madibeng 54114372
Rustenburg 55115576
Kgetlengrivier 90312
Moses Kotane 4943662
Ratlou 2221328
Tswaing 2207130
Mafikeng 4437862
Ditsobotla 3217242
Ramotshere Moiloa 2922639
Naledi 1215018
Mamusa 1212015
Greater Taung 4323351
Lekwa-Teemane 1013014
Kagisano-Molopo 2412330
Ventersdorp 1002012
Tlokwe 30119252
Matlosana 51116270
Maquassi Hills 1713021
Total5712411749761

Northern Cape

The ANC's control in this province was challenged only in the thinly populated Afrikaans speaking Karoo areas adjoining the DA dominated Western Cape. The more densely populated and Tswana dominated northern districts remain firmly in the hands of the ANC.

Municipality ANC COPE DA OthersTotalCoalitions
Richtersveld 50308
Nama Khoi 836017DA-COPE
Kamiesberg 41207
Hantam 41409DA-COPE
Karoo Hoogland 32207COPE-DA
Khâi-Ma 42107
Ubuntu 41308ANC [14]
Umsobomvu 721010
Emthanjeni 715114ANC-IND
Kareeberg 41207
Renosterberg 42107
Thembelihle 52108
Siyathemba 42107
Siyancuma 722011
Mier 41207
Kai !Garib 1034017
[[//Khara Hais Local Municipality|//Khara Hais]]1647027
!Kheis 42107
Tsantsabane 612211
Kgatelopele 51208
Sol Plaatje 40516162
Dikgatlong 1012013
Magareng 61209
Phokwane 1313118
Joe Morolong 2331229
Ga-Segonyana 2013125
Gamagara 613010
Total23347828370

Western Cape

Outcome of the election in the Western Cape
DA outright winner
DA largest party
ANC outright winner
ANC largest party
ANC, DA tied
ICOSA largest party
KGP largest party Western Cape 2011 LGE council winners.svg
Outcome of the election in the Western Cape
   DA outright winner
  DA largest party
   ANC outright winner
  ANC largest party
  ANC, DA tied
   ICOSA largest party
   KGP largest party

The Western Cape swung heavily to the DA, which won outright the City of Cape Town metropolitan municipality, as well as 11 of the 24 local municipalities in the province. In a further four local municipalities the DA was the largest party but did not hold a majority of seats. The ANC won outright only the Beaufort West Local Municipality, and was the largest party in the Cederberg Local Municipality but did not hold a majority there. Five local municipalities were evenly split between the ANC and the DA, with other parties holding the balance of power. In the Kannaland Local Municipality, the Independent Civic Organisation of South Africa won a plurality of three seats while the ANC and the DA won two each; a similar situation obtained in the Prince Albert Local Municipality, where the Karoo Gemeenskaps Party won three seats and the ANC and the DA two each.

In the following table, blue rows indicate municipalities won by the DA, green rows indicate those won by the ANC, and grey rows indicate those with no majority party.

Municipality ANC COPE DA OthersTotal
City of Cape Town 73313510221
Matzikama 607215
Cederberg 514111
Bergrivier 517013
Saldanha Bay 8115125
Swartland 6115123
Witzenberg 8110423
Drakenstein 19235561
Stellenbosch 11125643
Breede Valley 14122441
Langeberg 7111423
Theewaterskloof 9113225
Overstrand 9015125
Cape Agulhas 40419
Swellendam 40419
Kannaland 20237
Hessequa 617115
Mossel Bay 10016127
George 19125449
Oudtshoorn 11111225
Knysna 7110119
Bitou 616013
Laingsburg 31307
Prince Albert 20237
Beaufort West 705113
Total2612040958748

Related Research Articles

<span class="mw-page-title-main">National Assembly of South Africa</span> Lower house of the Parliament of South Africa

The National Assembly is the directly elected house of the Parliament of South Africa, located in Cape Town, Western Cape. It consists of four hundred members who are elected every five years using a party-list proportional representation system where half of the members are elected proportionally from nine provincial lists and the remaining half from national lists so as to restore proportionality.

<span class="mw-page-title-main">Bitou Local Municipality</span> Local municipality in Western Cape, South Africa

Bitou Municipality, formerly known as Plettenberg Bay Municipality, is a local municipality within the Garden Route District Municipality, in the Western Cape province of South Africa. Its municipality code is WC047.

<span class="mw-page-title-main">City of Cape Town</span> Metropolitan municipality in Western Cape, South Africa

The City of Cape Town is the local government of Cape Town and surrounding areas. As of the 2011 census, it had a population of 3,740,026.

<span class="mw-page-title-main">2006 South African municipal elections</span>

Municipal elections were held in South Africa on 1 March 2006, to elect members to the local governing councils in the municipalities of South Africa. The municipalities form the local government of South Africa and are subdivisions of the provinces, thus making them responsible for local service delivery, such as electricity, water and fire services.

<span class="mw-page-title-main">2009 South African general election</span>

General elections were held in South Africa on 22 April 2009 to elect members of the National Assembly and provincial legislatures. These were the fourth general elections held since the end of the apartheid era.

<span class="mw-page-title-main">2014 South African general election</span> 2014 South African National Assembly and provincial legislatures elections

General elections were held in South Africa on 7 May 2014, to elect a new National Assembly and new provincial legislatures in each province. It was the fifth election held in South Africa under conditions of universal adult suffrage since the end of the apartheid era in 1994, and also the first held since the death of Nelson Mandela. It was also the first time that South African expatriates were allowed to vote in a South African national election.

The 2016 South African municipal elections were held on 3 August 2016, to elect councils for all district, metropolitan and local municipalities in each of the country's nine provinces. It was the fifth municipal election held in South Africa since the end of apartheid in 1994; municipal elections are held every five years.

The council of the Overstrand Local Municipality in the Western Cape, South Africa is elected every five years by a system of mixed-member proportional representation. Half of the councillors are elected by first-past-the-post voting from individual wards, while the other half are appointed from party lists so that the total number of party representatives is proportional to the number of votes received. By-elections are held to replace the councillors elected by wards if a vacancy occurs.

<span class="mw-page-title-main">2019 South African general election</span>

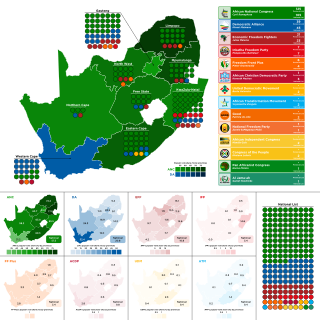
General elections were held in South Africa on 8 May 2019 to elect a new President, National Assembly and provincial legislatures in each province. These were the sixth elections held since the end of apartheid in 1994 and determined who would become the next President of South Africa.

The council of the City of Cape Town in the Western Cape, South Africa is elected every five years by a system of mixed-member proportional representation. Half of the councillors are elected by first-past-the-post voting from individual wards, while the other half are appointed from party lists so that the total number of party representatives is proportional to the number of votes received. By-elections are held to replace the councillors elected by wards if a vacancy occurs.

<span class="mw-page-title-main">2021 South African municipal elections</span> South African municipal elections which were held on 1 November 2021

The 2021 South African municipal elections were held on 1 November 2021, to elect councils for all district, metropolitan and local municipalities in each of the country's nine provinces. It is the sixth municipal election held in South Africa since the end of apartheid in 1994, held every five years. The previous municipal elections were held in 2016. On 21 April 2021, President Cyril Ramaphosa announced that the elections will be held on Wednesday, 27 October 2021. It had been recommend by Dikgang Moseneke to delay the municipal elections until 2022. The Electoral Commission of South Africa (IEC) requested the Constitutional Court to support the date postponement. The Economic Freedom Fighters (EFF) supported the date postponement while the Democratic Alliance (DA) was against the postponement of the date. The Constitutional Court dismissed the application to postpone the date until 2022, ruling that they had to take place between 27 October and 1 November. On 9 September 2021, the Minister of Cooperative Governance and Traditional Affairs, Nkosazana Dlamini-Zuma announced that the elections would be held on 1 November.

The Cederberg Local Municipality consists of eleven members elected by mixed-member proportional representation. Six councillors are elected by first-past-the-post voting in six wards, while the remaining five are chosen from party lists so that the total number of party representatives is proportional to the number of votes received. In the election of 1 November 2021, no party won a majority, with the African National Congress the largest party with four seats.

<span class="mw-page-title-main">Stellenbosch Local Municipality elections</span>

The Stellenbosch Local Municipality council consists of forty-three members elected by mixed-member proportional representation. Twenty-two councillors are elected by first-past-the-post voting in twenty-two wards, while the remaining twenty-one are chosen from party lists so that the total number of party representatives is proportional to the number of votes received. In the 2021 local government elections, the Democratic Alliance (DA) received a majority of twenty-eight seats on the council.

The uMhlathuze Local Municipality council consists of sixty-seven members elected by mixed-member proportional representation. Thirty-four councillors are elected by first-past-the-post voting in thirty-four wards, while the remaining thirty-three are chosen from party lists so that the total number of party representatives is proportional to the number of votes received.

The Dannhauser Local Municipality council consists of twenty-five members elected by mixed-member proportional representation. Thirteen councillors are elected by first-past-the-post voting in thirteen wards, while the remaining twelve are chosen from party lists so that the total number of party representatives is proportional to the number of votes received.

The Abaqulusi Local Municipality council within the South African Zululand District Municipality consists of forty-four members elected by mixed-member proportional representation. Twenty-two councillors are elected by first-past-the-post voting in twenty-two wards, while the remaining twenty-two are chosen from party lists so that the total number of party representatives is proportional to the number of votes received.

The Nquthu Local Municipality council consists of thirty-seven members elected by mixed-member proportional representation. Nineteen councillors are elected by first-past-the-post voting in nineteen wards, while the remaining eighteen are chosen from party lists so that the total number of party representatives is proportional to the number of votes received.

The Mtubatuba Local Municipality council consists of forty-five members elected by mixed-member proportional representation. Twenty-three councillors are elected by first-past-the-post voting in twenty-three wards, while the remaining twenty-two are chosen from party lists so that the total number of party representatives is proportional to the number of votes received.

The Umvoti Local Municipality council consists of twenty-seven members elected by mixed-member proportional representation. Fourteen councillors are elected by first-past-the-post voting in fourteen wards, while the remaining thirteen are chosen from party lists so that the total number of party representatives is proportional to the number of votes received.

The Mkhondo Local Municipality is a Local Municipality in Mpumalanga, South Africa. The council consists of thirty-eight members elected by mixed-member proportional representation. Nineteen councillors are elected by first-past-the-post voting in nineteen wards, while the remaining nineteen are chosen from party lists so that the total number of party representatives is proportional to the number of votes received. In the election of 1 November 2021 the African National Congress (ANC) won a majority of twenty-one seats.

References

  1. "Local Elections on 18 May". BuaNews. 3 March 2011. Archived from the original on 5 March 2011. Retrieved 9 March 2011.
  2. Section 159 in Chapter 7 Archived 5 January 2011 at the Wayback Machine of the Constitution of South Africa. A municipal council's term expires after 5 years, but the council continue with its functions until the election of a new council, which must be held within 90 days of the expiry of the council's term.
  3. Schedule 1 to the Local Government: Municipal Structures Act, No. 117 of 1998, as amended.
  4. "South African municipal election, 2011". Archived from the original on 17 November 2010. Retrieved 2 February 2011.
  5. IFP councillor dies after alleged assault
  6. "ANC wins Nelson Mandela Bay". Times Live. 19 May 2011. Archived from the original on 22 May 2011. Retrieved 21 May 2011.
  7. W Cape voters 'not predictable', Quinton Mtyala and Babalo Ndenze, The Cape Argus, 18 May 2011
  8. (These citations relate to various boycott campaigns in different localities.)
  9. We won't vote for 'a stranger', Vuvu Vena, Dispatch, 19 May 2011
  10. Devil in the Data: South Africa's Rich Overrepresented in the Vote, by Ebrahim-Khalil Hassen, SACSIS, 3 June 2011
  11. "Voter turnout highest ever - IEC". 21 May 2011. Retrieved 21 May 2011.
  12. Zuma is the loser, despite ANC poll win, Business Day, 23 May 2011
  13. 'The swing's the thing' that shows the political trend, Alistair Sparks, Business Day, 25 May 2011
  14. "'Ancestors' shine on ANC's coin toss".