2018 United States House of Representatives election ratings

Last updated

2018 United States House of Representatives election ratings
Flag of the United States.svg
  2016
2020  

The 2018 United States House of Representatives elections were held on November 6, 2018, with early voting taking place in some states in the weeks preceding that date. Voters chose representatives from all 435 congressional districts across each of the 50 U.S. states. Non-voting delegates from the District of Columbia and four of the five inhabited U.S. territories [lower-alpha 1] were also elected. These midterm elections took place nearly halfway through the first term of Republican President Donald Trump. The winners will serve in the 116th United States Congress, with seats apportioned among the states based on the 2010 United States census. On Election Day, Republicans had held a House majority since January 2011 as a result of the 2010 elections.

Contents

In the 2018 midterm elections, the Democrats won control of the House and had a net gain of more than 40 seats from their total after the 2016 elections (including one seat gained previously with Conor Lamb's March 2018 special election victory). This was their largest gain of seats since the 1974 elections, when they picked up 49 seats.

Election ratings

Latest published ratings for competitive seats

Several sites and individuals publish ratings of competitive seats. The seats listed below were considered competitive (not "safe" or "solid") by at least one of the rating groups. These ratings are based upon factors such as the strength of the incumbent (if the incumbent is running for re-election), the strength of the candidates, and the partisan history of the district (the Cook Partisan Voting Index is one example of this metric). Each rating describes the likelihood of a given outcome in the election.

Most election ratings use:

The following are the latest published ratings for competitive seats.

District CPVI [1] [2] IncumbentPrevious
result [3]
Cook
November 5, 2018 [4]
IE
November 5, 2018 [5]
Sabato
November 5, 2018 [6]
RCP
November 5, 2018 [7]
Daily Kos
November 5, 2018 [8]
538
November 6, 2018 [lower-alpha 2] [9]
Winner [10]
Alaska at-large R+9 Don Young (R)50.3% RLean RLikely RLean RTossupLean RLean R Don Young (R)
Arizona 1 R+2 Tom O'Halleran (D)50.7% DLean DLean DLikely DTossupLikely DLikely D Tom O'Halleran (D)
Arizona 2 R+1 Martha McSally (R) (retiring) [lower-alpha 3] 57.0% RLean D (flip)Lean D (flip)Likely D (flip)Lean D (flip)Likely D (flip)Safe D (flip) Ann Kirkpatrick (D)
Arizona 6 R+9 David Schweikert (R)62.1% RLikely RSafe RLikely RLikely RSafe RLikely R David Schweikert (R)
Arizona 8 R+13 Debbie Lesko (R)52.4% RLikely RLikely RLikely RLikely RSafe RLikely R Debbie Lesko (R)
Arizona 9 D+4 Kyrsten Sinema (D) (retiring) [lower-alpha 3] 60.9% DSafe DSafe DSafe DLikely DSafe DSafe D Greg Stanton (D)
Arkansas 2 R+7 French Hill (R)58.4% RLikely RLikely RLean RLikely RLikely RLikely R French Hill (R)
California 1 R+11 Doug LaMalfa (R)59.1% RLikely RSafe RSafe RSafe RSafe RLikely R Doug LaMalfa (R)
California 4 R+10 Tom McClintock (R)62.7% RLikely RLikely RLikely RLikely RLikely RLikely R Tom McClintock (R)
California 7 D+3 Ami Bera (D)51.2% DLikely DSafe DLikely DLean DSafe DSafe D Ami Bera (D)
California 10 EVEN Jeff Denham (R)51.7% RTossupTossupLean D (flip)TossupTossupLikely D (flip) Josh Harder (D)
California 16 D+9 Jim Costa (D)58.0% DLikely DSafe DLikely DSafe DSafe DSafe D Jim Costa (D)
California 21 D+5 David Valadao (R)56.7% RLikely RLikely RLean RLikely RLikely RLikely R TJ Cox (D)
California 22 R+8 Devin Nunes (R)67.6% RLikely RSafe RLikely RLikely RLikely RSafe R Devin Nunes (R)
California 24 D+7 Salud Carbajal (D)53.4% DSafe DSafe DLikely DLikely DSafe DSafe D Salud Carbajal (D)
California 25 EVEN Steve Knight (R)53.1% RTossupTossupLean RTossupTossupLean D (flip) Katie Hill (D)
California 39 EVEN Ed Royce (R) (retiring)57.2% RTossupTossupLean RTossupTossupTossup Gil Cisneros (D)
California 45 R+3 Mimi Walters (R)58.6% RTossupTossupLean D (flip)TossupTossupLean D (flip) Katie Porter (D)
California 48 R+4 Dana Rohrabacher (R)58.3% RTossupTilt D (flip)Lean D (flip)TossupTossupTossup Harley Rouda (D)
California 49 R+1 Darrell Issa (R) (retiring)50.3% RLikely D (flip)Lean D (flip)Likely D (flip)Lean D (flip)Likely D (flip)Safe D (flip) Mike Levin (D)
California 50 R+11 Duncan D. Hunter (R)63.5% RLean RLean RLean RLean RLean RLikely R Duncan D. Hunter (R)
Colorado 3 R+6 Scott Tipton (R)54.6% RLikely RSafe RLean RLikely RLikely RLikely R Scott Tipton (R)
Colorado 6 D+2 Mike Coffman (R)50.9% RLean D (flip)Tilt D (flip)Lean D (flip)Lean D (flip)Lean D (flip)Likely D (flip) Jason Crow (D)
Florida 6 R+7(Vacant) [lower-alpha 4] 58.6% RLean RLean RLean RLikely RLean RLean R Michael Waltz (R)
Florida 7 EVEN Stephanie Murphy (D)51.5% DLikely DLikely DLikely DLean DLikely DLikely D Stephanie Murphy (D)
Florida 13 D+2 Charlie Crist (D)51.9% DSafe DSafe DSafe DLikely DSafe DSafe D Charlie Crist (D)
Florida 15 R+6 Dennis A. Ross (R) (retiring)57.5% RTossupTilt RLean RTossupLean RTossup Ross Spano (R)
Florida 16 R+7 Vern Buchanan (R)59.8% RLean RLikely RLikely RLean RLikely RLikely R Vern Buchanan (R)
Florida 18 R+5 Brian Mast (R)53.6% RLean RLikely RLean RLean RLean RLikely R Brian Mast (R)
Florida 25 R+4 Mario Díaz-Balart (R)62.4% RLean RSafe RLikely RLikely RLikely RLean R Mario Díaz-Balart (R)
Florida 26 D+6 Carlos Curbelo (R)53.0% RTossupTossupLean RTossupTossupTossup Debbie Mucarsel-Powell (D)
Florida 27 D+5 Ileana Ros-Lehtinen (R) (retiring)54.9% RLean D (flip)Lean D (flip)Lean D (flip)TossupLean D (flip)Likely D (flip) Donna Shalala (D)
Georgia 6 R+8 Karen Handel (R)51.8% RTossupLean RLean RTossupLean RTossup Lucy McBath (D)
Georgia 7 R+9 Rob Woodall (R)60.4% RLean RLean RLean RLean RLean RLikely R Rob Woodall (R)
Illinois 6 R+2 Peter Roskam (R)59.2% RLean D (flip)Tilt D (flip)Lean D (flip)TossupTossupTossup Sean Casten (D)
Illinois 12 R+5 Mike Bost (R)54.3% RLean RTilt RLean RLean RLean RLean R Mike Bost (R)
Illinois 13 R+3 Rodney Davis (R)59.7% RLean RLean RLean RLean RLean RLean R Rodney Davis (R)
Illinois 14 R+5 Randy Hultgren (R)59.3% RTossupTossupLean D (flip)TossupTossupLean D (flip) Lauren Underwood (D)
Indiana 2 R+11 Jackie Walorski (R)59.3% RLikely RLikely RLikely RLikely RLikely RSafe R Jackie Walorski (R)
Indiana 9 R+13 Trey Hollingsworth (R)54.1% RSafe RSafe RLikely RSafe RLikely RLikely R Trey Hollingsworth (R)
Iowa 1 D+1 Rod Blum (R)53.7% RLean D (flip)Lean D (flip)Lean D (flip)Lean D (flip)Lean D (flip)Safe D (flip) Abby Finkenauer (D)
Iowa 2 D+1 Dave Loebsack (D)53.7% DSafe DSafe DSafe DLikely DSafe DSafe D Dave Loebsack (D)
Iowa 3 R+1 David Young (R)53.5% RTossupTossupLean D (flip)TossupTossupLean D (flip) Cindy Axne (D)
Iowa 4 R+11 Steve King (R)61.2% RLean RLikely RLean RLean RLikely RLikely R Steve King (R)
Kansas 2 R+10 Lynn Jenkins (R) (retiring)60.9% RTossupTossupLean D (flip)TossupTossupLean D (flip) Steve Watkins (R)
Kansas 3 R+4 Kevin Yoder (R)51.3% RLean D (flip)Lean D (flip)Lean D (flip)Lean D (flip)Lean D (flip)Likely D (flip) Sharice Davids (D)
Kentucky 6 R+9 Andy Barr (R)61.1% RTossupTossupLean RTossupTossupTossup Andy Barr (R)
Maine 2 R+2 Bruce Poliquin (R)54.8% RTossupTossupLean D (flip)TossupTossupLean D (flip) Jared Golden (D)
Michigan 1 R+9 Jack Bergman (R)54.9% RLikely RSafe RLikely RSafe RLikely RLikely R Jack Bergman (R)
Michigan 2 R+9 Bill Huizenga (R)62.6% RSafe RSafe RLikely RSafe RSafe RLikely R Bill Huizenga (R)
Michigan 3 R+6 Justin Amash (R)59.5% RLikely RSafe RLikely RSafe RSafe RSafe R Justin Amash (R)
Michigan 6 R+6 Fred Upton (R)58.7% RLean RLikely RLean RLean RLean RLikely R Fred Upton (R
Michigan 7 R+7 Tim Walberg (R)55.1% RLikely RLikely RLikely RLean RLikely RTossup Tim Walberg (R)
Michigan 8 R+4 Mike Bishop (R)56.0% RTossupTilt D (flip)Lean D (flip)TossupTossupLean D (flip) Elissa Slotkin (D)
Michigan 11 R+4 Dave Trott (R) (retiring)52.9% RLean D (flip)Tilt D (flip)Lean D (flip)TossupLean D (flip)Likely D (flip) Haley Stevens (D)
Minnesota 1 R+5 Tim Walz (D) (retiring)50.3% DTossupTossupLean DTossupTossupTossup Jim Hagedorn (R)
Minnesota 2 R+2 Jason Lewis (R)47.0% RLean D (flip)Tilt D (flip)Lean D (flip)Lean D (flip)TossupLikely D (flip) Angie Craig (D)
Minnesota 3 D+1 Erik Paulsen (R)56.7% RLean D (flip)Tilt D (flip)Lean D (flip)Lean D (flip)TossupLikely D (flip) Dean Phillips (D)
Minnesota 7 R+12 Collin Peterson (D)52.5% DLikely DSafe DLikely DTossupLikely DLikely D Collin Peterson (D)
Minnesota 8 R+4 Rick Nolan (D) (retiring)50.2% DLean R (flip)Lean R (flip)Lean R (flip)Lean R (flip)Lean R (flip)Likely R (flip) Pete Stauber (R)
Missouri 2 R+8 Ann Wagner (R)58.5% RLean RSafe RLikely RLikely RLikely RLikely R Ann Wagner (R)
Montana at-large R+11 Greg Gianforte (R)49.9% RLean RLikely RLean RTossupLean RLikely R Greg Gianforte (R)
Nebraska 2 R+4 Don Bacon (R)48.9% RLean RLean RLean RLean RLikely RTossup Don Bacon (R)
Nevada 3 R+2 Jacky Rosen (D) (retiring)47.2% DLean DTilt DLean DTossupLean DLikely D Susie Lee (D)
Nevada 4 D+3 Ruben Kihuen (D) (retiring)48.5% DLean DLean DLikely DTossupLean DLikely D Steven Horsford (D)
New Hampshire 1 R+2 Carol Shea-Porter (D) (retiring)44.3% DLikely DLean DLikely DTossupLean DLikely D Chris Pappas (D)
New Hampshire 2 D+2 Ann McLane Kuster (D)49.8% DSafe DSafe DSafe DLikely DSafe DSafe D Ann McLane Kuster (D)
New Jersey 2 R+1 Frank LoBiondo (R) (retiring)59.2% RLikely D (flip)Likely D (flip)Safe D (flip)Likely D (flip)Safe D (flip)Safe D (flip) Jeff Van Drew (D)
New Jersey 3 R+2 Tom MacArthur (R)59.3% RTossupTilt D (flip)Lean D (flip)TossupTossupTossup Andy Kim (D)
New Jersey 4 R+8 Chris Smith (R)63.7% RSafe RSafe RSafe RSafe RSafe RLikely R Chris Smith (R)
New Jersey 5 R+3 Josh Gottheimer (D)51.1% DLikely DSafe DLikely DLikely DLikely DSafe D Josh Gottheimer (D)
New Jersey 7 R+3 Leonard Lance (R)54.1% RTossupTossupLean D (flip)Lean D (flip)TossupLikely D (flip) Tom Malinowski (D)
New Jersey 11 R+3 Rodney Frelinghuysen (R) (retiring)58.0% RLean D (flip)Lean D (flip)Lean D (flip)Lean D (flip)Lean D (flip)Likely D (flip) Mikie Sherrill (D)
New Mexico 1 D+7 Michelle Lujan Grisham (D) (retiring)65.1% DSafe DSafe DSafe DLikely DSafe DSafe D Deb Haaland (D)
New Mexico 2 R+6 Steve Pearce (R) (retiring)62.7% RTossupTossupLean D (flip)TossupTossupTossup Xochitl Torres Small (D)
New York 1 R+5 Lee Zeldin (R)58.2% RLikely RSafe RLean RLean RLikely RLikely R Lee Zeldin (R)
New York 2 R+3 Peter King (R)57.2% RLikely RSafe RLikely RLikely RSafe RLean R Peter King (R)
New York 3 D+1 Thomas Suozzi (D)52.4% DSafe DSafe DSafe DLikely DSafe DSafe D Thomas Suozzi (D)
New York 11 R+3 Dan Donovan (R)61.5% RLean RLean RLean RLean RLean RLikely R Max Rose (D)
New York 18 R+1 Sean Patrick Maloney (D)55.6% DSafe DSafe DLikely DLikely DSafe DSafe D Sean Patrick Maloney (D)
New York 19 R+2 John Faso (R)54.0% RTossupTilt D (flip)Lean D (flip)TossupTossupLean D (flip) Antonio Delgado (D)
New York 21 R+4 Elise Stefanik (R)61.6% RLikely RSafe RLikely RSafe RLikely RLikely R Elise Stefanik (R)
New York 22 R+6 Claudia Tenney (R)46.5% RTossupTilt D (flip)Lean D (flip)TossupTossupTossup Anthony Brindisi (D)
New York 23 R+6 Tom Reed (R)57.6% RLikely RSafe RLikely RSafe RLikely RLikely R Tom Reed (R)
New York 24 D+3 John Katko (R)60.5% RLean RLean RLean RLikely RLean RLikely R John Katko (R)
New York 27 R+11 Chris Collins (R)67.2% RLean RLean RLean RLean RLean RLikely R Chris Collins (R)
North Carolina 2 R+7 George Holding (R)56.7% RLean RLean RLean RLean RLean RLikely R George Holding (R)
North Carolina 6 R+9 Mark Walker (R)59.2% RSafe RSafe RSafe RSafe RSafe RLikely R Mark Walker (R)
North Carolina 7 R+9 David Rouzer (R)60.9% RSafe RSafe RSafe RSafe RSafe RLikely R David Rouzer (R)
North Carolina 8 R+8 Richard Hudson (R)58.8% RLikely RSafe RLikely RLikely RSafe RLikely R Richard Hudson (R)
North Carolina 9 R+8 Robert Pittenger (R) (lost renomination)58.2% RTossupTossupLean D (flip)TossupTossupTossup Election voided.
North Carolina 13 R+6 Ted Budd (R)56.1% RTossupTilt RLean RLean RLean RLean R Ted Budd (R)
Ohio 1 R+5 Steve Chabot (R)59.2% RLean RTilt RLean RLean RLean RLikely R Steve Chabot (R)
Ohio 7 R+12 Bob Gibbs (R)64.0% RSafe RSafe RLikely RSafe RLikely RSafe R Bob Gibbs (R)
Ohio 10 R+4 Mike Turner (R)64.1% RLikely RSafe RLikely RLikely RLikely RLikely R Mike Turner (R)
Ohio 12 R+7 Troy Balderson (R)50.1% RTossupTossupLean RLean RLean RLean R Troy Balderson (R)
Ohio 14 R+5 David Joyce (R)62.6% RLikely RLikely RLean RLikely RLikely RLikely R David Joyce (R)
Ohio 15 R+7 Steve Stivers (R)66.2% RSafe RSafe RLikely RSafe RSafe RSafe R Steve Stivers (R)
Ohio 16 R+8 Jim Renacci (R) (retiring) [lower-alpha 3] 65.3% RSafe RSafe RSafe RSafe RSafe RLikely R Anthony Gonzalez (R)
Oklahoma 5 R+10 Steve Russell (R)57.1% RLikely RSafe RLikely RLikely RLikely RLikely R Kendra Horn (D)
Oregon 5 EVEN Kurt Schrader (D)53.6% DSafe DSafe DSafe DLean DSafe DLikely D Kurt Schrader (D)
Pennsylvania 1 R+1 Brian Fitzpatrick (R)TossupTossupLean RTossupTossupTossup Brian Fitzpatrick (R)
Pennsylvania 5 D+13(Vacant) [lower-alpha 5] Likely D (flip)Likely D (flip)Safe D (flip)Likely D (flip)Safe D (flip)Safe D (flip) Mary Gay Scanlon (D)
Pennsylvania 6 D+2 Ryan Costello (R) (retiring)Likely D (flip)Likely D (flip)Safe D (flip)Likely D (flip)Safe D (flip)Safe D (flip) Chrissy Houlahan (D)
Pennsylvania 7 D+1(Vacant) [lower-alpha 6] Lean D (flip)Lean D (flip)Lean D (flip)Lean D (flip)Lean D (flip)Safe D (flip) Susan Wild (D)
Pennsylvania 8 R+1 Matt Cartwright (D)Likely DLean DLikely DLikely DLikely DSafe D Matt Cartwright (D)
Pennsylvania 10 R+6 Scott Perry (R)TossupLean RLean RTossupLean RLean R Scott Perry (R)
Pennsylvania 11 R+14 Lloyd Smucker (R)Safe RSafe RSafe RSafe RSafe RLikely R Lloyd Smucker (R)
Pennsylvania 14 R+14 Conor Lamb (D) (running in 17th district)Likely R (flip)Likely R (flip)Safe R (flip)Likely R (flip)Safe R (flip)Safe R (flip) Guy Reschenthaler (R)
Pennsylvania 16 R+8 Mike Kelly (R)Lean RLikely RLean RTossupLean RLikely R Mike Kelly (R)
Pennsylvania 17 R+3 Keith Rothfus (R)Likely D (flip)Lean D (flip)Likely D (flip)Likely D (flip)Likely D (flip)Safe D (flip) Conor Lamb (D)
South Carolina 1 R+10 Mark Sanford (R) (lost renomination)58.6% RLean RLikely RLean RLean RLean RLikely R Joe Cunningham (D)
Texas 2 R+11 Ted Poe (R) (retiring)60.6% RLikely RSafe RLikely RSafe RLikely RLikely R Dan Crenshaw (R)
Texas 6 R+9 Joe Barton (R) (retiring)58.3% RLikely RSafe RLikely RSafe RSafe RLikely R Ron Wright (R)
Texas 7 R+7 John Culberson (R)56.2% RTossupTilt RLean RTossupTossupTossup Lizzie Fletcher (D)
Texas 10 R+9 Michael McCaul (R)57.3% RLikely RSafe RSafe RSafe RSafe RLikely R Michael McCaul (R)
Texas 21 R+10 Lamar Smith (R) (retiring)57.0% RLikely RLikely RLikely RLikely RLikely RLikely R Chip Roy (R)
Texas 22 R+10 Pete Olson (R)59.5% RLean RSafe RLikely RLikely RSafe RLikely R Pete Olson (R)
Texas 23 R+1 Will Hurd (R)48.3% RLean RLean RLean RLean RLean RLikely R Will Hurd (R)
Texas 24 R+9 Kenny Marchant (R)56.2% RLikely RSafe RSafe RSafe RSafe RSafe R Kenny Marchant (R)
Texas 25 R+11 Roger Williams (R)58.3% RSafe RSafe RSafe RSafe RSafe RLikely R Roger Williams (R)
Texas 31 R+10 John Carter (R)58.4% RLikely RLikely RLikely RSafe RLikely RLikely R John Carter (R)
Texas 32 R+5 Pete Sessions (R)71.1% RTossupTossupLean D (flip)TossupTossupLean R Colin Allred (D)
Utah 4 R+13 Mia Love (R)53.8% RTossupTossupLean D (flip)TossupTossupLean D (flip) Ben McAdams (D)
Virginia 2 R+3 Scott Taylor (R)61.3% RTossupTilt RLean D (flip)Lean RTossupLean R Elaine Luria (D)
Virginia 5 R+6 Tom Garrett (R) (retiring)58.2% RLean RLikely RLean RTossupLean RTossup Denver Riggleman (R)
Virginia 7 R+6 Dave Brat (R)57.5% RTossupTossupLean D (flip)TossupTossupTossup Abigail Spanberger (D)
Virginia 10 D+1 Barbara Comstock (R)52.7% RLean D (flip)Tilt D (flip)Lean D (flip)Lean D (flip)Lean D (flip)Likely D (flip) Jennifer Wexton (D)
Washington 3 R+4 Jaime Herrera Beutler (R)61.8% RLean RLikely RLean RLean RLean RLean R Jaime Herrera Beutler (R)
Washington 5 R+8 Cathy McMorris Rodgers (R)59.6% RLean RLikely RLean RLean RLean RLikely R Cathy McMorris Rodgers (R)
Washington 8 EVEN Dave Reichert (R) (retiring)60.2% RLean D (flip)TossupLean D (flip)TossupTossupLean D (flip) Kim Schrier (D)
West Virginia 2 R+17 Alex Mooney (R)58.2% RLikely RSafe RSafe RSafe RSafe RLikely R Alex Mooney (R)
West Virginia 3 R+23(Vacant) [lower-alpha 7] 67.9% RLean RLean RLean RLean RLean RLikely R Carol Miller (R)
Wisconsin 1 R+5 Paul Ryan (R) (retiring)65.0% RLean RLean RLean RLean RLean RLikely R Bryan Steil (R)
Wisconsin 3 EVEN Ron Kind (D)98.9% DSafe DSafe DSafe DLikely DSafe DSafe D Ron Kind (D)
Wisconsin 6 R+8 Glenn Grothman (R)57.2% RLikely RSafe RLikely RSafe RLikely RSafe R Glenn Grothman (R)
Overall D - 210
R - 194
30 tossups
D - 214
R - 202
19 tossups
D - 228
R - 207
0 tossups
D - 203
R - 194
38 tossups
D - 206
R - 199
30 tossups
D - 220
R - 197
18 tossups
D - 235
R - 199
1 voided

Generic ballot polls

The following is a list of generic party ballot polls conducted in advance of the 2018 House of Representatives elections.

Polling aggregates
Source of poll aggregationDate updatedDates polledDemocraticRepublicanLead
FiveThirtyEight Nov 6, 2018Until Nov 5, 201850.7%42.0%+8.7%
RealClearPolitics Nov 6, 2018Oct 13, 2018 - Nov 3, 201849.7%42.4%+7.3%
Average50.2%42.2%+8.0%

Notes

  1. Not including the Resident Commissioner of Puerto Rico, who serves a four-year term.
  2. Reflects the "Classic" version of the forecast model.
  3. 1 2 3 Retired to run for senate
  4. Ron DeSantis resigned in September 2018, seat remained vacant until the start of the next Congress
  5. Pat Meehan (R) resigned in April, Mary Gay Scanlon (D) won a simultaneous special election to fill the remainder of Meehan's term.
  6. Charlie Dent (R) resigned in May, Susan Wild (D) won a simultaneous special election to fill the remainder of Dent's term.
  7. Evan Jenkins resigned in September 2018, seat remained vacant until the start of the next Congress

Related Research Articles

<span class="mw-page-title-main">Charlie Dent</span> American politician (born 1960)

Charles Wieder Dent is an American politician who served as a Republican member of the United States House of Representatives for Pennsylvania's 15th congressional district from 2005 to 2018.

<span class="mw-page-title-main">2008 United States House of Representatives election in Alaska</span>

The 2008 United States House of Representatives election in Alaska was held on November 4, 2008, to determine who will represent the state of Alaska in the United States House of Representatives. Alaska has one seat in the House, apportioned according to the 2000 United States census. Representatives are elected for two-year terms; whoever was elected would serve in the 111th Congress from January 4, 2009, until January 3, 2011. The election coincided with the nationwide presidential election. The primary election was held August 26, 2008.

<span class="mw-page-title-main">2008 United States House of Representatives elections in Arizona</span>

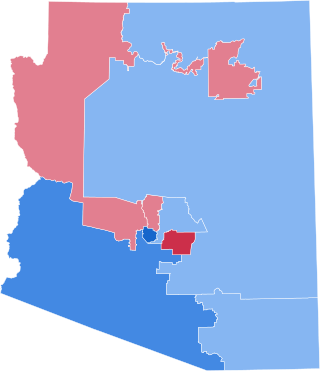
The 2008 congressional elections in Arizona were held on November 4, 2008, to determine who would represent the state of Arizona in the United States House of Representatives, coinciding with the presidential election. Representatives are elected for two-year terms; those elected would serve in the 111th Congress from January 4, 2009, until January 3, 2011.

<span class="mw-page-title-main">2010 United States elections</span>

The 2010 United States elections were held on Tuesday, November 2, 2010, in the middle of Democratic President Barack Obama's first term. Republicans ended unified Democratic control of Congress and the presidency by winning a majority in the House of Representatives and gained seats in the Senate despite Democrats holding Senate control.

<span class="mw-page-title-main">2008 United States House of Representatives elections in New Mexico</span>

The 2008 congressional elections in New Mexico were held on November 4, 2008 to determine New Mexico's representation in the United States House of Representatives. The party primary elections were held June 3, 2008. Martin Heinrich, Harry Teague, and Ben Ray Luján, all Democrats, were elected to represent New Mexico in the House. Representatives are elected for two-year terms; the winners of the election currently serve in the 111th Congress, which began on January 4, 2009 and is scheduled to end on January 3, 2011. The election coincided with the 2008 U.S. presidential election and senatorial elections.

<span class="mw-page-title-main">2018 United States Senate elections</span>

The 2018 United States Senate elections were held on November 6, 2018. Among the 100 seats, the 33 of Class 1 were contested in regular elections while 2 others were contested in special elections due to Senate vacancies in Minnesota and Mississippi. The regular election winners were elected to 6-year terms running from January 3, 2019, to January 3, 2025. Senate Democrats had 26 seats up for election, while Senate Republicans had 9 seats up for election.

<span class="mw-page-title-main">2018 United States House of Representatives elections</span> House elections for the 116th U.S. Congress

The 2018 United States House of Representatives elections were held on November 6, 2018, as part of the 2018 midterm elections during President Donald Trump's term, with early voting taking place in some states in the weeks preceding that date. Voters chose representatives from all 435 congressional districts across each of the 50 U.S. states to serve in the 116th United States Congress. Non-voting delegates from the District of Columbia and four of the five inhabited U.S. territories were also elected. On Election Day, Republicans had held a House majority since January 2011.

<span class="mw-page-title-main">2020 United States House of Representatives elections in Rhode Island</span>

The 2020 United States House of Representatives elections in Rhode Island was held on November 3, 2020 to elect the two U.S. representatives from the state of Rhode Island, one from each of the state's 2 congressional districts. The elections will coincide with the 2020 U.S. presidential election, as well as other elections to the House of Representatives, elections to the United States Senate and various state and local elections.

<span class="mw-page-title-main">2020 United States House of Representatives election in Delaware</span> U.S. election in Delaware

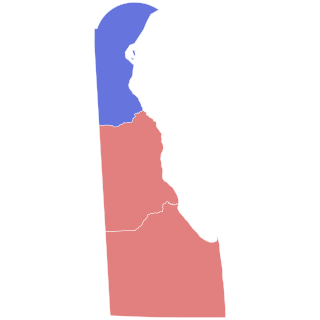
The 2020 United States House of Representatives election in Delaware was held on November 3, 2020, to elect the U.S. representative from Delaware's at-large congressional district. The election coincided with the 2020 U.S. presidential election, as well as other elections to the House of Representatives, elections to the United States Senate and various state and local elections. The Democratic and Republican primaries was held on September 15, 2020.

<span class="mw-page-title-main">2020 United States House of Representatives elections in Arkansas</span> Elections

The 2020 United States House of Representatives elections in Arkansas were held on November 3, 2020, to elect the four U.S. representatives from the state of Arkansas, one from each of the state's four congressional districts. The elections coincided with the 2020 U.S. presidential election, as well as other elections to the House of Representatives, elections to the United States Senate, and various state and local elections.

<span class="mw-page-title-main">2020 United States House of Representatives elections in Connecticut</span>

The 2020 United States House of Representatives elections in Connecticut was held on November 3, 2020, to elect the five U.S. representatives from the state of Connecticut, one from each of the state's five congressional districts. The elections coincided with the 2020 U.S. presidential election, as well as other elections to the House of Representatives, elections to the United States Senate and various state and local elections.

The 2020 United States House of Representatives elections were held November 3, 2020, to elect representatives from all 435 congressional districts across each of the 50 U.S. states. The six non-voting delegates from the District of Columbia and the inhabited U.S. territories were also elected. Numerous federal, state, and local elections, including the 2020 presidential election and the 2020 Senate elections, were also held on this date.

<span class="mw-page-title-main">2022 United States House of Representatives elections in Mississippi</span>

The 2022 United States House of Representatives elections in Mississippi were held on November 8, 2022, to elect the four U.S. representatives from the state of Mississippi, one from each of the state's four congressional districts. The elections coincided with other elections to the House of Representatives, elections to the United States Senate and various state and local elections.

<span class="mw-page-title-main">2022 United States House of Representatives elections in New Mexico</span>

The 2022 United States House of Representatives elections in New Mexico were held on November 8, 2022, to elect the three U.S. representatives from the state of New Mexico, one from each of the state's three congressional districts. The elections coincided with the New Mexico gubernatorial election and various state and local elections. The Democratic party gained the 2nd Congressional seat, gaining unitary control of New Mexico's Congressional delegation for the first time since 2018 and improving the advantage in the House delegation for New Mexico from 2–1 in favor of Democrats to 3–0.

<span class="mw-page-title-main">2022 United States House of Representatives election in Delaware</span> Election in Delaware

The 2022 United States House of Representatives election in Delaware was held on November 8, 2022, to elect the U.S. representative from Delaware's at-large congressional district. The election coincided with other elections to the House of Representatives, elections to the United States Senate and various state and local elections. The incumbent Democrat Lisa Blunt Rochester won re-election to a fourth term.

The 2016 United States House of Representatives elections were held November 8, 2016, to elect representatives from all 435 congressional districts across each of the 50 U.S. states. The six non-voting delegates from the District of Columbia and the inhabited U.S. territories were also elected. Numerous federal, state, and local elections, including the 2016 presidential election and the 2016 Senate elections, were also held on this date.

<span class="mw-page-title-main">2014 United States House of Representatives election ratings</span> Predictions for select races in the 2014 U.S. House elections

The 2014 United States House of Representatives elections were held on November 4, 2014, with early voting taking place in some states in the weeks preceding that date. Voters chose representatives from all 435 congressional districts across each of the 50 U.S. states. Non-voting delegates from the District of Columbia and four of the five inhabited U.S. territories were also elected. These midterm elections took place nearly halfway through the second term of Democratic President Barack Obama. The winners served in the 114th United States Congress, with seats apportioned among the states based on the 2010 United States census. On Election Day, Republicans had held a House majority since January 2011 as a result of the 2010 elections.

The 2012 United States House of Representatives elections were held November 6, 2012, to elect representatives from all 435 congressional districts across each of the 50 U.S. states. The six non-voting delegates from the District of Columbia and the inhabited U.S. territories will also be elected. Numerous federal, state, and local elections, including the 2012 presidential election and the 2012 Senate elections, were also held on this date.

The 2010 United States House of Representatives elections were held on November 2, 2010, with early voting taking place in some states in the weeks preceding that date. Voters chose representatives from all 435 congressional districts across each of the 50 U.S. states. Non-voting delegates from the District of Columbia and four of the five inhabited U.S. territories were also elected. These midterm elections took place nearly halfway through the first term of Democratic President Barack Obama. The winners served in the 112th United States Congress, with seats apportioned among the states based on the 2000 United States census. On Election Day, Democrats had held a House majority since January 2007 as a result of the 2006 elections.

The 2022 United States House of Representatives elections were held November 8, 2022, to elect representatives from all 435 congressional districts across each of the 50 U.S. states. Five of the six non-voting delegates from the District of Columbia and the inhabited U.S. territories were also elected. Numerous federal, state, and local elections, including the 2022 U.S. Senate elections, were also held on this date.

References

  1. Wasserman, David; Flinn, Ally (April 11, 2018). "Introducing the 2017 Cook Political Report Partisan Voter Index". Cook Political Report. Retrieved April 11, 2018.
  2. Wasserman, David (April 11, 2018). "New Pennsylvania Map Is a Major Boost for Democrats". Cook Political Report. Retrieved April 11, 2018.
  3. "2016 House Election Results". Politico. December 13, 2016. Retrieved February 14, 2017.
  4. "2018 House Race Ratings". Cook Political Report. Retrieved October 30, 2018.
  5. "2018 House Ratings". The Rothenberg Political Report. Retrieved November 5, 2018.
  6. "2018 House". Sabato's Crystal Ball . Retrieved November 5, 2018.
  7. "Battle for the House 2018". RCP. Retrieved November 5, 2018.
  8. "Daily Kos Elections 2018 race ratings". Daily Kos . Retrieved November 5, 2018.[ permanent dead link ]
  9. Silver, Nate (August 16, 2018). "2018 House Forecast". FiveThirtyEight . Retrieved November 6, 2018.
  10. "House Election Results: Democrats Take Control". The New York Times. November 7, 2018. Retrieved November 7, 2018.