| ||||||||||||||||||||||||||||||||||
All 35 seats in the Alabama Senate 18 seats needed for a majority | ||||||||||||||||||||||||||||||||||
---|---|---|---|---|---|---|---|---|---|---|---|---|---|---|---|---|---|---|---|---|---|---|---|---|---|---|---|---|---|---|---|---|---|---|
| ||||||||||||||||||||||||||||||||||
Results: Republican gain Republican hold Democratic hold | ||||||||||||||||||||||||||||||||||
|
Elections in Alabama |
---|
Government |
The 2018 Alabama Senate elections took place on November 3, 2018, as part of the 2018 United States elections. Alabama voters elected state senators in all 35 of the state's Senate districts. State senators serve four-year terms in the Alabama Senate. [1]
A primary election on June 5, 2018, and a runoff election on July 17, 2018, determined which candidates appear on the November 6 general election ballot. Primary election results can be obtained from the Alabama Secretary of State's website. [2]
Following the 2014 state Senate elections, Republicans maintained effective control of the House with a 27-seat majority—26 Republican members and 1 independent who caucuses with the Republicans. Democrats hold 8 seats following the 2014 elections.
To claim control of the chamber from Republicans, the Democrats would have needed to gain 10 Senate seats.
The election resulted in the Republican Party holding all previously held seats and taking a seat previously held by an independent who caucused with the Republicans, leading to no effective shift in control of the chamber. The Republicans also gained slightly in the popular vote compared to the 2014 elections.
District | Winner | Margin |
---|---|---|
District 2 | Republican | 8.986% |
District 6 | Republican | 1.988% |
District 7 | Republican | 10.485% |
District 27 | Republican | 18.171% |
District 1 • District 2 • District 3 • District 4 • District 5 • District 6 • District 7 • District 8 • District 9 • District 10 • District 11 • District 12 • District 13 • District 14 • District 15 • District 16 • District 17 • District 18 • District 19 • District 20 • District 21 • District 22 • District 23 • District 24 • District 25 • District 26 • District 27 • District 28 • District 29 • District 30 • District 31 • District 32 • District 33 • District 34 • District 35 |
Party | Candidate | Votes | % | |
---|---|---|---|---|
Republican | Tim Melson (incumbent) | 33,141 | 67.643 | |
Democratic | Caroline Self | 15,830 | 32.310 | |
Independent | Write-in | 23 | 0.047 | |
Total votes | 48,994 | 100.0 | ||
Republican hold | ||||
Party | Candidate | Votes | % | |
---|---|---|---|---|
Republican | Tom Butler | 31,997 | 54.627 | |
Democratic | Amy Wasyluka | 26,911 | 45.641 | |
Independent | Write-in | 54 | 0.091 | |
Total votes | 58,962 | 100.0 | ||
Republican hold | ||||
Party | Candidate | Votes | % | |
---|---|---|---|---|
Republican | Arthur Orr (incumbent) | 37,295 | 97.335 | |
Independent | Write-in | 1,021 | 2.665 | |
Total votes | 38,316 | 100.0 | ||
Republican hold | ||||
Party | Candidate | Votes | % | |
---|---|---|---|---|
Republican | Garlan Gudger | 39,817 | 99.146 | |
Independent | Write-in | 343 | 0.854 | |
Total votes | 40,160 | 100.0 | ||
Republican hold | ||||
Party | Candidate | Votes | % | |
---|---|---|---|---|
Republican | Greg Reed (incumbent) | 42,404 | 98.842 | |
Independent | Write-in | 497 | 1.158 | |
Total votes | 42,901 | 100.0 | ||
Republican hold | ||||
Party | Candidate | Votes | % | |
---|---|---|---|---|
Republican | Larry Stutts (incumbent) | 22,683 | 50.834 | |
Democratic | Johnny Mack Morrow | 21,796 | 48.846 | |
Independent | Write-in | 143 | 0.320 | |
Total votes | 44,622 | 100.0 | ||
Republican hold | ||||
Party | Candidate | Votes | % | |
---|---|---|---|---|
Republican | Sam Givhan | 30,080 | 55.217 | |
Democratic | Deborah Barros | 24,363 | 44.722 | |
Independent | Write-in | 33 | 0.061 | |
Total votes | 54,476 | 100.0 | ||
Republican hold | ||||
Party | Candidate | Votes | % | |
---|---|---|---|---|
Republican | Steve Livingston (incumbent) | 37,913 | 98.327 | |
Independent | Write-in | 645 | 1.673 | |
Total votes | 38,558 | 100.0 | ||
Republican hold | ||||
Party | Candidate | Votes | % | |
---|---|---|---|---|
Republican | Clay Scofield (incumbent) | 35,192 | 98.572 | |
Independent | Write-in | 510 | 1.428 | |
Total votes | 35,702 | 100.0 | ||
Republican hold | ||||
Party | Candidate | Votes | % | |
---|---|---|---|---|
Republican | Andrew Jones | 25,902 | 60.601 | |
Independent | Craig Ford [lower-alpha 3] | 16,759 | 39.210 | |
Independent | Write-in | 81 | 0.190 | |
Total votes | 42,742 | 100.0 | ||
Republican hold | ||||
Party | Candidate | Votes | % | |
---|---|---|---|---|
Republican | Jim McClendon (incumbent) | 36,192 | 75.970 | |
Democratic | Carl Carter | 11,411 | 23.953 | |
Independent | Write-in | 37 | 0.078 | |
Total votes | 47,640 | 100.0 | ||
Republican hold | ||||
Party | Candidate | Votes | % | |
---|---|---|---|---|
Republican | Del Marsh (incumbent) | 27,416 | 64.501 | |
Democratic | Jim Williams | 15,010 | 35.313 | |
Independent | Write-in | 79 | 0.186 | |
Total votes | 42,505 | 100.0 | ||
Republican hold | ||||
Party | Candidate | Votes | % | |
---|---|---|---|---|
Republican | Randy Price | 31,614 | 71.065 | |
Democratic | Darrell Turner | 12,839 | 28.861 | |
Independent | Write-in | 33 | 0.074 | |
Total votes | 44,486 | 100.0 | ||
Republican hold | ||||
Party | Candidate | Votes | % | |
---|---|---|---|---|
Republican | Cam Ward (incumbent) | 34,957 | 72.572 | |
Democratic | Jerry McDonald | 13,173 | 27.347 | |
Write-in | 39 | 0.081 | ||
Total votes | 48,169 | 100.0 | ||
Republican hold | ||||
Party | Candidate | Votes | % | |
---|---|---|---|---|
Republican | Dan Roberts | 44,792 | 97.421 | |
Democratic | Laura Casey (withdrawn) | |||
Independent | Write-in | 1,186 | 2.579 | |
Total votes | 45,978 | 100.0 | ||
Republican hold | ||||
Party | Candidate | Votes | % | |
---|---|---|---|---|
Republican | Jabo Waggoner (incumbent) | 37,068 | 62.880 | |
Democratic | Lindsey Deckard | 21,851 | 37.066 | |
Independent | Write-in | 32 | 0.054 | |
Total votes | 58,951 | 100.0 | ||
Republican hold | ||||
Party | Candidate | Votes | % | |
---|---|---|---|---|
Republican | Shay Shelnutt (incumbent) | 45,964 | 98.306 | |
Write-in | 792 | 1.694 | ||
Total votes | 46,756 | 100.0 | ||
Republican hold | ||||
Party | Candidate | Votes | % | |
---|---|---|---|---|
Democratic | Rodger Smitherman (incumbent) | 39,819 | 98.350 | |
Independent | Write-in | 668 | 1.650 | |
Total votes | 40,487 | 100.0 | ||
Democratic hold | ||||
Party | Candidate | Votes | % | |
---|---|---|---|---|
Democratic | Priscilla Dunn (incumbent) | 38,668 | 98.184 | |
Independent | Write-in | 715 | 1.816 | |
Total votes | 39,383 | 100.0 | ||
Democratic hold | ||||
Party | Candidate | Votes | % | |
---|---|---|---|---|
Democratic | Linda Coleman-Madison (incumbent) | 36,478 | 98.345 | |
Independent | Write-in | 614 | 1.655 | |
Total votes | 37,092 | 100.0 | ||
Democratic hold | ||||
Party | Candidate | Votes | % | |
---|---|---|---|---|
Republican | Gerald Allen (incumbent) | 33,368 | 67.512 | |
Democratic | Rick Burnham | 16,005 | 32.382 | |
Independent | Write-in | 52 | 0.105 | |
Total votes | 49,425 | 100.0 | ||
Republican hold | ||||
Party | Candidate | Votes | % | |
---|---|---|---|---|
Republican | Greg Albritton (incumbent) | 34,507 | 98.544 | |
Independent | Write-in | 510 | 1.456 | |
Total votes | 35,017 | 100.0 | ||
Republican hold | ||||
Party | Candidate | Votes | % | |
---|---|---|---|---|
Democratic | Malika Sanders-Fortier | 30,193 | 65.527 | |
Independent | Mark Story | 15,796 | 34.282 | |
Independent | Write-in | 88 | 0.191 | |
Total votes | 46,077 | 100.0 | ||
Democratic hold | ||||
Party | Candidate | Votes | % | |
---|---|---|---|---|
Democratic | Bobby Singleton (incumbent) | 37,394 | 98.488 | |
Independent | Write-in | 574 | 1.512 | |
Total votes | 37,968 | 100.0 | ||
Democratic hold | ||||
Party | Candidate | Votes | % | |
---|---|---|---|---|
Republican | Will Barfoot | 33,029 | 61.252 | |
Democratic | David Sadler | 20,866 | 38.696 | |
Independent | Write-in | 28 | 0.052 | |
Total votes | 53,923 | 100.0 | ||
Republican hold | ||||
Party | Candidate | Votes | % | |
---|---|---|---|---|
Democratic | David Burkette (incumbent) | 31,973 | 80.171 | |
Republican | D.J. Johnson | 7,863 | 19.716 | |
Independent | Write-in | 45 | 0.113 | |
Total votes | 39,881 | 100.0 | ||
Democratic hold | ||||
Party | Candidate | Votes | % | |
---|---|---|---|---|
Republican | Tom Whatley (incumbent) | 29,741 | 59.036 | |
Democratic | Nancy Carlton Bendinger | 20,587 | 40.865 | |
Independent | Write-in | 50 | 0.099 | |
Total votes | 50,378 | 100.0 | ||
Republican hold | ||||
Party | Candidate | Votes | % | |
---|---|---|---|---|
Democratic | Billy Beasley (incumbent) | 28,445 | 97.471 | |
Independent | Write-in | 738 | 2.529 | |
Total votes | 29,183 | 100.0 | ||
Democratic hold | ||||
Party | Candidate | Votes | % | |
---|---|---|---|---|
Republican | Donnie Chesteen | 34,273 | 93.222 | |
Independent | Write-in | 2,492 | 6.778 | |
Total votes | 36,765 | 100.0 | ||
Republican hold | ||||
Party | Candidate | Votes | % | |
---|---|---|---|---|
Republican | Clyde Chambliss, Jr. (incumbent) | 35,259 | 98.105 | |
Independent | Write-in | 681 | 1.895 | |
Total votes | 35,940 | 100.0 | ||
Republican hold | ||||
Party | Candidate | Votes | % | |
---|---|---|---|---|
Republican | Jimmy Holley (incumbent) | 33,137 | 98.484 | |
Independent | Write-in | 510 | 1.516 | |
Total votes | 33,647 | 100.0 | ||
Republican hold | ||||
Party | Candidate | Votes | % | |
---|---|---|---|---|
Republican | Chris Elliott | 45,726 | 74.955 | |
Democratic | Jason Fisher | 15,193 | 24.905 | |
Independent | Write-in | 86 | 0.141 | |
Total votes | 61,005 | 100.0 | ||
Republican hold | ||||
Party | Candidate | Votes | % | |
---|---|---|---|---|
Democratic | Vivian Davis Figures (incumbent) | 34,995 | 98.605 | |
Independent | Write-in | 495 | 1.395 | |
Total votes | 35,490 | 100.0 | ||
Democratic hold | ||||
Party | Candidate | Votes | % | |
---|---|---|---|---|
Republican | Jack Williams | 35,093 | 97.758 | |
Independent | Write-in | 805 | 2.242 | |
Total votes | 35,898 | 100.0 | ||
Republican hold | ||||
Party | Candidate | Votes | % | |
---|---|---|---|---|
Republican | David Sessions | 29,046 | 67.582 | |
Democratic | Tom Holmes | 13,896 | 32.332 | |
Independent | Write-in | 37 | 0.086 | |
Total votes | 42,979 | 100.0 | ||
Republican hold | ||||
In U.S. politics, an independent Democrat is an individual who loosely identifies with the ideals of the Democratic Party but chooses not to be a formal member of the party or is denied the Democratic nomination in a caucus or primary election. Independent Democrat is not a political party. Several elected officials, including members of Congress, have identified as independent Democrats.
The 2010 United States elections were held on Tuesday, November 2, 2010, in the middle of Democratic President Barack Obama's first term. Republicans ended unified Democratic control of Congress and the presidency by winning a majority in the House of Representatives and gained seats in the Senate despite Democrats holding Senate control.
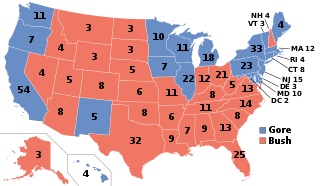
The 2000 United States elections were held on November 7, 2000. Republican Governor George W. Bush of Texas defeated Democratic Vice President Al Gore of Tennessee in the presidential election. Republicans retained control of both houses of Congress, giving the party unified control of Congress and the presidency for the first time since the 1954 elections.
The 2012 United States elections took place on November 6, 2012. Democratic President Barack Obama won reelection to a second term and the Democrats gained seats in both chambers of Congress, retaining control of the Senate even though the Republican Party retained control of the House of Representatives. As of 2024, this is the most recent election cycle in which neither the presidency nor a chamber of Congress changed partisan control, and the last time that the party that won the presidency simultaneously gained seats in both the House of Representatives and the Senate.
The 2018 United States Senate elections were held on November 6, 2018. Among the 100 seats, the 33 of Class 1 were contested in regular elections while 2 others were contested in special elections due to Senate vacancies in Minnesota and Mississippi. The regular election winners were elected to 6-year terms running from January 3, 2019, to January 3, 2025. Senate Democrats had 26 seats up for election, while Senate Republicans had 9 seats up for election.
The 2016 United States elections were held on Tuesday, November 8, 2016. Republican nominee Donald Trump defeated Democratic former Secretary of State Hillary Clinton in the presidential election, while Republicans retained control of Congress. This marked the first and most recent time Republicans won or held unified control of the presidency and Congress since 2004.
A general election was held in the U.S. state of Alabama on November 6, 2018. All Alabama executive officers were up for election along with all of Alabama's seven seats in the United States House of Representatives. Primary elections took place on June 5, 2018, for both major parties.
The 2018 Georgia State Senate elections took place as part of the biennial United States elections. Georgia voters elected state senators in all 56 of the state senate's districts. State senators serve two-year terms in the Georgia State Senate.
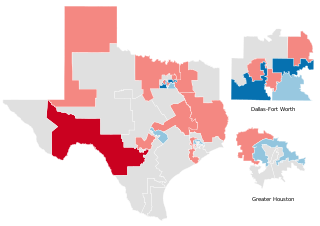
The 2018 Texas Senate elections took place as part of the biennial United States elections. Texas voters elected state senators in 15 of the state senate's 31 districts. The winners of this election served in the 86th Texas Legislature. State senators serve four-year terms in the Texas State Senate. A statewide map of Texas's state Senate districts can be obtained from the Texas Legislative Council here, and individual district maps can be obtained from the U.S. Census here.
The 2018 Hawaii Senate elections took place as part of the biennial United States elections. Hawaii voters elected state senators in 13 of the state senate's 25 districts. State senators serve four-year terms in the Hawaii Senate.
The 2018 Vermont Senate election took place as part of the biennial United States elections. Vermont voters elected State Senators in all 30 seats. State senators serve two-year terms in the Vermont Senate. A primary election on August 14, 2018, determined which candidates appeared on the November 6 general election ballot.
The 2018 Maine State Senate elections took place as part of the biennial United States elections. Maine voters elected state senators in all 35 of the state senate's districts. State senators serve two-year terms in the State Senate.
The 2018 Colorado State Senate elections took place as part of the biennial United States elections. Colorado voters elected state senators in 17 of the 35 districts in the state senate. State senators serve four-year terms in the Colorado State Senate. The Colorado Reapportionment Commission provides a statewide map of the state Senate here, and individual district maps are available from the U.S. Census here.
The 2018 Nebraska State Legislature elections took place as part of the biennial United States elections. Nebraska voters elected state senators in the 24 even-numbered seats of the 49 legislative districts in the Nebraska Unicameral. Nebraska is unique among American| states in that there is only one chamber in its state legislature, and this chamber is called the Unicameral and the State Legislature interchangeably. State senators serve four-year terms in the Nebraska Unicameral.
The 2018 Alabama House of Representatives elections were held on November 6, 2018, as part of the biennial United States elections. All 105 of Alabama's state representatives were up for reelection. In Alabama, members of both the House of Representatives and the Senate serve four year terms, running in years corresponding with presidential midterm elections.
The 2018 Nevada Senate election took place as part of the biennial United States elections. Nevada voters elected state senators in 11 of the state senate's 21 districts. State senators serve four-year terms in the Nevada State Senate.
The 2018 United States state legislative elections were held on November 6, 2018, for 87 state legislative chambers in 46 states. Across the fifty states, approximately 56 percent of all upper house seats and 92 percent of all lower house seats were up for election. Additionally, six territorial chambers in four territories and the District of Columbia were up as well.
The 2016 Vermont Senate election took place as part of the biennial United States elections. Vermont voters elected State Senators in all 30 seats. State senators serve two-year terms in the Vermont Senate. The election coincided with elections for other offices including the Presidency, U.S. Senate, U.S. House, Governor, and State House. A primary election held on August 9, 2016 determined which candidates appeared on the November 6 general election ballot.
The 2014 Vermont Senate election took place as part of the biennial United States elections. Vermont voters elected State Senators in all 30 seats. State senators serve two-year terms in the Vermont Senate. The election coincided with elections for other offices including the U.S. House, Governor, and State House. A primary election held on August 26, 2014 determined which candidates appeared on the November 4 general election ballot.
Elections to state legislatures were held in 46 U.S. states in 2014 with a total of 6,049 seats up for election. Six territorial chambers were up in four territories and the District of Columbia.