Energy policy of China

Last updated

Most energy comes from coal China-energy-consumption-by-source.svg
Most energy comes from coal
Development of carbon dioxide emissions CO2 emissions of China.svg
Development of carbon dioxide emissions
The 22,500 MW Three Gorges Dam hydroelectric power plant in China, the largest hydroelectric power station in the world. ThreeGorgesDam-China2009.jpg
The 22,500 MW Three Gorges Dam hydroelectric power plant in China, the largest hydroelectric power station in the world.

China is both the world's largest energy consumer and the largest industrial country, and ensuring adequate energy supply to sustain economic growth has been a core concern of the Chinese Government since the founding of the People's Republic of China in 1949. [1] Since the country's industrialization in the 1960s, China is currently the world's largest emitter of greenhouse gases, and coal in China is a major cause of global warming. [2] However, from 2010 to 2015 China reduced energy consumption per unit of GDP by 18%, and CO2 emissions per unit of GDP by 20%. [3] On a per-capita basis, China was only the world's 51st largest emitter of greenhouse gases in 2016. [4] China is also the world's largest renewable energy producer (see this article), [5] and the largest producer of hydroelectricity, solar power and wind power in the world. The energy policy of China is connected to its industrial policy, where the goals of China's industrial production dictate its energy demand managements. [6]    

Contents

Being a country that depends heavily on foreign petroleum import for both domestic consumption and as raw materials for light industry manufacturing, electrification is a huge component of the Chinese national energy policy. Details for the power sector are likely to be released winter 2021/22 for the 14th five-year plan, [7] and this is expected to determine whether the country builds more coal-fired power stations, and therefore whether global climate targets are likely to be met. [8]

Summary

Growth in Chinese GDP and energy use since 1983 20180724 - PRC - Chinese GDP and energy consumption 2015 (43568277842).png
Growth in Chinese GDP and energy use since 1983
Energy in China [9]
Population
(million)
Primary energy
TWh
Production
TWh
Import
TWh
Electricity
TWh
CO2 emissions
Mt
20041,29618,71717,8731,0512,0554,732
20071,32022,74621,0971,9393,0736,028
20081,32624,61423,1822,1483,2526,508
20091,33126,25024,2483,1973,5036,832
20101,33828,11125,6903,9053,9387,270
Change 2004–103.3%50%44%272%92%54%
Mtoe = 11.63 TWh, excludes Hong Kong.

Environment and carbon emissions

CO2 emission per year per country (2017 data) Annual CO2 emissions, OWID.svg
CO2 emission per year per country (2017 data)
Consumption-based CO2 emission per capita per year per country (2016 data) Consumption-based CO2 emissions per capita, OWID.svg
Consumption-based CO2 emission per capita per year per country (2016 data)

Between 1980 and 2000, China's emissions density (its ratio of carbon dioxide equivalent emissions to gross domestic product) declined sharply. [10] :26 The country quadrupled its GDP while only doubling the energy it consumed. [10] :26 No other country at a similar stage of industrial development has matched this achievement. [10] :26

On June 19, 2007, the Netherlands Environmental Assessment Agency announced that a preliminary study had indicated that China's greenhouse gas emissions for 2006 had exceeded those of the United States for the first time. The agency calculated that China's CO2 emissions from fossil fuels increased by 9% in 2006, while those of the United States fell by 1.4%, compared to 2005. [11] The study used energy and cement production data from British Petroleum which they believed to be 'reasonably accurate', while warning that statistics for rapidly changing economies such as China are less reliable than data on OECD countries. [12]

The Initial National Communication on Climate Change of the People's Republic of China calculated that carbon dioxide emissions in 2004 had risen to approximately 5.05 billion metric tons, with total greenhouse gas emissions reaching about 6.1 billion metric tons carbon dioxide equivalent. [13]

In 2002, China ranked 2nd (after the United States) in the list of countries by carbon dioxide emissions, with emissions of 3.3 billion metric tons, representing 14.5% of the world total. [14] In 2006, China overtook the US, producing 8% more emissions than the US to become the world's largest emitter of CO2 emissions. [15] However per capita China was ranked 51st in CO2 emissions per capita in 2016, with emissions of 7.2 tonnes per person (compared to 15.5 tonnes per person in the United States). [4] In addition, it has been estimated that around a third of China's carbon emissions in 2005 were due to manufacturing exported goods. [16]

Energy use and carbon emissions by sector

In the industrial sector, six industries – electricity generation, steel, non-ferrous metals, construction materials, oil processing and chemicals – account for nearly 70% of energy use. [17]

In the construction materials sector, China produced about 44% of the world's cement in 2006. [12] Cement production produces more carbon emissions than any other industrial process, accounting for around 4% of global carbon emissions. [12]

National Action Plan on Climate Change

China has been taking action on climate change for some years, with the publication on June 4, 2007, of China's first National Action Plan on Climate Change, [1] and in that year China became the first developing country to publish a national strategy addressing global warming. [18] The plan did not include targets for carbon dioxide emission reductions, but it has been estimated that, if fully implemented, China's annual emissions of greenhouse gases would be reduced by 1.5 billion tons of carbon dioxide equivalent by 2010. [18] Other commentators, however, put the figure at 0.950 billion metric tons. [19]

The publication of the strategy was officially announced during a meeting of the State Council, which called on governments and all sectors of the economy to implement the plan, and for the launch of a public environmental protection awareness campaign. [20]

The National Action Plan includes increasing the proportion of electricity generation from renewable energy sources and from nuclear power, increasing the efficiency of coal-fired power stations, [21] the use of cogeneration, and the development of coal-bed and coal-mine methane. [19]

In 2007 China stated that the (now reversed) one-child policy prevented 300 million births, saving 1.3 billion tons of CO2 emissions based on average world per capita emissions of 4.2 tons at 2005 level. [22]

11th Five-Year Plan

Beginning with the 11th, each of China's five year plans have sought to move China away from energy-intensive manufacturing and into high-value sectors and have highlighted the importance of low-carbon technology as a strategic emerging industry, particularly in the areas of wind and solar power. [10] :26–27 The plan set a national energy intensity target. [10] :54 of a 20% reduction. [23] :167 It was identified as a "binding target" and focused on throughout the Plan's implementation. [23] :167Policymakers viewed emissions reductions and energy conservation as the highest priority environmental matters under the 11th Five-Year Plan. [23] :136

12th Five-Year Plan

Successful achievement of emissions and energy conservation targets[ which? ] in the 11th Five-Year Plan shaped policymaker's approach for the 12th Five-Year Plan, prompting expanded use of binding targets to capitalize on successes in these areas. [23] :136

In January 2012, as part of its 12th Five-year Plan, China published a report 12th Five-year Plan on Greenhouse Emission Control (guofa [2011] No. 41), which establishes goals of reducing carbon intensity by 17% by 2015, compared with 2010 levels and raising energy consumption intensity by 16%, relative to GDP. [24] More demanding targets were set for the most developed regions and those with most heavy industry, including Guangdong, Shanghai, Jiangsu, Zhejiang and Tianjin. [24] China also planned to meet 11.4% of its primary energy requirements from non-fossil sources by 2015. [24]

The plan will also pilot the construction of a number of low-carbon Development Zones and low-carbon residential communities, which it hopes will result in a cluster effect among businesses and consumers. [24]

To facilitate carbon trading and to more broadly help assess emissions targets and meet the transparency requirements of the Paris Agreement, the Plan improved the system for greenhouse gas emissions monitoring. [10] :55 This was the first time that carbon emissions trading had featured in one of China's Five-Year Plans. [25] :80

The plan also provided for the development of an ultra-high-voltage (UHV) transmission corridor to increase the integration of renewable energy from the point of generation to its point of consumption. [10] :39–41

In addition, the Government will in future include data on greenhouse emissions in its official statistics. [24]

Carbon trading scheme

In a separate development, on January 13, 2012, [26] the National Development and Reform Commission announced that the cities of Beijing, Tianjin, Shanghai, Chongqing and Shenzhen, and the provinces of Hubei and Guangdong would become the first to participate in a pilot carbon cap and trade scheme that would operate in a similar way to the European Union Emission Trading Scheme. [24] The development follows an unsuccessful experiment with voluntary carbon exchanges that was set up in 2009 in Beijing, Shanghai and Tianjin. [24]

Fossil fuels

A coal mine near Hailar, Inner Mongolia Coal mine in Inner Mongolia 002.jpg
A coal mine near Hailar, Inner Mongolia
Jinling Oil Refinery, Qixia, Nanjing Ganjiaxiang - industrial panorama - P1070643.JPG
Jinling Oil Refinery, Qixia, Nanjing
Oil well in Qaidam Basin, Qinghai Oil well in Tsaidam.jpg
Oil well in Qaidam Basin, Qinghai

Coal

Coal in China (Mt) [27]
ProductionNet importNet available
20052,226-472,179
20082,761nd2,761
20092,9711143,085
20103,1621573,319
20113,5761773,753
20153,5271993,726
Excludes Hong Kong

Coal remains the foundation of the Chinese energy system, covering close to 70 percent of the country's primary energy needs and representing 80 percent of the fuel used in electricity generation. [28] China produces and consumes more coal than any other country. Analysis in 2016 shows that China's coal consumption appears to have peaked in 2014. [29] [30] According to Global Energy Monitor, China's government has limited the hours of 40% of coal-fired power stations built in 2019, due to overcapacity in electricity generation. [31]

As part of China's efforts to achieve its pledges of peak coal consumption by 2030 and carbon neutrality by 2060, a nationwide effort to reduce overcapacity resulted in the closure of many small and dirty coal mines. [32] :70 Major coal-producing provinces like Shaanxi, Inner Mongolia, and Shanxi instituted administrative caps on coal output. [32] :70 These measures contributed to electricity outages in several northeastern provinces in September 2021 and a coal shortage elsewhere in China. [32] :70 The National Development and Reform Commission responded by relaxing some environmental standards and the government allowed coal-fired power plants to defer tax payments. [32] :71 Trade policy was adjusted to permit the importation of a small amount of coal from Australia. [32] :72 The energy problems abated in a few weeks. [32] :72

In 2023, China accounted for about two-thirds of the global increase in coal capacity, commissioning 47.4 gigawatts (GW) of new coal plants. This level of expansion represents the largest annual increase in coal capacity initiated by any country since 2015. [33]

Petroleum

China's oil supply was 4,855 TWh in 2009 which represented 10% of the world's supply. [34]

Although China is still a major crude oil producer, it became an oil importer in the 1990s. China became dependent on imported oil for the first time in its history in 1993 due to demand rising faster than domestic production. [1] In 2002, annual crude petroleum production was 1,298,000,000 barrels, and annual crude petroleum consumption was 1,670,000,000 barrels. In 2006, it imported 145 million tons of crude oil, accounting for 47% of its total oil consumption. [35] [36] By 2014 China was importing approximately 7 mil. barrels of oil per day. Three state-owned oil companies – Sinopec, CNPC, and CNOOC – dominate its domestic market.

China announced on June 20, 2008, plans to raise petrol, diesel and aviation kerosene prices. This decision appeared to reflect a need to reduce the unsustainably high level of subsidies these fuels attract, given the global trend in the price of oil. [37]

Top oil producers were in 2010: Russia 502 Mt (13%), Saudi Arabia 471 Mt (12%), US 336 Mt (8%), Iran 227 Mt (6%), China 200 Mt (5%), Canada 159 Mt (4%), Mexico 144 Mt (4%), UAE 129 Mt (3%). The world oil production increased from 2005 to 2010 1.3% and from 2009 to 2010 3.4%. [38]

Natural gas

Countries by natural gas proven reserves (2014), based on data from The World Factbook Countries by Natural Gas Proven Reserves (2014).svg
Countries by natural gas proven reserves (2014), based on data from The World Factbook

China's natural gas supply was 1,015 TWh in 2009 that was 3% of the world supply. [39]

CNPC, Sinopec, and CNOOC are all active in the upstream gas sector, as well as in LNG import, and in midstream pipelines. Branch pipelines and urban networks are run by city gas companies including China Gas Holdings, ENN Energy, Towngas China, Beijing Enterprises Holdings and Kunlun Energy.

China was top seventh in natural gas production in 2010. [38]

Issued by China's State Council in September 2013, China's Action Plan for the Prevention and Control of Air Pollution illustrates government desire to increase the share of natural gas in China's energy mix. [1] In May 2014 China signed a 30-year deal with Russia to deliver 38 billion cubic metres of natural gas each year. [40] The Power of Siberia pipeline is designed to reduce China's dependence on coal, which is more carbon intensive and causes more pollution than natural gas. [41] The proposed western gas route from Russia's West Siberian petroleum basin to North-Western China is known as Power of Siberia 2. [42]

In November 2021, U.S. producer Venture Global LNG signed a twenty-year contract with China's state-owned Sinopec to supply liquefied natural gas (LNG). [43] China's imports of U.S. natural gas would more than double. [44]

Electricity generation

1990- Electricity consumption - shares by region - IEA data.svg
By 2025, Asia is projected to account for half of the world’s electricity consumption, with one-third of global electricity to be consumed in China. [45]
Electricity production in China.svg
China depends mainly on fossil fuels for its electricity
Liujiaxia Dam in Gansu, China. 6058-Liujiaxia-Dam.jpg
Liujiaxia Dam in Gansu, China.
Wind farm in Xinjiang, China Wind power plants in Xinjiang, China.jpg
Wind farm in Xinjiang, China

In 2013, China's total annual electricity output was 5.398 trillion kWh and the annual consumption was 5.380 trillion kWh with an installed capacity of 1247 GW (all the largest in the world). [46]

This is an increase from 2009, when China's total annual electricity output was 3.71465 trillion kWh, [47] and the annual consumption was 3.6430 trillion kWh (second largest in the world). [48] In the same year, the total installed electricity generating capacity was 874 GW. [49] China is undertaking substantial long-distance transmission projects with record breaking capacities, and has the goal of achieving an integrated nationwide grid in the period between 2015 and 2020. [50]

Coal

In 2015, China generated 73% of its electricity from coal-fired power stations, which has been dropping from a peak of 81% in 2007. [27]

In recent years, China has increased its use of coal power and continued to build new coal power plants. The National Energy Administration's early warning risk rating for coal plants approved the establishment of new power plants in 2020. China shut down roughly 7GW of power plants at the same time, continuing to decommission ageing coal-fired power reactors. [51]

Coal electricity in China (TWh) [27]
From coalTotal %
20041,7132,20078%
20072,6563,27981%
20082,7333,45779%
20092,9133,69679%
20103,2734,20878%
20113,7244,71579%
20123,8504,93778%
20134,2005,39878%
20144,3545,58378%
20154,1155,66673%

In 2024, global coal-power capacity reached a record 2,130 gigawatts, with China initiating 70 gigawatts of new coal plants—nearly 20 times more than the rest of the world combined. This expansion led to a 2% increase in the world's coal fleet, primarily to enhance China's energy security. Despite a global shift away from coal, this rise underscores potential conflicts with China's climate goals. Additionally, coal capacity also grew in Indonesia and India, marking the first global increase outside China since 2019. [52]

Renewables

China is the world's leading renewable energy producer, with an installed capacity of 152 GW. [5] China has been investing heavily in the renewable energy field in recent years. In 2007, the total renewable energy investment was US$12 billion, second only to Germany. [53] In 2012, China invested US$65.1 billion in clean energy (20% more than in 2011), fully 30% of the total investment by the G-20, including 25% (US$31.2 billion) of global solar energy investment, 37% percent (US$27.2 billion) of global wind energy investment, and 47% (US$6.3 billion) of global investment in "other renewable energy" (small hydro, geothermal, marine, and biomass); 23 GW of clean generation capacity was installed. [54] [ needs update ]

Approximately 7% of China's energy was from renewable sources in 2006, a figure targeted to rise to 10% by 2010 and to 16% by 2020. [19] The major renewable energy source in China is hydropower. Total hydro-electric output in China in 2009 was 615.64 TWh, constituting 16.6% of all electricity generated. The country already has the most hydro-electric capacity in the world, and the Three Gorges Dam is currently the largest hydro-electric power station in the world, with a total capacity of 22.5 GW. It has been in full operation since May 2012.[ needs update ]

China is the largest producer of wind turbines and solar panels. [55] [ needs update ]

Nuclear power

Qinshan Nuclear Power Plant, located in Zhejiang China CANDU at Qinshan.jpg
Qinshan Nuclear Power Plant, located in Zhejiang China

In 2012, China had 15 nuclear power units with a total electric capacity of 11 GW and total output of 54.8 billion kWh, accounting for 1.9% country's total electricity output. This rose to 17 reactors in 2013. By 2016 the number of operating nuclear reactors was 32 with 22 under construction and other dozen to start construction this year. There are plans to increase nuclear power capacity and nuclear power percentage, bringing the total electricity output to 86 GW and 4% respectively by 2020. [56] Plans are to increase this to 200 GWe by 2030, and 400 GWe by 2050. China has set an end-of-the-century goal of 1500GWs of nuclear energy, most of this from fast reactors. China has 32 [57] reactors under construction, the highest number in the world.[ needs update ]

Rural electrification

Following the completion of the similar Township Electrification Program in 2005, the Village Electrification Program plans to provide renewable electricity to 3.5 million households in 10,000 villages by 2010. This is to be followed by full rural electrification using renewable energy by 2015. [58]

Large-scale transmission projects

In 2015, State Grid Corporation of China proposed the Global Energy Interconnection, a long-term proposal to develop globally integrated smart grids and ultra high voltage transmission networks to connect over 80 countries. [59] :92–93 The idea is supported by President Xi Jinping and China in attempting to develop support in various internal forums, including UN bodies. [59] :92

Renewable energy sources

Although a majority of the renewable energy in China is from hydropower, other renewable energy sources are in rapid development. In 2006, a total of 10 billion US dollars had been invested in renewable energy, second only to Germany. [60]

China is a major source of clean energy technology transfer to other developing countries. [10] :4

Bioenergy

Jatropha curcas is to be grown for biofuel production Jatropha curcas1 henning.jpg
Jatropha curcas is to be grown for biofuel production

In 2006, 16 million tons of corn were used to produce a first generation biofuel (ethanol). [61] However, because food prices in China rose sharply during 2007, China has decided to ban the further expansion of the corn ethanol industry.

On February 7, a spokesman for the State Forestry Administration announced that 130,000 square kilometres (50,000 sq mi) would be devoted to biofuel production. Under an agreement reached with PetroChina in January 2007, 400 square kilometres of Jatropha curcas is to be grown for biodiesel production. Local governments are also developing oilseed projects. There were concerns that such developments may lead to environmental damage. [62]

In 2018, The Telegraph reported that the biofuel industry was further on the rise. [63] There was[ when? ] also considerable interest in biofuels (for example biodiesel, green jet fuel) [64] [65] [66] which use waste material as the input source (second generation biofuel).

Solar power

China has become the world's largest consumer of solar energy. [67] It is the largest producer of solar water heaters, accounting for 60 percent of the world's solar hot water heating capacity, and the total installed heaters is estimated at 30 million households. [68] Solar photovoltaic (solar PV) production in China is also in rapid development. In 2007, 0.82 GW of solar PV was produced, second only to Japan. [5]

China's Sixth Five-Year Plan (1981-1985) was the first to address government policy support for solar PV panel manufacturing. [10] :34 Policy support for solar panel manufacturing has been a part of every Five-Year Plan since. [10] :34

As part of the stimulus plan of "Golden Sun", announced by the government in 2009, several developments and projects became part of the milestones for the development of solar technology in China. These include the agreement signed by LDK for a 500MW solar project, a new thin film solar plant developed by Anwell Technologies in Henan province using its own proprietary solar technology and the solar power plant project in a desert, headed by First Solar and Ordos City. The effort to drive the renewable energy use in China was further assured after the speech by the Chinese President, given at the UN climate summit on 22 September 2009 in New York, pledging that China would plan to have 15% of its energy from renewable sources by 2019. China is using solar power in houses, buildings, and cars. [69] [70] [71]

Because solar works well as a distributed power source, recent[ when? ] Chinese policies have focused on increasing the prevalence of distributed solar energy and for developing systems so that electricity from solar energy can be used at its point of generation instead of being transmitted over long distances. [10] :34

Wind power

Huitengxile wind farm, Inner Mongolia, China Huitengxile wind farm 874324260.jpg
Huitengxile wind farm, Inner Mongolia, China

China's total wind power capacity reached 2.67 gigawatts (GW) in 2006 and 44.7 GW by 2010. [72] [73] This figure reached 281 GW in 2020, an increase of 71.6 GW on the previous year. [74]

Energy conservation

General work plan

Officials were warned that violating energy conservation and environmental protection laws would lead to criminal proceedings, while failure to achieve targets would be taken into account in the performance assessment of officials and business leaders. [17]

After achieving less than half the 4% reduction in energy intensity targeted for 2006, all companies and local and national government were asked to submit detailed plans for compliance before June 30, 2007. [75] [76]

During the first four years of the plan, energy intensity improved by 14.4%, but dropped sharply in the first quarter of 2010. In August 2010, China announced the closing of 2,087 steel mills, cement works and other energy-intensive factories by September 30, 2010. The factory closings were made more palatable by a labor shortage in much of China making it easier for workers to find other jobs. [77]

Space heating and air conditioning

A State Council circular issued on June 3, 2007, restricts the temperature of air conditioning in public buildings to no lower than 26 °C in summer (78.8 °F), and of heating to no higher than 20 °C (68 °F) in winter. The sale of inefficient air conditioning units has also been outlawed. [78]

Public opinion

The Chinese results from the 1st Annual World Environment Review, published on June 5, 2007, revealed that, in a sample of 1024 people (50% male): [79]

Another survey published in August 2007 by China Youth Daily and the British Council sampled 2,500 Chinese people with an average age of 30.1. It showed that 80% of young Chinese are concerned about global warming. [80]

See also

Related Research Articles

<span class="mw-page-title-main">Renewable energy in the European Union</span>

Renewable energy progress in the European Union (EU) is driven by the European Commission's 2023 revision of the Renewable Energy Directive, which raises the EU's binding renewable energy target for 2030 to at least 42.5%, up from the previous target of 32%. Effective since November 20, 2023, across all EU countries, this directive aligns with broader climate objectives, including reducing greenhouse gas emissions by at least 55% by 2030 and achieving climate neutrality by 2050. Additionally, the Energy 2020 strategy exceeded its goals, with the EU achieving a 22.1% share of renewable energy in 2020, surpassing the 20% target.

<span class="mw-page-title-main">Energy in the United Kingdom</span> Overview of the energy use of the United Kingdom

Energy in the United Kingdom came mostly from fossil fuels in 2021. Total energy consumption in the United Kingdom was 142.0 million tonnes of oil equivalent in 2019. In 2014, the UK had an energy consumption per capita of 2.78 tonnes of oil equivalent compared to a world average of 1.92 tonnes of oil equivalent. Demand for electricity in 2023 was 29.6 GW on average, supplied through 235 TWh of UK-based generation and 24 TWh of energy imports.

World energy resources are the estimated maximum capacity for energy production given all available resources on Earth. They can be divided by type into fossil fuel, nuclear fuel and renewable resources.

<span class="mw-page-title-main">Energy policy of Australia</span> Overview of the energy policy of Australia

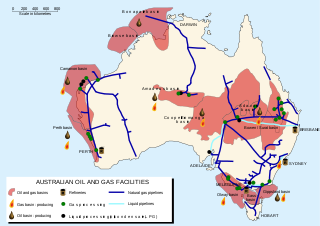
The energy policy of Australia is subject to the regulatory and fiscal influence of all three levels of government in Australia, although only the State and Federal levels determine policy for primary industries such as coal. Federal policies for energy in Australia continue to support the coal mining and natural gas industries through subsidies for fossil fuel use and production. Australia is the 10th most coal-dependent country in the world. Coal and natural gas, along with oil-based products, are currently the primary sources of Australian energy usage and the coal industry produces over 30% of Australia's total greenhouse gas emissions. In 2018 Australia was the 8th highest emitter of greenhouse gases per capita in the world.

<span class="mw-page-title-main">Renewable energy commercialization</span> Deployment of technologies harnessing easily replenished natural resources

Renewable energy commercialization involves the deployment of three generations of renewable energy technologies dating back more than 100 years. First-generation technologies, which are already mature and economically competitive, include biomass, hydroelectricity, geothermal power and heat. Second-generation technologies are market-ready and are being deployed at the present time; they include solar heating, photovoltaics, wind power, solar thermal power stations, and modern forms of bioenergy. Third-generation technologies require continued R&D efforts in order to make large contributions on a global scale and include advanced biomass gasification, hot-dry-rock geothermal power, and ocean energy. In 2019, nearly 75% of new installed electricity generation capacity used renewable energy and the International Energy Agency (IEA) has predicted that by 2025, renewable capacity will meet 35% of global power generation.

<span class="mw-page-title-main">Energy in Brazil</span> Overview of the production, consumption, import and export of energy and electricity in Brazil

Brazil is the 7th largest energy consumer in the world and the largest in South America. At the same time, it is an important oil and gas producer in the region and the world's second largest ethanol fuel producer. The government agencies responsible for energy policy are the Ministry of Mines and Energy (MME), the National Council for Energy Policy (CNPE), the National Agency of Petroleum, Natural Gas and Biofuels (ANP) and the National Agency of Electricity (ANEEL). State-owned companies Petrobras and Eletrobras are the major players in Brazil's energy sector, as well as Latin America's.

<span class="mw-page-title-main">Fossil fuel phase-out</span> Gradual reduction of the use and production of fossil fuels

Fossil fuel phase-out is the gradual reduction of the use and production of fossil fuels to zero, to reduce deaths and illness from air pollution, limit climate change, and strengthen energy independence. It is part of the ongoing renewable energy transition, but is being hindered by fossil fuel subsidies.

<span class="mw-page-title-main">Renewable energy in China</span>

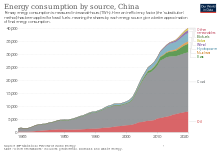
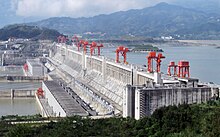
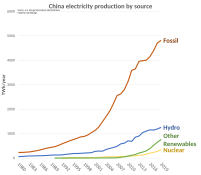
China is the world's leader in electricity production from renewable energy sources, with over triple the generation of the second-ranking country, the United States. China's renewable energy sector is growing faster than its fossil fuels and nuclear power capacity, and is expected to contribute 43% of global renewable capacity growth. China's total renewable energy capacity exceeded 1,000 GW in 2021, accounting for 43.5 per cent of the country's total power generation capacity, 10.2 percentage points higher than in 2015. The country aims to have 80 per cent of its total energy mix come from non-fossil fuel sources by 2060, and achieve a combined 1,200 GW of solar and wind capacity by 2030. In 2023, it was reported that China was on track to reach 1,371 gigawatts of wind and solar by 2025, five years ahead of target due to new renewables installations breaking records.

<span class="mw-page-title-main">Energy in India</span> Overview of the production, consumption, import and export of energy and electricity in India

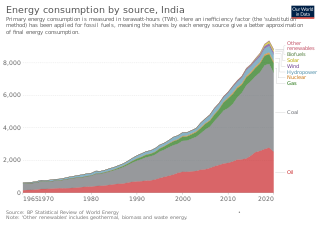
Since 2013, total primary energy consumption in India has been the third highest in the world after China and United States. India is the second-top coal consumer in the year 2017 after China. India ranks third in oil consumption with 22.1 crore tons in 2017 after United States and China. India is net energy importer to meet nearly 47% of its total primary energy in 2019.

<span class="mw-page-title-main">Low-carbon electricity</span> Power produced with lower carbon dioxide emissions

Low-carbon electricity or low-carbon power is electricity produced with substantially lower greenhouse gas emissions over the entire lifecycle than power generation using fossil fuels. The energy transition to low-carbon power is one of the most important actions required to limit climate change.

<span class="mw-page-title-main">Environmental impact of the energy industry</span>

The environmental impact of the energy industry is significant, as energy and natural resource consumption are closely related. Producing, transporting, or consuming energy all have an environmental impact. Energy has been harnessed by human beings for millennia. Initially it was with the use of fire for light, heat, cooking and for safety, and its use can be traced back at least 1.9 million years. In recent years there has been a trend towards the increased commercialization of various renewable energy sources. Scientific consensus on some of the main human activities that contribute to global warming are considered to be increasing concentrations of greenhouse gases, causing a warming effect, global changes to land surface, such as deforestation, for a warming effect, increasing concentrations of aerosols, mainly for a cooling effect.

<span class="mw-page-title-main">Energy in Australia</span> Overview of the production, consumption, import and export of energy and electricity in Australia

Energy in Australia is the production in Australia of energy and electricity, for consumption or export. Energy policy of Australia describes the politics of Australia as it relates to energy.

<span class="mw-page-title-main">Energy in Indonesia</span> Overview of the production, consumption, import and export of energy and electricity in Indonesia

In 2019, the total energy production in Indonesia is 450.79 tonnes of oil equivalent, with a total primary energy supply of 231.14 tonnes of oil equivalent and electricity final consumption of 263.32 terawatt-hours. From 2000 to 2021, Indonesia's total energy supply increased by nearly 60%.

<span class="mw-page-title-main">Energy in Sweden</span> Overview of energy use in Sweden

Energy in Sweden describes energy and electricity production, consumption and import in Sweden. Electricity sector in Sweden is the main article of electricity in Sweden. The Swedish climate bill of February 2017 aims to make Sweden carbon neutral by 2045. The Swedish target is to decline emission of climate gases 63% from 1990 to 2030 and international transportation excluding foreign flights 70%. By 2014 just over half of the country's total final energy consumption in electricity, heating and cooling and transport combined was provided by renewables, the highest share amongst the then 28 EU member countries. About a third of Sweden's electricity is generated by nuclear power. In generating a year's worth of this energy, Swedes generate about 4 tonnes of CO2 emissions each. Since 2010, sustainability measures have reduced total emissions even as the population has increased.

<span class="mw-page-title-main">Energy in Spain</span> Overview of the production, consumption, import and export of energy and electricity in Spain

Primary energy consumption in Spain in 2020 was mainly composed of renewable sources. The largest sources are petroleum (42.3%), natural gas (19.8%) and coal (11.6%). The remaining 26.3% is accounted for by nuclear energy (12%) and different renewable energy sources (14.3%). Domestic production of primary energy includes nuclear (44,8%), solar, wind and geothermal (22,4%), biomass and waste (21,1%), hydropower (7,2%) and fossil (4,5%).

<span class="mw-page-title-main">Energy in Portugal</span> Energy and electricity production in Portugal

Energy in Portugal describes energy and electricity production, consumption and import in Portugal. Energy policy of Portugal will describe the politics of Portugal related to energy more in detail. Electricity sector in Portugal is the main article of electricity in Portugal.

<span class="mw-page-title-main">Energy in Ireland</span> Overview of energy in Ireland

Ireland is a net energy importer. Ireland's import dependency decreased to 85% in 2014. The cost of all energy imports to Ireland was approximately €5.7 billion, down from €6.5 billion (revised) in 2013 due mainly to falling oil and, to a lesser extent, gas import prices. Consumption of all fuels fell in 2014 with the exception of peat, renewables and non-renewable wastes.

<span class="mw-page-title-main">Energy transition</span> Significant structural change in an energy system

An energy transition is a major structural change to energy supply and consumption in an energy system. Currently, a transition to sustainable energy is underway to limit climate change. As much sustainable energy is renewable it is also known as the renewable energy transition. The current transition aims to reduce greenhouse gas emissions from energy quickly and sustainably, mostly by phasing-down fossil fuels and changing as many processes as possible to operate on low carbon electricity. A previous energy transition perhaps took place during the Industrial Revolution from 1760 onwards, from wood and other biomass to coal, followed by oil and later natural gas.

<span class="mw-page-title-main">Greenhouse gas emissions by China</span> Emissions of gases harmful to the climate from China

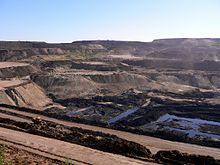
China's greenhouse gas emissions are the largest of any country in the world both in production and consumption terms, and stem mainly from coal burning, including coal power, coal mining, and blast furnaces producing iron and steel. When measuring production-based emissions, China emitted over 14 gigatonnes (Gt) CO2eq of greenhouse gases in 2019, 27% of the world total. When measuring in consumption-based terms, which adds emissions associated with imported goods and extracts those associated with exported goods, China accounts for 13 gigatonnes (Gt) or 25% of global emissions.

<span class="mw-page-title-main">World energy supply and consumption</span> Global production and usage of energy

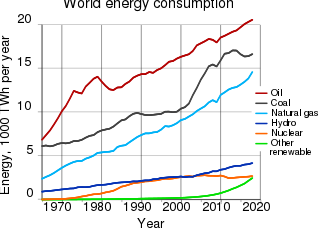
World energy supply and consumption refers to the global supply of energy resources and its consumption. The system of global energy supply consists of the energy development, refinement, and trade of energy. Energy supplies may exist in various forms such as raw resources or more processed and refined forms of energy. The raw energy resources include for example coal, unprocessed oil & gas, uranium. In comparison, the refined forms of energy include for example refined oil that becomes fuel and electricity. Energy resources may be used in various different ways, depending on the specific resource, and intended end use. Energy production and consumption play a significant role in the global economy. It is needed in industry and global transportation. The total energy supply chain, from production to final consumption, involves many activities that cause a loss of useful energy.

References

  1. 1 2 3 4 Andrews-Speed, Philip (November 2014). "China's Energy Policymaking Processes and Their Consequences". The National Bureau of Asian Research Energy Security Report. Retrieved December 5, 2014.
  2. McGrath, Matt (November 20, 2019). "China coal surge threatens Paris climate targets" . Retrieved December 9, 2019.
  3. Ma Tianjie (August 6, 2016). "China's 5 Year Plan for Energy". The Diplomat. Retrieved October 30, 2016.
  4. 1 2 "DataBank – CO2 emissions (metric tons per capita)". The World Bank. Retrieved August 10, 2020.
  5. 1 2 3 Alok Jha (August 1, 2008). "China 'leads the world' in renewable energy". The Guardian. Retrieved February 2, 2011.
  6. Rosen, Daniel; Houser, Trevor (May 2007). "China Energy A Guide for the Perplexed" (PDF). piie.com. Retrieved April 25, 2020.
  7. "Analysis: Will China build hundreds of new coal plants in the 2020s?". Carbon Brief. March 24, 2020. Retrieved September 11, 2020.
  8. "Guest post: Why would anyone finance another coal power plant in China?". Carbon Brief. September 7, 2020. Retrieved September 11, 2020.
  9. IEA Key World Energy Statistics 2012 Archived March 9, 2013, at the Wayback Machine , 2011 Archived October 27, 2011, at the Wayback Machine , 2010 Archived October 11, 2010, at the Wayback Machine , 2009 Archived October 7, 2013, at the Wayback Machine , 2006 Archived October 12, 2009, at the Wayback Machine IEA October, crude oil p.11, coal p. 13 gas p. 15
  10. 1 2 3 4 5 6 7 8 9 10 11 Lewis, Joanna I. (2023). Cooperating for the Climate: Learning from International Partnerships in China's Clean Energy Sector. Cambridge, Massachusetts: The MIT Press. ISBN   978-0-262-54482-5.
  11. "China now no. 1 in CO2 emissions; USA in second position". Netherlands Environmental Assessment Agency. June 19, 2007. Archived from the original on October 3, 2008. Retrieved July 20, 2007.
  12. 1 2 3 "China now no. 1 in CO2 emissions; USA in second position: more info". Netherlands Environmental Assessment Agency. June 19, 2007. Archived from the original on July 1, 2007. Retrieved 2007-07-20.
  13. "Current greenhouse gas emissions in China". Xinhua News Agency . June 4, 2007. Archived from the original on March 15, 2008. Retrieved June 4, 2007.
  14. Data source Dioxyde de carbone (CO2), émissions en mille tonnes de CO2 (CDIAC) Archived March 10, 2007, at the Wayback Machine , United Nations. Retrieved 2005-04-09.
  15. "China now no. 1 in CO2 emissions; USA in second position - PBL Netherlands Environmental Assessment Agency". Archived from the original on December 11, 2011. Retrieved December 14, 2011.
  16. Catherine Brahic (July 29, 2008). "33% of China's Carbon Footprint Blamed on Exports". ABC News. Retrieved July 29, 2008.
  17. 1 2 China says energy efficiency key to performance of government & company leaders, Xinhua News Agency , published 2007-06-03. Retrieved 2007-06-04.
  18. 1 2 China issues first national plan to address climate change, Xinhua News Agency, June 4, 2007, archived from the original on June 7, 2007, retrieved June 4, 2007
  19. 1 2 3 "China to Cut Greenhouse Emissions by 950 Million Tons". Bloomberg. June 2, 2007. Retrieved June 4, 2007.
  20. "National Action Plan on Climate Change". Xinhua News Agency. June 2, 2007. Archived from the original on November 7, 2012. Retrieved June 4, 2007.
  21. "China unveils climate change plan". BBC. June 4, 2007. Retrieved June 4, 2007.
  22. "China says one-child policy helps protect climate". Reuters. August 30, 2007. Retrieved August 30, 2007.
  23. 1 2 3 4 Heilmann, Sebastian (2018). Red Swan: How Unorthodox Policy-Making Facilitated China's Rise. The Chinese University of Hong Kong Press. ISBN   978-962-996-827-4.
  24. 1 2 3 4 5 6 7 Vivian Ni (January 18, 2012). "China Sets New Greenhouse Gas Emission Reduction Goals". China Briefing. Retrieved January 18, 2012.
  25. Ding, Iza (2020). "Pollution Emissions Trading in China". In Esarey, Ashley; Haddad, Mary Alice; Lewis, Joanna I.; Harrell, Stevan (eds.). Greening East Asia: The Rise of the Eco-Developmental State. Seattle: University of Washington Press. ISBN   978-0-295-74791-0. JSTOR   j.ctv19rs1b2.
  26. China set to launch first caps on CO2 emissions New Scientist, 2012-01-17
  27. 1 2 3 IEA Key World Energy Statistics 2015, 2012 Archived March 9, 2013, at the Wayback Machine , 2011 Archived October 27, 2011, at the Wayback Machine , 2010 Archived October 11, 2010, at the Wayback Machine , 2009 Archived October 7, 2013, at the Wayback Machine , 2006 Archived October 12, 2009, at the Wayback Machine IEA coal production p. 15, electricity p. 25 and 27
  28. Aden, Nathaniel T.; Fridley, David G.; Zheng, Nina (June 20, 2008). "Outlook and Challenges for Chinese Coal". doi:10.2172/1050632. OSTI   1050632. S2CID   112601162.{{cite journal}}: Cite journal requires |journal= (help)
  29. Carrington, Damian (July 25, 2016). "China's coal peak hailed as turning point in climate change battle". The Guardian. Retrieved July 25, 2016.
  30. Qi, Ye; Stern, Nicholas; Wu, Tong; Lu, Jiaqi; Green, Fergus (July 25, 2016). "China's post-coal growth" (PDF). Nature Geoscience. 9 (8): 564–566. Bibcode:2016NatGe...9..564Q. doi:10.1038/ngeo2777.
  31. Shearer, Christine; Myllyvirta, Lauri; Yu, Aiqun; Aitken, Greig; Mathew-Shah, Neha; Dallos, Gyorgy; Nace, Ted (March 2020). Boom and Bust 2020: Tracking the Global Coal Plant Pipeline (PDF) (Report). Global Energy Monitor. Archived from the original (PDF) on December 12, 2020. Retrieved April 27, 2020.
  32. 1 2 3 4 5 6 Zhang, Angela Huyue (2024). High Wire: How China Regulates Big Tech and Governs Its Economy. Oxford University Press. ISBN   9780197682258.
  33. Monitor, Global Energy; CREA; E3G; Finance, Reclaim; Club, Sierra; SFOC; Network, Kiko; Europe, C. a. N.; Groups, Bangladesh; Asia, Trend; ACJCE; Sustentable, Chile; POLEN; ICM; Arayara (April 10, 2024). "Boom and Bust Coal 2024". Global Energy Monitor.{{cite journal}}: CS1 maint: numeric names: authors list (link)
  34. Energy in Sweden 2010, Facts and figures Archived October 16, 2013, at the Wayback Machine Table 47 Global supply of oil, 1990–2009 (TWh)
  35. "China's oil imports set new record". Bloomberg BusinessWeek. Archived from the original on May 22, 2011. Retrieved 2011-02-02.
  36. "China's 2006 crude oil imports 145 mln tons, up 14.5 pct - customs - Forbes.com". Forbes . November 19, 2007. Archived from the original on November 19, 2007. Retrieved April 6, 2018.
  37. Rise in global oil price dents China's petrol subsidy policy Archived June 12, 2011, at the Wayback Machine
  38. 1 2 IEA Key energy statistics 2010 Archived October 27, 2011, at the Wayback Machine and IEA Key World Energy Statistics 2011 October pages 11, 21
  39. Energy in Sweden 2010, Facts and figures Archived October 16, 2013, at the Wayback Machine Table 50 Global supply of gas 1990–2009 (TWh)
  40. 38 billion cubic metres of natural gas
  41. "'Power of Siberia': Russia, China launch massive gas pipeline". Al Jazeera . December 2, 2019.
  42. "'Power of Siberia 2' Pipeline Could See Europe, China Compete for Russian Gas". VOA News. January 18, 2022.
  43. "Sinopec signs China's largest long-term LNG contract with U.S. firm". Reuters. November 4, 2021.
  44. "Sinopec signs huge LNG deals with US producer Venture Global". Financial Times. October 20, 2021.
  45. "Electricity Market Report 2023" (PDF). IEA.org. International Energy Agency. February 2023. p. 15. Archived (PDF) from the original on March 15, 2023. Licensed CC BY 4.0.
  46. "COUNTRY COMPARISON :: ELECTRICITY – PRODUCTION". CIA. Archived from the original on October 1, 2018. Retrieved June 20, 2014.
  47. "China Bureau of Statistics 2009年国民经济和社会发展统计公报". Stats.gov.cn. Archived from the original on February 28, 2010. Retrieved February 2, 2011.
  48. "China's National Development and Reform Commission: 2009年全社会用电量稳定增长 清洁能源快速发展". Ndrc.gov.cn. Archived from the original on September 28, 2011. Retrieved February 2, 2011.
  49. "China installed capacity hits 710 GW in 2007". Uk.reuters.com. January 9, 2008. Retrieved February 2, 2011.
  50. Xiaoxin Zhou of Electric Power Research Institute, China (June 27, 2001). "Power System Development and Nationwide Grid Interconnection in China" (PDF). Workshop on Power Grid Interconnection in Northeast Asia, Beijing, China, May 14–16, 2001. Nautilus Institute: 42. Archived from the original (PDF) on February 25, 2009. Retrieved December 18, 2008.
  51. CEN (December 24, 2022). "China's Major Coal Import Hubs Grow". China Economy. Retrieved December 24, 2022.
  52. "China Leads Global Coal Power Surge as Capacity Hits Record". Bloomberg.com. April 10, 2024. Retrieved April 13, 2024.
  53. Kinver, Mark (August 1, 2008). "China's 'rapid renewables surge'". BBC News. Retrieved February 2, 2011.
  54. "Who’s Winning the Clean Energy Race? 2012 Edition", The Pew Charitable Trusts
  55. Bradsher, Keith (January 30, 2010). "China leads global race to make clean energy". The New York Times.
  56. "China's nuclear plants generate 74.8 TWh of electricity in 2011". April 23, 2007. Archived from the original on February 13, 2012. Retrieved June 22, 2007.
  57. "PRIS – Country Details". Iaea.org. Retrieved September 24, 2013.
  58. "Renewables Global Status Report 2006 Update" (PDF). REN21. 2006. Archived from the original (PDF) on July 18, 2011. Retrieved 2007-05-16.
  59. 1 2 Curtis, Simon; Klaus, Ian (2024). The Belt and Road City: Geopolitics, Urbanization, and China's Search for a New International Order. New Haven and London: Yale University Press. doi:10.2307/jj.11589102. ISBN   9780300266900. JSTOR   jj.11589102.
  60. "China poised to lead renewables race". Archived from the original on January 27, 2008.
  61. China corn for ethanol 16 m tons in 2006, published 2007-04-09. Retrieved 2007-08-27.
  62. Chinese Biofuels Expansion Threatens Ecological Disaster, Worldwatch Institute, published 2007-03-13. Retrieved 2007-06-28.
  63. "What is biofuel and why is it big in China?". April 26, 2019. Archived from the original on July 22, 2019 via www.telegraph.co.uk.
  64. "Biofuels push to help clear the air – Chinadaily.com.cn". www.chinadaily.com.cn.
  65. New energy
  66. "Sinopec company prepares to produce green jet fuel | Biofuels International Magazine". biofuels-news.com. August 16, 2012.
  67. Energy: China becomes the world's largest solar power market published 2007-08-27. Retrieved 2007-08-27.
  68. Kunming Heats Up as China’s “Solar City” published 2007-06-15. Retrieved 2007-08-27.
  69. "LDK to develop 500 MW of PV power in China". PennWell. September 1, 2009.
  70. "Anwell Produces its First and Thin Film Solar Panel". Solarbuzz. September 7, 2009.
  71. "First Solar to Team With Ordos City on Major Solar Power Plant in China Desert". First Solar. September 8, 2009. Archived from the original on March 3, 2016. Retrieved September 25, 2009.
  72. "Bloomberg article". www.bloomberg.com. [permanent dead link]
  73. "Archived copy" (PDF). Archived from the original (PDF) on September 4, 2011. Retrieved 2011-08-08.{{cite web}}: CS1 maint: archived copy as title (link)
  74. Stanway, Muyu Xu, David (January 21, 2021). "China doubles new renewable capacity in 2020; still builds thermal plants". Reuters. Retrieved March 11, 2021.{{cite news}}: CS1 maint: multiple names: authors list (link)
  75. China to stick to strict environment-protection plans, Xinhua News Agency , published 2007-06-03. Retrieved 2007-06-04.
  76. Chinese government urges efforts for energy saving, Xinhua News Agency , published 2007-06-03. Retrieved 2007-06-04.
  77. In Crackdown on Energy Use, China to Shut 2,000 Factories, The New York Times , published 2010-08-09. Retrieved 2010-11-07.
  78. State Council: no lower than 26 degrees in air-conditioned rooms, Xinhua News Agency , published 2007-06-03. Retrieved 2007-06-04.
  79. First Annual World Environment Review Poll Reveals Countries Want Governments to Take Strong Action on Climate Change Archived October 22, 2013, at the Wayback Machine , Global Market Insite, published 2007-06-05. Retrieved 2007-05-09.
  80. China's young favor sustainable consumption, but want cars first published 08-20-2007. Retrieved 08-28-07.