List of countries by carbon dioxide emissions

Last updated

Global map of Carbon dioxide (CO2) emissions from fossil fuels and industry. Land use change is not included. Annual-co2-emissions-per-country-map.png
Global map of Carbon dioxide (CO2) emissions from fossil fuels and industry. Land use change is not included.
Annual CO2 emissions by region. This measures fossil fuel and industry emissions. Land use change is not included. Annual-co2-emissions-by-region.png
Annual CO2 emissions by region. This measures fossil fuel and industry emissions. Land use change is not included.
The US, China and Russia have cumulatively contributed the greatest amounts of CO2 since 1850. 20211026 Cumulative carbon dioxide CO2 emissions by country - bar chart.svg
The US, China and Russia have cumulatively contributed the greatest amounts of CO2 since 1850.

This is a list of sovereign states and territories by carbon dioxide emissions [n 1] due to certain forms of human activity, based on the EDGAR database created by European Commission and Netherlands Environmental Assessment Agency. The following table lists the 1970, 1990, 2005, 2017 and 2022 annual CO2 emissions estimates (in kilotons of CO2 per year) along with a list of calculated emissions per capita (in tons of CO2 per year). [4]

Contents

The data only consider carbon dioxide emissions from the burning of fossil fuels and cement manufacture, but not emissions from land use, land-use change and forestry. [n 2] Over the last 150 years, estimated cumulative emissions from land use and land-use change represent approximately one-third of total cumulative anthropogenic CO2 emissions. [7] Emissions from international shipping or bunker fuels are also not included in national figures, [8] which can make a large difference for small countries with important ports.

In 2022, CO2 emissions from the top 10 countries with the highest emissions accounted for almost two thirds of the global total. Since 2006, China has been emitting more CO2 than any other country. [9] [10] [11] However, the main disadvantage of measuring total national emissions is that it does not take population size into account. China has the largest CO2 emissions in the world, but also the largest population. Some argue that for a fair comparison, emissions should be analyzed in terms of the amount of CO2 per capita. [12] Their main argument is illustrated by CO2 per capita emissions in 2022, China's levels (8.85) are almost half those of the United States (14.44) and less than a sixth of those of Palau (59.00 – the country with the highest emissions of CO2 per capita). [13] [4]

Measures of territorial-based emissions, also known as production-based emissions, do not account for emissions embedded in global trade, where emissions may be imported or exported in the form of traded goods, as it only reports emissions emitted within geographical boundaries. Accordingly, a proportion of the CO2 produced and reported in Asia and Africa is for the production of goods consumed in Europe and North America. [14]

Greenhouse gases (GHG) – primarily carbon dioxide but also others, including methane and chlorofluorocarbons – trap heat in the atmosphere, leading to global warming. Higher temperatures then act on the climate, with varying effects. For example, dry regions might become drier while, at the poles, the ice caps are melting, causing higher sea levels. In 2016, the global average temperature was already 1.1°C above pre-industrial levels. [15]

According to the review of the scientific literature conducted by the Intergovernmental Panel on Climate Change (IPCC), carbon dioxide is the most important anthropogenic greenhouse gas by warming contribution. [16] The other major anthropogenic greenhouse gases [n 3] [17] :147 [18] ) are not included in the following list, nor are humans emissions of water vapor ( H2O ), the most important greenhouse gases, as they are negligible compared to naturally occurring quantities. [19] Space-based measurements of carbon dioxide should allow independent monitoring in the mid-2020s. [20]

Per capita CO2 emissions

Fossil CO2 emissions by country/region

The data in the following table is extracted from EDGAR - Emissions Database for Global Atmospheric Research. [4]

Maps and charts

Notes

  1. Carbon dioxide (CO2) is a colourless, odourless and non-poisonous gas formed by combustion of carbon and in the respiration of living organisms and is considered a greenhouse gas.
    Emissions means the release of greenhouse gases and/or their precursors into the atmosphere over a specified area and period of time.
    Carbon dioxide emissions or CO2 emissions are emissions stemming from the burning of fossil fuels and the manufacture of cement; they include carbon dioxide produced during consumption of solid, liquid, and gas fuels as well as gas flaring
  2. Global Carbon Project (2022) Global carbon cycle.png
    Global Carbon Project (2022)
    The rate of build-up of carbon dioxide (CO2) in the atmosphere can be reduced by taking advantage of the fact that atmospheric CO2 can accumulate as carbon in vegetation and soils in terrestrial ecosystems. Under the United Nations Framework Convention on Climate Change any process, activity or mechanism which removes a greenhouse gas (GHG) from the atmosphere is referred to as a "sink". Human activities impact terrestrial sinks, through land use, land-use change and forestry (LULUCF), consequently, the exchange of CO2 (carbon cycle) between the terrestrial biosphere and the atmosphere is altered. [6]
  3. Greenhouse gases (GHG) constitute a group of gases contributing to global warming and climate change.
    The Kyoto Protocol, an environmental agreement adopted by many of the parties to the United Nations Framework Convention on Climate Change (UNFCCC) in 1997 to curb global warming, nowadays covers seven greenhouse gases:
    • the non-fluorinated gases:
      • carbon dioxide (CO2),
      • methane (CH4),
      • nitrous oxide (N2O),
    • the fluorinated gases:
      • hydrofluorocarbons (HFCs),
      • perfluorocarbons (PFCs),
      • sulphur hexafluoride (SF6),
      • nitrogen trifluoride (NF3).
    Converting them to carbon dioxide (or CO2) equivalents makes it possible to compare them and to determine their individual and total contributions to global warming.

Related Research Articles

<span class="mw-page-title-main">Global warming potential</span> Potential heat absorbed by a greenhouse gas

Global warming potential (GWP) is an index to measure of how much infrared thermal radiation a greenhouse gas would absorb over a given time frame after it has been added to the atmosphere. The GWP makes different greenhouse gases comparable with regards to their "effectiveness in causing radiative forcing". It is expressed as a multiple of the radiation that would be absorbed by the same mass of added carbon dioxide, which is taken as a reference gas. Therefore, the GWP is one for CO2. For other gases it depends on how strongly the gas absorbs infrared thermal radiation, how quickly the gas leaves the atmosphere, and the time frame being considered.

<span class="mw-page-title-main">Kyoto Protocol</span> 1997 international treaty to reduce greenhouse gas emissions

The Kyoto Protocol (Japanese: 京都議定書, Hepburn: Kyōto Giteisho) was an international treaty which extended the 1992 United Nations Framework Convention on Climate Change (UNFCCC) that commits state parties to reduce greenhouse gas emissions, based on the scientific consensus that global warming is occurring and that human-made CO2 emissions are driving it. The Kyoto Protocol was adopted in Kyoto, Japan, on 11 December 1997 and entered into force on 16 February 2005. There were 192 parties (Canada withdrew from the protocol, effective December 2012) to the Protocol in 2020.

This glossary of climate change is a list of definitions of terms and concepts relevant to climate change, global warming, and related topics.

<span class="mw-page-title-main">Emission intensity</span> Emission rate of a pollutant

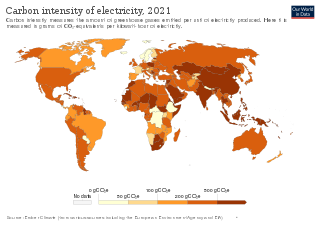
An emission intensity is the emission rate of a given pollutant relative to the intensity of a specific activity, or an industrial production process; for example grams of carbon dioxide released per megajoule of energy produced, or the ratio of greenhouse gas emissions produced to gross domestic product (GDP). Emission intensities are used to derive estimates of air pollutant or greenhouse gas emissions based on the amount of fuel combusted, the number of animals in animal husbandry, on industrial production levels, distances traveled or similar activity data. Emission intensities may also be used to compare the environmental impact of different fuels or activities. In some case the related terms emission factor and carbon intensity are used interchangeably. The jargon used can be different, for different fields/industrial sectors; normally the term "carbon" excludes other pollutants, such as particulate emissions. One commonly used figure is carbon intensity per kilowatt-hour (CIPK), which is used to compare emissions from different sources of electrical power.

<span class="mw-page-title-main">Climate change mitigation</span> Actions to reduce net greenhouse gas emissions to limit climate change

Climate change mitigation is action to limit climate change. This action either reduces emissions of greenhouse gases or removes those gases from the atmosphere. The recent rise in global temperature is mostly due to emissions from burning fossil fuels such as coal, oil, and natural gas. There are various ways that mitigation can reduce emissions. These are transitioning to sustainable energy sources, conserving energy, and increasing efficiency. It is possible to remove carbon dioxide from the atmosphere. This can be done by enlarging forests, restoring wetlands and using other natural and technical processes. The name for these processes is carbon sequestration. Governments and companies have pledged to reduce emissions to prevent dangerous climate change. These pledges are in line with international negotiations to limit warming.

<span class="mw-page-title-main">Carbon footprint</span> Concept to quantify greenhouse gas emissions from activities or products

A carbon footprint (or greenhouse gas footprint) is a calculated value or index that makes it possible to compare the total amount of greenhouse gases that an activity, product, company or country adds to the atmosphere. Carbon footprints are usually reported in tonnes of emissions (CO2-equivalent) per unit of comparison. Such units can be for example tonnes CO2-eq per year, per kilogram of protein for consumption, per kilometer travelled, per piece of clothing and so forth. A product's carbon footprint includes the emissions for the entire life cycle. These run from the production along the supply chain to its final consumption and disposal.

<span class="mw-page-title-main">Land use, land-use change, and forestry</span> Greenhouse gas inventory sector

Land use, land-use change, and forestry (LULUCF), also referred to as Forestry and other land use (FOLU) or Agriculture, Forestry and Other Land Use (AFOLU), is defined as a "greenhouse gas inventory sector that covers emissions and removals of greenhouse gases resulting from direct human-induced land use such as settlements and commercial uses, land-use change, and forestry activities."

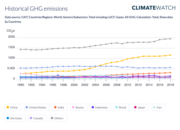
Greenhouse gas inventories are emission inventories of greenhouse gas emissions that are developed for a variety of reasons. Scientists use inventories of natural and anthropogenic (human-caused) emissions as tools when developing atmospheric models. Policy makers use inventories to develop strategies and policies for emissions reductions and to track the progress of those policies.

<span class="mw-page-title-main">Greenhouse gas emissions</span> Sources and amounts of greenhouse gases emitted to the atmosphere from human activities

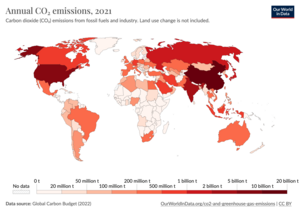
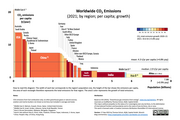
Greenhouse gas (GHG) emissions from human activities intensify the greenhouse effect. This contributes to climate change. Carbon dioxide, from burning fossil fuels such as coal, oil, and natural gas, is one of the most important factors in causing climate change. The largest emitters are China followed by the United States. The United States has higher emissions per capita. The main producers fueling the emissions globally are large oil and gas companies. Emissions from human activities have increased atmospheric carbon dioxide by about 50% over pre-industrial levels. The growing levels of emissions have varied, but have been consistent among all greenhouse gases. Emissions in the 2010s averaged 56 billion tons a year, higher than any decade before. Total cumulative emissions from 1870 to 2017 were 425±20 GtC from fossil fuels and industry, and 180±60 GtC from land use change. Land-use change, such as deforestation, caused about 31% of cumulative emissions over 1870–2017, coal 32%, oil 25%, and gas 10%.

<span class="mw-page-title-main">Greenhouse gas emissions by the United States</span> Climate changing gases from the North American country

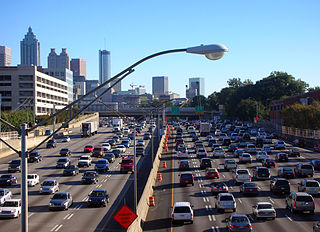
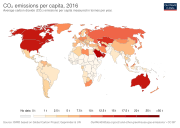
The United States produced 5.2 billion metric tons of carbon dioxide equivalent greenhouse gas (GHG) emissions in 2020, the second largest in the world after greenhouse gas emissions by China and among the countries with the highest greenhouse gas emissions per person. In 2019 China is estimated to have emitted 27% of world GHG, followed by the United States with 11%, then India with 6.6%. In total the United States has emitted a quarter of world GHG, more than any other country. Annual emissions are over 15 tons per person and, amongst the top eight emitters, is the highest country by greenhouse gas emissions per person. However, the IEA estimates that the richest decile in the US emits over 55 tonnes of CO2 per capita each year. Because coal-fired power stations are gradually shutting down, in the 2010s emissions from electricity generation fell to second place behind transportation which is now the largest single source. In 2020, 27% of the GHG emissions of the United States were from transportation, 25% from electricity, 24% from industry, 13% from commercial and residential buildings and 11% from agriculture. In 2021, the electric power sector was the second largest source of U.S. greenhouse gas emissions, accounting for 25% of the U.S. total. These greenhouse gas emissions are contributing to climate change in the United States, as well as worldwide.

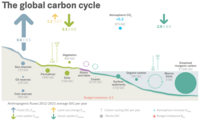
Carbon monitoring as part of greenhouse gas monitoring refers to tracking how much carbon dioxide or methane is produced by a particular activity at a particular time. For example, it may refer to tracking methane emissions from agriculture, or carbon dioxide emissions from land use changes, such as deforestation, or from burning fossil fuels, whether in a power plant, automobile, or other device. Because carbon dioxide is the greenhouse gas emitted in the largest quantities, and methane is an even more potent greenhouse gas, monitoring carbon emissions is widely seen as crucial to any effort to reduce emissions and thereby slow climate change.

<span class="mw-page-title-main">Greenhouse gas</span> Gas in an atmosphere that absorbs and emits radiation at thermal infrared wavelengths

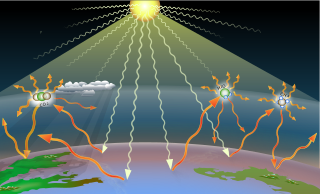
Greenhouse gases are the gases in the atmosphere that raise the surface temperature of planets such as the Earth. What distinguishes them from other gases is that they absorb the wavelengths of radiation that a planet emits, resulting in the greenhouse effect. The Earth is warmed by sunlight, causing its surface to radiate heat, which is then mostly absorbed by greenhouse gases. Without greenhouse gases in the atmosphere, the average temperature of Earth's surface would be about −18 °C (0 °F), rather than the present average of 15 °C (59 °F).

<span class="mw-page-title-main">Climate change scenario</span> Projections of future greenhouse gas emissions


Climate change scenarios or socioeconomic scenarios are projections of future greenhouse gas (GHG) emissions used by analysts to assess future vulnerability to climate change. Scenarios and pathways are created by scientists to survey any long term routes and explore the effectiveness of mitigation and helps us understand what the future may hold. This will allow us to envision the future of human environment system. Producing scenarios requires estimates of future population levels, economic activity, the structure of governance, social values, and patterns of technological change. Economic and energy modelling can be used to analyze and quantify the effects of such drivers.

<span class="mw-page-title-main">Climate change in Europe</span> Emissions, impacts and responses of Europe related to climate change

Climate change has resulted in an increase in temperature of 2.3 °C (2022) in Europe compared to pre-industrial levels. Europe is the fastest warming continent in the world. Europe's climate is getting warmer due to anthropogenic activity. According to international climate experts, global temperature rise should not exceed 2 °C to prevent the most dangerous consequences of climate change; without reduction in greenhouse gas emissions, this could happen before 2050. Climate change has implications for all regions of Europe, with the extent and nature of impacts varying across the continent.

<span class="mw-page-title-main">Representative Concentration Pathway</span> Projections used in climate change modeling

A Representative Concentration Pathway (RCP) is a greenhouse gas concentration trajectory adopted by the IPCC. Four pathways were used for climate modeling and research for the IPCC Fifth Assessment Report (AR5) in 2014. The pathways describe different climate change scenarios, all of which are considered possible depending on the amount of greenhouse gases (GHG) emitted in the years to come. The RCPs – originally RCP2.6, RCP4.5, RCP6, and RCP8.5 – are labelled after a possible range of radiative forcing values in the year 2100. The higher values mean higher greenhouse gas emissions and therefore higher global temperatures and more pronounced effects of climate change. The lower RCP values, on the other hand, are more desirable for humans but require more stringent climate change mitigation efforts to achieve them.

<span class="mw-page-title-main">Carbon budget</span> Limit on carbon dioxide emission for a given climate impact

A carbon budget is a concept used in climate policy to help set emissions reduction targets in a fair and effective way. It looks at "the maximum amount of cumulative net global anthropogenic carbon dioxide emissions that would result in limiting global warming to a given level". When expressed relative to the pre-industrial period it is referred to as the total carbon budget, and when expressed from a recent specified date it is referred to as the remaining carbon budget.

<span class="mw-page-title-main">Greenhouse gas emissions by Russia</span> Greenhouse gas emissions originating from Russia and efforts to reduce them

Greenhouse gas emissionsbyRussia are mostly from fossil gas, oil and coal. Russia emits 2 or 3 billion tonnes CO2eq of greenhouse gases each year; about 4% of world emissions. Annual carbon dioxide emissions alone are about 12 tons per person, more than double the world average. Cutting greenhouse gas emissions, and therefore air pollution in Russia, would have health benefits greater than the cost. The country is the world's biggest methane emitter, and 4 billion dollars worth of methane was estimated to leak in 2019/20.

References

  1. "Per capita CO₂ emissions" (map). ourworldindata.org. Our World in Data . Retrieved 1 November 2023.
  2. "Annual CO₂ emissions by world region" (chart). ourworldindata.org. Our World in Data . Retrieved 1 November 2023.
  3. Evans, Simon (5 October 2021). "Analysis: Which countries are historically responsible for climate change? / Historical responsibility for climate change is at the heart of debates over climate justice". CarbonBrief.org. Carbon Brief. Archived from the original on 26 October 2021. Source: Carbon Brief analysis of figures from the Global Carbon Project, CDIAC, Our World in Data, Carbon Monitor, Houghton and Nassikas (2017) and Hansis et al (2015).
  4. 1 2 3 Crippa, M.; Guizzardi, D.; Pagani, F.; Banja, M.; Muntean, M.; Schaaf, E.; Becker, W.; Monforti-Ferrario, F.; Quadrelli, R.; Risquez Martin, A.; Taghavi-Moharamli, P.; Köykkä, J.; Grassi, G.; Rossi, S.; Brandao De Melo, J.; Oom, D.; Branco, A.; San-Miguel, J.; Vignati, E. (2023). GHG emissions of all world countries – 2023. Luxembourg: Publications Office of the European Union. doi:10.2760/953322 . Retrieved 1 November 2023.
  5. Global Carbon Project (2022) Supplemental data of Global Carbon Budget 2022 (Version 1.0) [Data set]. Global Carbon Project. https://doi.org/10.18160/gcp-2022
  6. United Nations Framework Convention on Climate Change. "Land Use, Land-Use Change and Forestry (LULUCF)". unfccc.int. Retrieved 1 November 2023.
  7. Quesada, Benjamin; Arneth, Almut; Robertson, Eddy; de Noblet-Ducoudré, Nathalie (2018). "Potential strong contribution of future anthropogenic land-use and land-cover change to the terrestrial carbon cycle". Environmental Research Letters. 13 (6). Bibcode:2018ERL....13f4023Q. doi: 10.1088/1748-9326/aac4c3 .
  8. Schrooten, L; De Vlieger, Ina; Int Panis, Luc; Styns, R. Torfs, K; Torfs, R (2008). "Inventory and forecasting of maritime emissions in the Belgian sea territory, an activity based emission model". Atmospheric Environment. 42 (4): 667–676. Bibcode:2008AtmEn..42..667S. doi:10.1016/j.atmosenv.2007.09.071. S2CID   93958844.
  9. "China's Emissions: More Than U.S. Plus Europe, and Still Rising". The New York Times . 25 January 2018.
  10. "Chinese coal fuels rise in global carbon emissions". The Times . 14 November 2017. Retrieved 22 September 2023.
  11. PBL Netherlands Environmental Assessment Agency. "China now no. 1 in CO2 emissions; USA in second position". pbl.nl (in English and Dutch). Planbureau voor de Leefomgeving. Archived from the original on 15 August 2014.
  12. Roser, Max; Ritchie, Hannah (11 May 2017). "CO2 and other Greenhouse Gas Emissions". Our World in Data. Archived from the original on 4 July 2019.
  13. Ritchie, Hannah; Roser, Max. "Per capita CO2 emissions". Our World in Data. Retrieved 1 November 2023.
  14. Ritchie, Hannah; Roser, Max. "Consumption-based (trade-adjusted) emissions". Our World in Data. Retrieved 1 November 2023.
  15. Klugman, Cornelia. "The EU, a world leader in fighting climate change". European Parliament Think Tank. Retrieved 1 November 2023.
  16. IPCC (2021). "Summary for Policymakers" (PDF). Climate Change 2021: The Physical Science Basis (Report). ISBN   978-92-9169-158-6.
  17. Grubb, M. (July–September 2003). "The economics of the Kyoto protocol" (PDF). World Economics. 4 (3). Archived from the original (PDF) on 17 July 2011.
  18. Lerner & K. Lee Lerner, Brenda Wilmoth (2006). "Environmental issues: essential primary sources". Thomson Gale. Retrieved 11 September 2006.
  19. "Are our water vapour emissions warming the climate?". Physics World. 15 November 2018. Retrieved 19 January 2020.
  20. Pan, Guanna; Xu, Yuan; Ma, Jieqi (1 January 2021). "The potential of CO2 satellite monitoring for climate governance: A review". Journal of Environmental Management. 277: 111423. doi:10.1016/j.jenvman.2020.111423. ISSN   0301-4797. PMID   33031999. S2CID   222237434.
  21. "Historical GHG Emissions". Climate Watch. Retrieved 15 June 2021.

See also

General: