List of countries by greenhouse gas emissions

Last updated

Global map of greenhouse gas (GHG) emissions. Greenhouse gas emissions, including agriculture and land use change, measured in carbon dioxide-equivalents over a 100-year timescale. Total-ghg-emissions.png
Global map of greenhouse gas (GHG) emissions. Greenhouse gas emissions, including agriculture and land use change, measured in carbon dioxide-equivalents over a 100-year timescale.
Annual GHG emissions by region, including agriculture and land use change, measured in carbon dioxide-equivalents over a 100-year timescale. Ghg-emissions-by-world-region.png
Annual GHG emissions by region, including agriculture and land use change, measured in carbon dioxide-equivalents over a 100-year timescale.
Per capita annual GHG emissions, including agriculture and land use change, measured in carbon dioxide-equivalents over a 100-year timescale. Per-capita-ghg-emissions.png
Per capita annual GHG emissions, including agriculture and land use change, measured in carbon dioxide-equivalents over a 100-year timescale.

This is a list of sovereign states and territories by greenhouse gas emissions due to certain forms of human activity, based on the EDGAR database created by European Commission. The following table lists the 1970, 1990, 2005, 2017 and 2022 annual GHG [n 1] emissions estimates (in kilotons of CO2 equivalent per year) along with a list of calculated emissions per capita (in metric tons of CO2 equivalent per year). The data include carbon dioxide, methane and nitrous oxide from all sources, including agriculture and land use change. They are measured in carbon dioxide-equivalents over a 100-year timescale.

Contents

The Intergovernmental Panel on Climate Change (IPCC) 6th assessment report finds that the "Agriculture, Forestry and Other Land Use (AFOLU)" sector on average, accounted for 13–21% of global total anthropogenic GHG emissions in the period 2010–2019. [4] Land use change drivers net AFOLU CO2 emission fluxes, with deforestation being responsible for 45% of total AFOLU emissions. In addition to being a net carbon sink and source of GHG emissions, land plays an important role in climate through albedo effects, evapotranspiration, and aerosol loading through emissions of volatile organic compounds. [4] The IPCC report finds that the LULUCF sector offers significant near-term mitigation potential while providing food, wood and other renewable resources as well as biodiversity conservation. Mitigation measures in forests and other natural ecosystems provide the largest share of the LULUCF mitigation potential between 2020 and 2050. Among various LULUCF activities, reducing deforestation has the largest potential to reduce anthropogenic GHG emissions, followed by carbon sequestration in agriculture and ecosystem restoration including afforestation and reforestation. [4] Land use change emissions can be negative. [n 2] [6]

In 2022, GHG emissions from the top 10 countries with the highest emissions accounted for almost two thirds of the global total. Since 2006, China has been emitting more CO2 than any other country. [7] [8] [9]

However, the main disadvantage of measuring total national emissions is that it does not take population size into account. China has the largest CO2 and GHG emissions in the world, but also the largest population. For a fair comparison, emissions should be analyzed in terms of the amount of CO2 and GHG per capita. [10]

Considering GHG per capita emissions in 2022, China's levels (10.95) are almost 60 percent those of the United States (17.90) and less than a sixth of those of Qatar (67.38 – the country with the highest emissions of GHG per capita in 2022). [11] [12]

China, the United States, India, the EU27, Russia and Brazil were the six world largest GHG emitters in 2022. Together they account for 50.1% of global population, 61.2% of global Gross Domestic Product (GDP), 63.4% of global fossil fuel consumption and 61.6% of global GHG emissions. [12] Even in 2022, global GHG emissions primarily consisted of CO2, resulting from the combustion of fossil fuels (71.6%). CH4 contributed 21% to the total, while the remaining share of emissions comprised N2O (4.8%) and F-gases (2.6%). [12]

Measures of territorial-based emissions, also known as production-based emissions, do not account for emissions embedded in global trade, where emissions may be imported or exported in the form of traded goods, as it only reports emissions emitted within geographical boundaries. Accordingly, a proportion of the CO2 produced and reported in Asia and Africa is for the production of goods consumed in Europe and North America. [13]

According to the review of the scientific literature conducted by the Intergovernmental Panel on Climate Change (IPCC), carbon dioxide is the most important anthropogenic greenhouse gas by warming contribution. [14] The European Union is at the forefront of international efforts to reduce greenhouse gas emissions and thus safeguard the planet's climate. Greenhouse gases (GHG) – primarily carbon dioxide but also others, including methane and chlorofluorocarbons – trap heat in the atmosphere, leading to global warming. Higher temperatures then act on the climate, with varying effects. For example, dry regions might become drier while, at the poles, the ice caps are melting, causing higher sea levels. In 2016, the global average temperature was already 1.1 °C above pre-industrial levels. [15]

Per capita GHG emissions

GHG emissions by country/territory

The data in the following table is extracted from EDGAR - Emissions Database for Global Atmospheric Research. [12]

Country/territoryGHG emissions
(ktCO2eq/year)
Per capita (tCO2eq/year % of worldChange
(1990=100%)
19701990200520172022202220222022
Flag of Aruba.svg  Aruba 45.2214.4462.6467.2496.74.640.001%231.7% Increase Negative.svg
Flag of the Taliban.svg  Afghanistan 17,336.213,775.618,191.331,773.029,117.90.730.054%211.4% Increase Negative.svg
Flag of Angola.svg  Angola 20,138.434,957.073,533.981,888.066,480.11.900.124%190.2% Increase Negative.svg
Flag of Anguilla.svg  Anguilla 4.38.818.034.528.11.870.000%317.6% Increase Negative.svg
Flag of Albania.svg  Albania 8,261.311,568.18,070.19,281.37,983.42.710.015%69.0% Decrease Positive.svg
Flag of the Netherlands Antilles (1986-2010).svg  Netherlands Antilles 15,078.62,855.96,146.24,171.52,154.513.060.004%75.4% Decrease Positive.svg
Flag of the United Arab Emirates.svg  United Arab Emirates 29,374.984,786.9169,629.1270,987.8295,110.329.330.549%348.1% Increase Negative.svg
Flag of Argentina.svg Argentina223,210.9262,670.2344,827.1379,169.3382,992.58.270.712%145.8% Increase Negative.svg
Flag of Armenia.svg  Armenia 15,350.124,373.37,429.78,624.09,377.03.190.017%38.5% Decrease Positive.svg
Flag of Antigua and Barbuda.svg  Antigua and Barbuda 170.5246.6265.2335.7359.83.360.001%145.9% Increase Negative.svg
Flag of Australia (converted).svg Australia315,014.3457,216.6576,589.8601,065.2571,382.121.981.062%125.0% Increase Negative.svg
Flag of Austria.svg  Austria 72,486.081,508.096,877.885,874.476,743.38.700.143%94.2% Decrease Positive.svg
Flag of Azerbaijan.svg  Azerbaijan 46,276.369,807.546,458.657,785.668,876.96.720.128%98.7% Decrease Positive.svg
Flag of Burundi.svg  Burundi 2,284.83,059.23,731.97,223.47,479.90.590.014%244.5% Increase Negative.svg
Flag of Belgium (civil).svg Belgium170,206.5142,803.4145,835.3124,191.4114,032.29.740.212%79.9% Decrease Positive.svg
Flag of Benin.svg  Benin 2,519.14,201.68,759.416,604.720,685.11.620.038%492.3% Increase Negative.svg
Flag of Burkina Faso.svg  Burkina Faso 6,801.411,283.520,701.431,296.636,497.11.650.068%323.5% Increase Negative.svg
Flag of Bangladesh.svg  Bangladesh 130,992.6139,912.8179,555.0268,202.7281,082.11.620.523%200.9% Increase Negative.svg
Flag of Bulgaria.svg  Bulgaria 91,663.7104,986.566,755.365,315.868,413.510.000.127%65.2% Decrease Positive.svg
Flag of Bahrain.svg  Bahrain 18,213.130,224.143,733.062,996.569,976.239.290.130%231.5% Increase Negative.svg
Flag of the Bahamas.svg  Bahamas 1,586.01,289.91,145.11,675.11,881.64.540.003%145.9% Increase Negative.svg
Flag of Bosnia and Herzegovina.svg  Bosnia and Herzegovina 16,430.532,789.923,248.031,574.429,324.08.410.055%89.4% Decrease Positive.svg
Flag of Belarus.svg  Belarus 82,257.0137,528.281,382.1101,400.899,874.210.650.186%72.6% Decrease Positive.svg
Flag of Belize.svg  Belize 293.2495.4601.1924.7976.62.360.002%197.1% Increase Negative.svg
Flag of Bermuda.svg  Bermuda 164.2273.1209.3298.0353.95.900.001%129.6% Increase Negative.svg
Bandera de Bolivia (Estado).svg  Bolivia 27,433.231,278.536,467.956,609.458,463.04.920.109%186.9% Increase Negative.svg
Flag of Brazil.svg Brazil365,261.1695,638.11,067,458.91,298,021.61,310,498.96.052.437%188.4% Increase Negative.svg
Flag of Barbados.svg  Barbados 544.5858.9887.3856.2928.03.220.002%108.0% Increase Negative.svg
Flag of Brunei.svg  Brunei 3,207.78,182.611,465.313,653.914,829.432.660.028%181.2% Increase Negative.svg
Flag of Bhutan.svg  Bhutan 730.21,160.81,852.52,979.33,070.93.600.006%264.6% Increase Negative.svg
Flag of Botswana.svg  Botswana 3,456.19,333.710,135.812,131.512,607.15.050.023%135.1% Increase Negative.svg
Flag of the Central African Republic.svg  Central African Republic 1,810.47,823.610,289.012,325.613,448.22.620.025%171.9% Increase Negative.svg
Flag of Canada (Pantone).svg Canada464,159.0582,165.4745,212.1772,896.9756,810.119.791.407%130.0% Increase Negative.svg
Flag of Switzerland (Pantone).svg  Switzerland 51,202.654,843.556,335.349,216.245,563.85.180.085%83.1% Decrease Positive.svg
Flag of Chile.svg  Chile 51,533.160,743.395,547.5128,447.3137,011.27.310.255%225.6% Increase Negative.svg
Flag of the People's Republic of China.svg China2,142,614.24,073,563.08,431,922.013,710,100.315,684,626.810.9529.161%385.0% Increase Negative.svg
Flag of Cote d'Ivoire.svg  Ivory Coast 6,679.511,278.420,283.631,455.436,177.21.320.067%320.8% Increase Negative.svg
Flag of Cameroon.svg  Cameroon 7,947.931,266.332,468.240,731.043,171.31.580.080%138.1% Increase Negative.svg
Flag of the Democratic Republic of the Congo.svg  Democratic Republic of the Congo 13,009.628,575.630,971.356,278.861,635.10.650.115%215.7% Increase Negative.svg
Flag of the Republic of the Congo.svg  Republic of the Congo 2,540.011,465.820,723.122,759.225,962.44.340.048%226.4% Increase Negative.svg
Flag of the Cook Islands.svg  Cook Islands 27.751.2100.4130.8118.26.960.000%231.2% Increase Negative.svg
Flag of Colombia.svg  Colombia 87,114.0139,103.6164,779.9193,581.5215,537.44.230.401%154.9% Increase Negative.svg
Flag of the Comoros.svg  Comoros 239.9343.1535.7777.1922.11.020.002%268.8% Increase Negative.svg
Flag of Cape Verde.svg  Cape Verde 249.1229.5858.91,108.21,303.32.240.002%567.9% Increase Negative.svg
Flag of Costa Rica.svg  Costa Rica 5,992.210,004.712,441.316,056.316,861.43.290.031%168.5% Increase Negative.svg
Flag of Cuba.svg  Cuba 46,962.863,546.946,032.747,552.644,376.63.860.083%69.8% Decrease Positive.svg
Flag of the Cayman Islands.svg  Cayman Islands 30.1122.6162.0291.0344.85.310.001%281.2% Increase Negative.svg
Flag of Cyprus.svg  Cyprus 2,942.05,548.39,178.79,196.810,629.98.680.020%191.6% Increase Negative.svg
Flag of the Czech Republic.svg  Czech Republic 216,877.1197,202.5151,150.6133,490.3124,495.111.710.231%63.1% Decrease Positive.svg
Flag of Germany.svg  Germany 1,322,146.91,235,234.5983,712.9893,939.6784,004.69.491.458%63.5% Decrease Positive.svg
Flag of Djibouti.svg  Djibouti 998.41,892.81,968.32,027.42,232.32.170.004%117.9% Increase Negative.svg
Flag of Dominica.svg  Dominica 39.687.2128.0140.5147.41.970.000%169.0% Increase Negative.svg
Flag of Denmark.svg  Denmark 80,430.469,457.667,257.049,838.845,795.27.840.085%65.9% Decrease Positive.svg
Flag of the Dominican Republic.svg  Dominican Republic 10,231.518,067.130,905.640,279.241,858.53.700.078%231.7% Increase Negative.svg
Flag of Algeria.svg  Algeria 57,099.8145,886.9188,337.6264,905.6284,445.16.380.529%195.0% Increase Negative.svg
Flag of Ecuador.svg  Ecuador 14,207.538,508.756,604.870,234.376,943.74.320.143%199.8% Increase Negative.svg
Flag of Egypt.svg  Egypt 62,238.6153,020.6278,860.0378,645.0377,780.13.550.702%246.9% Increase Negative.svg
Flag of Eritrea.svg  Eritrea 4,173.64,832.35,763.36,528.06,951.91.220.013%143.9% Increase Negative.svg
Flag of the Sahrawi Arab Democratic Republic.svg  Western Sahara 107.9240.6456.1448.6490.40.780.001%203.8% Increase Negative.svg
Flag of Spain.svg Spain192,859.1300,269.0455,616.4357,474.6328,591.07.080.611%109.4% Increase Negative.svg
Flag of Estonia.svg  Estonia 20,225.643,093.422,733.525,319.713,809.310.680.026%32.0% Decrease Positive.svg
Flag of Ethiopia.svg  Ethiopia 54,131.466,228.595,212.0156,161.2192,474.01.630.358%290.6% Increase Negative.svg
Flag of Finland.svg  Finland 66,615.585,557.887,451.966,912.554,805.09.760.102%64.1% Decrease Positive.svg
Flag of Fiji.svg  Fiji 1,442.62,195.43,296.92,869.02,982.33.190.006%135.8% Increase Negative.svg
Flag of the Falkland Islands.svg  Falkland Islands 3.87.012.518.625.08.350.000%355.3% Increase Negative.svg
Flag of France.svg France637,749.4535,186.8546,469.6469,611.9430,363.36.500.800%80.4% Decrease Positive.svg
Flag of the Faroe Islands.svg  Faroe Islands 46.348.449.750.751.01.000.000%105.4% Increase Negative.svg
Flag of Gabon.svg  Gabon 6,818.120,391.326,339.319,892.218,626.78.320.035%91.3% Decrease Positive.svg
Flag of the United Kingdom.svg United Kingdom880,219.7786,212.3681,822.8470,745.3426,562.16.270.793%54.3% Decrease Positive.svg
Flag of Georgia.svg  Georgia 29,319.242,124.311,260.517,047.818,045.84.660.034%42.8% Decrease Positive.svg
Flag of Ghana.svg  Ghana 7,575.511,319.419,310.740,516.753,007.31.660.099%468.3% Increase Negative.svg
Flag of Gibraltar.svg  Gibraltar 82.6159.8428.4677.7689.019.680.001%431.1% Increase Negative.svg
Flag of Guinea.svg  Guinea 5,172.07,901.213,781.225,208.129,280.42.020.054%370.6% Increase Negative.svg
Flag of France.svg  Guadeloupe 459.1959.3991.51,191.21,260.12.810.002%131.3% Increase Negative.svg
Flag of The Gambia.svg  Gambia 731.7972.91,530.02,120.52,343.50.970.004%240.9% Increase Negative.svg
Flag of Guinea-Bissau.svg  Guinea-Bissau 844.51,663.52,182.32,933.53,243.31.550.006%195.0% Increase Negative.svg
Flag of Equatorial Guinea.svg  Equatorial Guinea 115.0182.317,072.816,576.511,551.97.710.021%6,336.7% Increase Negative.svg
Flag of Greece.svg  Greece 45,373.499,514.3128,975.689,820.176,031.26.880.141%76.4% Decrease Positive.svg
Flag of Grenada.svg  Grenada 63.5101.1128.2184.8194.11.750.000%191.9% Increase Negative.svg
Flag of Greenland.svg  Greenland 52.165.2694.0582.8539.59.470.001%827.1% Increase Negative.svg
Flag of Guatemala.svg  Guatemala 8,950.614,150.727,402.939,327.645,018.32.420.084%318.1% Increase Negative.svg
Flag of France.svg  French Guiana 121.0371.5360.9557.9585.51.840.001%157.6% Increase Negative.svg
Flag of Guyana.svg  Guyana 5,098.63,849.24,447.15,991.57,791.09.750.014%202.4% Increase Negative.svg
Flag of Hong Kong.svg  Hong Kong 12,084.039,973.748,363.550,499.739,140.15.120.073%97.9% Decrease Positive.svg
Flag of Honduras.svg  Honduras 6,044.09,652.816,526.521,461.323,744.82.370.044%246.0% Increase Negative.svg
Flag of Croatia.svg  Croatia 28,751.234,067.630,005.826,537.824,177.85.940.045%71.0% Decrease Positive.svg
Flag of Haiti.svg  Haiti 6,441.07,925.311,250.614,850.214,874.11.280.028%187.7% Increase Negative.svg
Flag of Hungary.svg  Hungary 91,797.896,780.980,244.171,451.966,207.66.930.123%68.4% Decrease Positive.svg
Flag of Indonesia.svg  Indonesia 217,887.6427,655.1694,313.91,019,775.11,240,832.64.472.307%290.1% Increase Negative.svg
Flag of India.svg India817,874.61,436,580.62,203,100.23,590,031.53,943,264.62.797.331%274.5% Increase Negative.svg
Flag of Ireland.svg  Ireland 40,003.157,591.475,339.466,621.662,419.112.580.116%108.4% Increase Negative.svg
Flag of Iran.svg  Iran 212,904.4332,763.0683,556.5937,917.3951,983.711.201.770%286.1% Increase Negative.svg
Flag of Iraq.svg  Iraq 100,560.3169,632.3163,848.9330,746.9367,941.18.410.684%216.9% Increase Negative.svg
Flag of Iceland.svg  Iceland 3,228.74,427.64,266.44,590.74,768.213.700.009%107.7% Increase Negative.svg
Flag of Israel.svg  Israel 72,897.942,692.973,940.787,727.687,753.76.020.163%205.5% Increase Negative.svg
Flag of Italy.svg Italy395,944.8513,737.9580,426.5422,796.1394,747.96.700.734%76.8% Decrease Positive.svg
Flag of Jamaica.svg  Jamaica 9,414.99,289.712,598.58,921.57,706.82.640.014%83.0% Decrease Positive.svg
Flag of Jordan.svg  Jordan 3,730.412,541.825,593.435,693.834,539.23.320.064%275.4% Increase Negative.svg
Flag of Japan.svg Japan1,022,184.81,321,807.71,402,607.51,306,923.41,182,769.99.412.199%89.5% Decrease Positive.svg
Flag of Kazakhstan.svg  Kazakhstan 259,461.0349,540.7243,168.7308,907.7331,530.217.330.616%94.8% Decrease Positive.svg
Flag of Kenya.svg  Kenya 24,912.442,674.859,858.596,050.0117,894.82.100.219%276.3% Increase Negative.svg
Flag of Kyrgyzstan (2023).svg  Kyrgyzstan 20,060.833,702.712,045.120,101.621,939.63.400.041%65.1% Decrease Positive.svg
Flag of Cambodia.svg  Cambodia 26,301.020,264.928,923.542,488.550,016.32.910.093%246.8% Increase Negative.svg
Flag of Kiribati.svg  Kiribati 27.235.190.9113.7110.00.870.000%313.3% Increase Negative.svg
Flag of Saint Kitts and Nevis.svg  Saint Kitts and Nevis 65.466.4111.4144.3153.32.640.000%231.0% Increase Negative.svg
Flag of South Korea.svg  South Korea 103,319.8330,373.9582,519.8745,547.3725,743.614.011.349%219.7% Increase Negative.svg
Flag of Kuwait.svg  Kuwait 73,341.849,868.2117,473.3144,112.3167,862.037.960.312%336.6% Increase Negative.svg
Flag of Laos.svg  Laos 7,219.98,240.311,735.934,185.936,861.55.010.069%447.3% Increase Negative.svg
Flag of Lebanon.svg  Lebanon 6,966.98,059.720,980.536,324.731,926.85.430.059%396.1% Increase Negative.svg
Flag of Liberia 23px.svg  Liberia 1,669.01,790.42,697.34,370.35,311.20.990.010%296.6% Increase Negative.svg
Flag of Libya.svg  Libya 131,650.686,632.3105,179.585,377.1104,513.915.320.194%120.6% Increase Negative.svg
Flag of Saint Lucia.svg  Saint Lucia 92.1163.6240.8338.4433.42.370.001%264.9% Increase Negative.svg
Flag of Sri Lanka.svg  Sri Lanka 20,512.123,102.832,333.940,768.938,804.51.830.072%168.0% Increase Negative.svg
Flag of Lesotho.svg  Lesotho 1,975.02,206.82,830.33,055.43,023.11.270.006%137.0% Increase Negative.svg
Flag of Lithuania.svg  Lithuania 28,548.446,631.421,676.323,042.320,846.97.370.039%44.7% Decrease Positive.svg
Flag of Luxembourg.svg  Luxembourg 19,249.812,669.813,072.210,147.78,475.613.690.016%66.9% Decrease Positive.svg
Flag of Latvia.svg  Latvia 18,089.727,266.511,742.411,813.611,107.85.980.021%40.7% Decrease Positive.svg
Flag of Macau.svg  Macau 361.41,010.92,303.73,366.22,414.13.590.004%238.8% Increase Negative.svg
Flag of Morocco.svg  Morocco 24,016.545,249.774,237.8102,365.0114,770.73.030.213%253.6% Increase Negative.svg
Flag of Moldova.svg  Moldova 20,872.437,447.111,180.611,870.312,320.33.090.023%32.9% Decrease Positive.svg
Flag of Madagascar.svg  Madagascar 20,981.525,245.028,168.034,371.934,979.81.200.065%138.6% Increase Negative.svg
Flag of Maldives.svg  Maldives 31.6152.5845.12,085.42,424.35.140.005%1,589.8% Increase Negative.svg
Flag of Mexico.svg Mexico217,975.3466,419.2707,979.7802,741.6819,872.95.991.524%175.8% Increase Negative.svg
Flag of North Macedonia.svg  North Macedonia 12,307.414,468.712,439.610,801.811,183.85.350.021%77.3% Decrease Positive.svg
Flag of Mali.svg  Mali 12,192.613,389.422,415.441,132.649,383.22.300.092%368.8% Increase Negative.svg
Flag of Malta.svg  Malta 791.62,489.82,921.92,013.72,178.25.000.004%87.5% Decrease Positive.svg
Flag of Myanmar.svg  Myanmar 71,740.572,767.1111,059.6157,469.5169,386.93.040.315%232.8% Increase Negative.svg
Flag of Mongolia.svg  Mongolia 15,872.625,924.425,063.662,660.462,790.319.070.117%242.2% Increase Negative.svg
Flag of Mozambique.svg  Mozambique 10,296.910,380.517,947.235,740.840,072.11.170.075%386.0% Increase Negative.svg
Flag of Mauritania.svg  Mauritania 5,695.16,649.810,404.514,679.716,669.93.310.031%250.7% Increase Negative.svg
Flag-of-Martinique.svg  Martinique 407.0919.0875.01,055.11,078.42.800.002%117.3% Increase Negative.svg
Flag of Mauritius.svg  Mauritius 902.81,977.83,840.56,054.26,409.05.010.012%324.0% Increase Negative.svg
Flag of Malawi.svg  Malawi 2,739.26,396.99,735.516,290.120,919.50.980.039%327.0% Increase Negative.svg
Flag of Malaysia 23px.svg  Malaysia 33,132.594,791.5246,078.1307,934.5353,917.410.500.658%373.4% Increase Negative.svg
Flag of Namibia.svg  Namibia 6,544.36,638.410,697.012,459.313,102.84.670.024%197.4% Increase Negative.svg
Flags of New Caledonia.svg  New Caledonia 1,352.81,908.73,143.25,331.15,687.919.350.011%298.0% Increase Negative.svg
Flag of Niger.svg  Niger 11,310.611,678.821,581.434,528.643,240.11.660.080%370.2% Increase Negative.svg
Flag of Nigeria.svg  Nigeria 186,683.3287,313.9399,978.8408,751.0407,690.21.880.758%141.9% Increase Negative.svg
Flag of Nicaragua.svg  Nicaragua 9,224.910,614.414,979.919,978.221,025.23.210.039%198.1% Increase Negative.svg
Flag of the Netherlands.svg  Netherlands 182,391.7228,342.4226,131.5206,269.3167,847.49.720.312%73.5% Decrease Positive.svg
Flag of Norway.svg  Norway 55,200.662,914.174,509.073,862.469,965.512.600.130%111.2% Increase Negative.svg
Flag of Nepal.svg  Nepal 25,311.831,605.037,509.253,401.356,735.11.840.105%179.5% Increase Negative.svg
Flag of New Zealand.svg New Zealand57,277.470,544.488,081.887,974.582,720.416.830.154%117.3% Increase Negative.svg
Flag of Oman.svg  Oman 14,172.433,464.866,647.8121,262.1137,243.725.590.255%410.1% Increase Negative.svg
Flag of Pakistan.svg  Pakistan 104,993.5215,032.9351,128.7512,766.2546,099.32.531.015%254.0% Increase Negative.svg
Flag of Panama.svg  Panama 6,381.27,365.912,934.916,749.018,477.64.190.034%250.9% Increase Negative.svg
Flag of Peru.svg  Peru 39,375.947,003.366,338.596,521.1105,139.43.090.195%223.7% Increase Negative.svg
Flag of the Philippines.svg  Philippines 90,673.0109,812.4162,958.0239,385.7265,295.92.350.493%241.6% Increase Negative.svg
Flag of Palau.svg  Palau 2,149.72,326.21,841.11,255.31,418.161.650.003%61.0% Decrease Positive.svg
Flag of Papua New Guinea.svg  Papua New Guinea 1,855.53,848.09,572.311,822.69,096.81.000.017%236.4% Increase Negative.svg
Flag of Poland.svg Poland486,545.0514,613.2412,029.3413,802.9400,823.810.620.745%77.9% Decrease Positive.svg
Flag of Puerto Rico.svg  Puerto Rico 30,654.021,711.028,585.513,997.815,264.64.190.028%70.3% Decrease Positive.svg
Flag of North Korea.svg  North Korea 100,088.1169,836.3113,563.283,986.881,292.53.120.151%47.9% Decrease Positive.svg
Flag of Portugal.svg  Portugal 29,951.059,464.884,117.772,188.859,712.55.880.111%100.4% Increase Negative.svg
Flag of Paraguay.svg  Paraguay 10,660.821,379.826,632.543,237.145,565.36.300.085%213.1% Increase Negative.svg
Flag of French Polynesia.svg  French Polynesia 213.1960.61,150.11,189.01,122.13.820.002%116.8% Increase Negative.svg
Flag of Qatar.svg  Qatar 24,294.529,080.783,445.5190,788.4194,652.167.380.362%669.4% Increase Negative.svg
Flag of France.svg  Réunion 492.21,163.12,757.13,056.73,147.23.460.006%270.6% Increase Negative.svg
Flag of Romania.svg  Romania 180,720.4245,773.6140,123.3121,013.0117,061.06.100.218%47.6% Decrease Positive.svg
Flag of Russia.svg Russia1,910,915.83,053,150.22,221,772.82,339,248.02,579,798.117.994.796%84.5% Decrease Positive.svg
Flag of Rwanda.svg  Rwanda 4,348.36,219.85,541.38,107.19,031.80.660.017%145.2% Increase Negative.svg
Flag of Saudi Arabia.svg  Saudi Arabia 76,320.0238,391.2466,493.6774,572.6810,511.622.641.507%340.0% Increase Negative.svg
Flag of Yugoslavia (1992-2003); Flag of Serbia and Montenegro (2003-2006).svg  Serbia and Montenegro 46,143.185,526.376,987.771,887.669,945.07.540.130%81.8% Decrease Positive.svg
Flag of Sudan.svg  Sudan 38,913.662,644.9116,451.2137,089.8146,955.42.420.273%234.6% Increase Negative.svg
Flag of Senegal.svg  Senegal 8,020.510,461.716,956.325,916.830,614.51.690.057%292.6% Increase Negative.svg
Flag of Singapore.svg  Singapore 7,648.134,203.251,214.070,398.070,469.511.670.131%206.0% Increase Negative.svg
Flag of the United Kingdom.svg  Saint Helena, Ascension and Tristan da Cunha 3.910.911.418.620.35.080.000%186.6% Increase Negative.svg
Flag of the Solomon Islands.svg  Solomon Islands 137.1272.5491.6587.0593.80.880.001%217.9% Increase Negative.svg
Flag of Sierra Leone.svg  Sierra Leone 3,206.24,069.35,002.07,007.87,123.10.850.013%175.0% Increase Negative.svg
Flag of El Salvador.svg  El Salvador 5,963.37,777.113,029.311,956.513,073.92.000.024%168.1% Increase Negative.svg
Flag of Somalia.svg  Somalia 18,707.225,345.430,342.430,973.533,358.21.950.062%131.6% Increase Negative.svg
Flag of France.svg  Saint Pierre and Miquelon 41.793.928.241.144.16.300.000%47.0% Decrease Positive.svg
Flag of Sao Tome and Principe.svg  São Tomé and Príncipe 40.886.6159.5235.3262.41.160.000%302.9% Increase Negative.svg
Flag of Suriname.svg  Suriname 2,075.41,922.32,648.03,647.64,500.37.670.008%234.1% Increase Negative.svg
Flag of Slovakia.svg  Slovakia 57,919.274,712.052,151.847,439.545,564.28.360.085%61.0% Decrease Positive.svg
Flag of Slovenia.svg  Slovenia 14,808.821,426.123,667.620,091.218,275.88.780.034%85.3% Decrease Positive.svg
Flag of Sweden.svg Sweden116,237.479,214.781,440.166,114.460,636.85.910.113%76.5% Decrease Positive.svg
Flag of Eswatini.svg  Eswatini 1,896.53,345.03,369.53,089.83,386.92.280.006%101.3% Increase Negative.svg
Flag of Seychelles.svg  Seychelles 135.4330.31,051.01,188.01,199.412.360.002%363.1% Increase Negative.svg
Flag of Syria.svg  Syria 15,921.664,097.889,637.444,949.146,311.82.260.086%72.3% Decrease Positive.svg
Flag of the Turks and Caicos Islands.svg  Turks and Caicos Islands 5.210.744.395.2100.72.650.000%941.7% Increase Negative.svg
Flag of Chad.svg  Chad 9,097.311,136.436,548.170,226.489,837.35.210.167%806.7% Increase Negative.svg
Flag of Togo.svg  Togo 1,995.33,568.76,063.78,914.311,087.61.260.021%310.7% Increase Negative.svg
Flag of Thailand.svg  Thailand 120,386.0221,898.5381,183.0449,459.5463,874.76.670.862%209.0% Increase Negative.svg
Flag of Tajikistan.svg  Tajikistan 13,292.822,325.112,080.818,351.322,833.62.320.042%102.3% Increase Negative.svg
Flag of Turkmenistan.svg  Turkmenistan 45,078.186,640.9100,266.1123,127.1128,919.220.800.240%148.8% Increase Negative.svg
Flag of East Timor.svg  Timor-Leste 715.3595.12,041.03,135.52,475.71.720.005%416.0% Increase Negative.svg
Flag of Tonga.svg  Tonga 79.0189.2237.8296.1284.12.510.001%150.2% Increase Negative.svg
Flag of Trinidad and Tobago.svg  Trinidad and Tobago 9,436.718,193.651,840.450,988.645,910.933.270.085%252.3% Increase Negative.svg
Flag of Tunisia.svg  Tunisia 10,853.523,923.236,498.643,521.049,820.14.110.093%208.3% Increase Negative.svg
Flag of Turkey.svg  Turkey 102,477.4228,085.7336,515.3597,556.5687,526.38.091.278%301.4% Increase Negative.svg
Flag of the Republic of China.svg  Taiwan 54,468.2140,576.5332,140.0319,322.7307,682.312.860.572%218.9% Increase Negative.svg
Flag of Tanzania.svg  Tanzania 21,126.231,170.050,948.777,561.589,378.41.340.166%286.7% Increase Negative.svg
Flag of Uganda.svg  Uganda 13,213.218,452.428,496.146,922.556,490.41.120.105%306.1% Increase Negative.svg
Flag of Ukraine.svg  Ukraine 651,144.0952,140.0444,000.5280,727.8208,606.94.840.388%21.9% Decrease Positive.svg
Flag of Uruguay.svg  Uruguay 29,122.029,648.838,125.141,091.941,907.811.910.078%141.3% Increase Negative.svg
Flag of the United States.svg United States5,750,029.66,163,741.67,101,881.26,110,706.46,017,443.017.9011.188%97.6% Decrease Positive.svg
Flag of Uzbekistan.svg  Uzbekistan 109,995.2177,173.0191,579.3203,018.8227,206.76.670.422%128.2% Increase Negative.svg
Flag of Saint Vincent and the Grenadines.svg  Saint Vincent and the Grenadines 55.787.9127.8170.9154.61.390.000%175.8% Increase Negative.svg
Flag of Venezuela.svg  Venezuela 100,657.7166,754.7247,491.0233,864.8169,517.14.990.315%101.7% Increase Negative.svg
Flag of the British Virgin Islands.svg  British Virgin Islands 9.221.341.771.675.42.280.000%354.1% Increase Negative.svg
Flag of Vietnam.svg  Vietnam 94,250.8112,020.8239,899.9386,338.2489,159.24.880.909%436.7% Increase Negative.svg
Flag of Vanuatu.svg  Vanuatu 297.8479.6563.7637.8585.91.910.001%122.2% Increase Negative.svg
Flag of Samoa.svg  Samoa 169.0301.8441.1592.7548.42.700.001%181.7% Increase Negative.svg
Flag of Yemen.svg  Yemen 5,959.318,241.645,378.731,807.138,006.01.200.071%208.3% Increase Negative.svg
Flag of South Africa.svg  South Africa 243,936.9411,937.7555,478.1602,773.4534,531.78.910.994%129.8% Increase Negative.svg
Flag of Zambia.svg  Zambia 12,784.916,287.417,321.127,241.630,330.61.530.056%186.2% Increase Negative.svg
Flag of Zimbabwe.svg  Zimbabwe 22,245.835,256.528,593.129,174.930,190.11.640.056%85.6% Decrease Positive.svg
GLOBAL TOTAL24,497,54433,268,12142,318,42951,195,41953,786,0396.76100%161.7% Increase Negative.svg
World – International Aviation171,160.5261,804.5423,309.1591,079.3425,963.70.792%162.7% Increase Negative.svg
World – International Shipping375,583.6394,750.8607,269.9747,849.1750,699.31.396%190.2% Increase Negative.svg

Notes

  1. Greenhouse gases (GHG) constitute a group of gases contributing to global warming and climate change.
    The Kyoto Protocol, an environmental agreement adopted by many of the parties to the United Nations Framework Convention on Climate Change (UNFCCC) in 1997 to curb global warming, nowadays covers seven greenhouse gases:
    • the non-fluorinated gases:
      • carbon dioxide (CO2),
      • methane (CH4),
      • nitrous oxide (N2O),
    • the fluorinated gases:
      • hydrofluorocarbons (HFCs),
      • perfluorocarbons (PFCs),
      • sulphur hexafluoride (SF6),
      • nitrogen trifluoride (NF3).
    Converting them to carbon dioxide (or CO2) equivalents makes it possible to compare them and to determine their individual and total contributions to global warming.
  2. Global Carbon Project (2022) Global carbon cycle.png
    Global Carbon Project (2022)
    The rate of build-up of GHG in the atmosphere can be reduced by taking advantage of the fact that atmospheric CO2 can accumulate as carbon in vegetation and soils in terrestrial ecosystems. Under the United Nations Framework Convention on Climate Change any process, activity or mechanism which removes a greenhouse gas (GHG) from the atmosphere is referred to as a "sink". Human activities impact terrestrial sinks, through land use, land-use change and forestry (LULUCF), consequently, the exchange of CO2 (carbon cycle) between the terrestrial biosphere and the atmosphere is altered. [4]

Related Research Articles

<span class="mw-page-title-main">Causes of climate change</span> Effort to scientifically ascertain mechanisms responsible for recent global warming

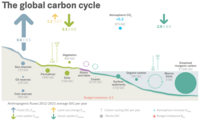
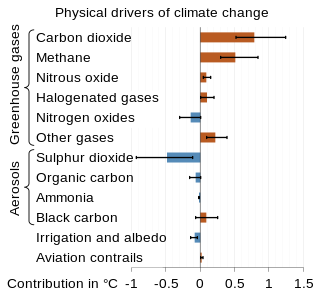
The scientific community has been investigating the causes of climate change for decades. After thousands of studies, it came to a consensus, where it is "unequivocal that human influence has warmed the atmosphere, ocean and land since pre-industrial times." This consensus is supported by around 200 scientific organizations worldwide, The dominant role in this climate change has been played by the direct emissions of carbon dioxide from the burning of fossil fuels. Indirect CO2 emissions from land use change, and the emissions of methane, nitrous oxide and other greenhouse gases play major supporting roles.

<span class="mw-page-title-main">Global warming potential</span> Potential heat absorbed by a greenhouse gas

Global Warming Potential (GWP) is an index to measure how much infrared thermal radiation a greenhouse gas would absorb over a given time frame after it has been added to the atmosphere. The GWP makes different greenhouse gases comparable with regard to their "effectiveness in causing radiative forcing". It is expressed as a multiple of the radiation that would be absorbed by the same mass of added carbon dioxide, which is taken as a reference gas. Therefore, the GWP has a value of 1 for CO2. For other gases it depends on how strongly the gas absorbs infrared thermal radiation, how quickly the gas leaves the atmosphere, and the time frame being considered.

<span class="mw-page-title-main">Kyoto Protocol</span> 1997 international treaty to reduce greenhouse gas emissions

The Kyoto Protocol (Japanese: 京都議定書, Hepburn: Kyōto Giteisho) was an international treaty which extended the 1992 United Nations Framework Convention on Climate Change (UNFCCC) that commits state parties to reduce greenhouse gas emissions, based on the scientific consensus that global warming is occurring and that human-made CO2 emissions are driving it. The Kyoto Protocol was adopted in Kyoto, Japan, on 11 December 1997 and entered into force on 16 February 2005. There were 192 parties (Canada withdrew from the protocol, effective December 2012) to the Protocol in 2020.

<span class="mw-page-title-main">Emission intensity</span> Emission rate of a pollutant

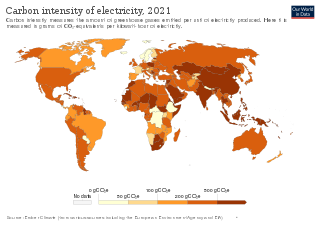
An emission intensity is the emission rate of a given pollutant relative to the intensity of a specific activity, or an industrial production process; for example grams of carbon dioxide released per megajoule of energy produced, or the ratio of greenhouse gas emissions produced to gross domestic product (GDP). Emission intensities are used to derive estimates of air pollutant or greenhouse gas emissions based on the amount of fuel combusted, the number of animals in animal husbandry, on industrial production levels, distances traveled or similar activity data. Emission intensities may also be used to compare the environmental impact of different fuels or activities. In some case the related terms emission factor and carbon intensity are used interchangeably. The jargon used can be different, for different fields/industrial sectors; normally the term "carbon" excludes other pollutants, such as particulate emissions. One commonly used figure is carbon intensity per kilowatt-hour (CIPK), which is used to compare emissions from different sources of electrical power.

<span class="mw-page-title-main">Climate change mitigation</span> Actions to reduce net greenhouse gas emissions to limit climate change

Climate change mitigation (or decarbonisation) is action to limit the greenhouse gases in the atmosphere that cause climate change. Greenhouse gas emissions are primarily caused by people burning fossil fuels such as coal, oil, and natural gas. Phasing out fossil fuel use can happen by conserving energy and replacing fossil fuels with clean energy sources such as wind, hydro, solar, and nuclear power. Secondary mitigation strategies include changes to land use and removing carbon dioxide (CO2) from the atmosphere. Governments have pledged to reduce greenhouse gas emissions, but actions to date are insufficient to avoid dangerous levels of climate change.

<span class="mw-page-title-main">Carbon footprint</span> Concept to quantify greenhouse gas emissions from activities or products

A carbon footprint (or greenhouse gas footprint) is a calculated value or index that makes it possible to compare the total amount of greenhouse gases that an activity, product, company or country adds to the atmosphere. Carbon footprints are usually reported in tonnes of emissions (CO2-equivalent) per unit of comparison. Such units can be for example tonnes CO2-eq per year, per kilogram of protein for consumption, per kilometer travelled, per piece of clothing and so forth. A product's carbon footprint includes the emissions for the entire life cycle. These run from the production along the supply chain to its final consumption and disposal.

<span class="mw-page-title-main">Land use, land-use change, and forestry</span> Greenhouse gas inventory sector

Land use, land-use change, and forestry (LULUCF), also referred to as Forestry and other land use (FOLU) or Agriculture, Forestry and Other Land Use (AFOLU), is defined as a "greenhouse gas inventory sector that covers emissions and removals of greenhouse gases resulting from direct human-induced land use such as settlements and commercial uses, land-use change, and forestry activities."

Greenhouse gas inventories are emission inventories of greenhouse gas emissions that are developed for a variety of reasons. Scientists use inventories of natural and anthropogenic (human-caused) emissions as tools when developing atmospheric models. Policy makers use inventories to develop strategies and policies for emissions reductions and to track the progress of those policies.

<span class="mw-page-title-main">Greenhouse gas emissions</span> Sources and amounts of greenhouse gases emitted to the atmosphere from human activities

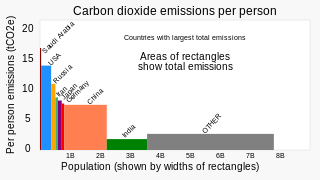
Greenhouse gas (GHG) emissions from human activities intensify the greenhouse effect. This contributes to climate change. Carbon dioxide, from burning fossil fuels such as coal, oil, and natural gas, is one of the most important factors in causing climate change. The largest emitters are China followed by the United States. The United States has higher emissions per capita. The main producers fueling the emissions globally are large oil and gas companies. Emissions from human activities have increased atmospheric carbon dioxide by about 50% over pre-industrial levels. The growing levels of emissions have varied, but have been consistent among all greenhouse gases. Emissions in the 2010s averaged 56 billion tons a year, higher than any decade before. Total cumulative emissions from 1870 to 2017 were 425±20 GtC from fossil fuels and industry, and 180±60 GtC from land use change. Land-use change, such as deforestation, caused about 31% of cumulative emissions over 1870–2017, coal 32%, oil 25%, and gas 10%.

<span class="mw-page-title-main">Greenhouse gas emissions by the United States</span> Climate changing gases from the North American country

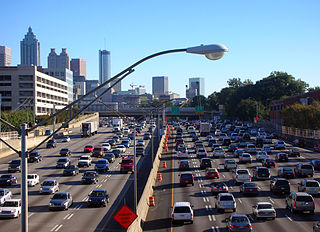
The United States produced 5.2 billion metric tons of carbon dioxide equivalent greenhouse gas (GHG) emissions in 2020, the second largest in the world after greenhouse gas emissions by China and among the countries with the highest greenhouse gas emissions per person. In 2019 China is estimated to have emitted 27% of world GHG, followed by the United States with 11%, then India with 6.6%. In total the United States has emitted a quarter of world GHG, more than any other country. Annual emissions are over 15 tons per person and, amongst the top eight emitters, is the highest country by greenhouse gas emissions per person. However, the IEA estimates that the richest decile in the US emits over 55 tonnes of CO2 per capita each year. Because coal-fired power stations are gradually shutting down, in the 2010s emissions from electricity generation fell to second place behind transportation which is now the largest single source. In 2020, 27% of the GHG emissions of the United States were from transportation, 25% from electricity, 24% from industry, 13% from commercial and residential buildings and 11% from agriculture.

The Kyoto Protocol was an international treaty which extended the 1992 United Nations Framework Convention on Climate Change. A number of governments across the world took a variety of actions.

A climate change scenario is a hypothetical future based on a "set of key driving forces". Scenarios explore the long-term effectiveness of mitigation and adaptation. Scenarios help to understand what the future may hold. They can show which decisions will have the most meaningful effects on mitigation and adaptation.

<span class="mw-page-title-main">Representative Concentration Pathway</span> Projections used in climate change modeling

Representative Concentration Pathways (RCP) are climate change scenarios to project future greenhouse gas concentrations. These pathways describe future greenhouse gas concentrations and have been formally adopted by the IPCC. The pathways describe different climate change scenarios, all of which were considered possible depending on the amount of greenhouse gases (GHG) emitted in the years to come. The four RCPs – originally RCP2.6, RCP4.5, RCP6, and RCP8.5 – are labelled after a possible range of radiative forcing values in the year 2100. The IPCC Fifth Assessment Report (AR5) began to use these four pathways for climate modeling and research in 2014. The higher values mean higher greenhouse gas emissions and therefore higher global surface temperatures and more pronounced effects of climate change. The lower RCP values, on the other hand, are more desirable for humans but would require more stringent climate change mitigation efforts to achieve them.

<span class="mw-page-title-main">Carbon budget</span> Limit on carbon dioxide emission for a given climate impact

A carbon budget is a concept used in climate policy to help set emissions reduction targets in a fair and effective way. It examines the "maximum amount of cumulative net global anthropogenic carbon dioxide emissions that would result in limiting global warming to a given level". It can be expressed relative to the pre-industrial period. In this case, it is the total carbon budget. Or it can be expressed from a recent specified date onwards. In that case it is the remaining carbon budget.

<span class="mw-page-title-main">Greenhouse gas emissions from agriculture</span> Agricultures effects on climate change

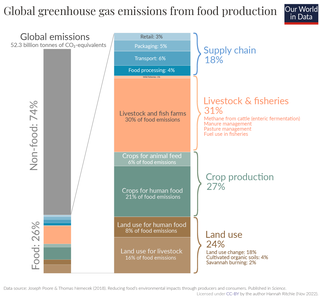
The amount of greenhouse gas emissions from agriculture is significant: The agriculture, forestry and land use sector contribute between 13% and 21% of global greenhouse gas emissions. Emissions come from direct greenhouse gas emissions. and from indirect emissions. With regards to direct emissions, nitrous oxide and methane make up over half of total greenhouse gas emission from agriculture. Indirect emissions on the other hand come from the conversion of non-agricultural land such as forests into agricultural land. Furthermore, there is also fossil fuel consumption for transport and fertilizer production. For example, the manufacture and use of nitrogen fertilizer contributes around 5% of all global greenhouse gas emissions. Livestock farming is a major source of greenhouse gas emissions. At the same time, livestock farming is affected by climate change.

<span class="mw-page-title-main">Greenhouse gas emissions by China</span> Emissions of gases harmful to the climate from China

China's greenhouse gas emissions are the largest of any country in the world both in production and consumption terms, and stem mainly from coal burning, including coal power, coal mining, and blast furnaces producing iron and steel. When measuring production-based emissions, China emitted over 14 gigatonnes (Gt) CO2eq of greenhouse gases in 2019, 27% of the world total. When measuring in consumption-based terms, which adds emissions associated with imported goods and extracts those associated with exported goods, China accounts for 13 gigatonnes (Gt) or 25% of global emissions.

<span class="mw-page-title-main">Greenhouse gas emissions by Russia</span> Greenhouse gas emissions originating from Russia and efforts to reduce them

Greenhouse gas emissionsbyRussia are mostly from fossil gas, oil and coal. Russia emits 2 or 3 billion tonnes CO2eq of greenhouse gases each year; about 4% of world emissions. Annual carbon dioxide emissions alone are about 12 tons per person, more than double the world average. Cutting greenhouse gas emissions, and therefore air pollution in Russia, would have health benefits greater than the cost. The country is the world's biggest methane emitter, and 4 billion dollars worth of methane was estimated to leak in 2019/20.

References

  1. "Greenhouse gas emissions". ourworldindata.org. Our World in Data . Retrieved 2023-11-01.
  2. "Annual greenhouse gas emissions by world region, 1850 to 2021". ourworldindata.org. Our World in Data . Retrieved 2023-11-01.
  3. "Total greenhouse gas emissions per capita". ourworldindata.org. Our World in Data . Retrieved 2023-11-01.
  4. 1 2 3 4 United Nations Framework Convention on Climate Change. "Land Use, Land-Use Change and Forestry (LULUCF)". unfccc.int. Retrieved 2023-11-01.
  5. Global Carbon Project (2022) Supplemental data of Global Carbon Budget 2022 (Version 1.0) [Data set]. Global Carbon Project. https://doi.org/10.18160/gcp-2022
  6. "Per capita greenhouse gas emissions". Our World in Data. Retrieved 2023-11-01.
  7. "China's Emissions: More Than U.S. Plus Europe, and Still Rising". The New York Times . 2018-01-25.
  8. "Chinese coal fuels rise in global carbon emissions". The Times . 2017-11-14. Retrieved 2023-09-22.
  9. PBL Netherlands Environmental Assessment Agency. "China now no. 1 in CO2 emissions; USA in second position". pbl.nl. Planbureau voor de Leefomgeving , nl. Archived from the original on 2014-08-15.
  10. Roser, Max; Ritchie, Hannah (11 May 2017). "CO2 and other Greenhouse Gas Emissions". Our World in Data. Archived from the original on 4 July 2019.
  11. Ritchie, Hannah; Roser, Max. "Per capita CO2 emissions". Our World in Data. Retrieved 2023-11-01.
  12. 1 2 3 4 Joint Research Centre (2023). "GHG emissions of all world countries". EDGAR – Emissions Database for Global Atmospheric Research. Retrieved 2023-11-01.
  13. Ritchie, Hannah; Roser, Max. "Consumption-based (trade-adjusted) emissions". Our World in Data. Retrieved 2023-11-01.
  14. Intergovernmental Panel on Climate Change (2021). Climate Change 2021 The Physical Science Basis | Summary for Policymakers (PDF). p. 40. ISBN   978-92-9169-158-6.
  15. Klugman, Cornelia. "The EU, a world leader in fighting climate change". European Parliament Think Tank. Retrieved 2023-11-01.

See also