Ethnic groups in South Africa

Last updated

Dominant population groups in South Africa.
.mw-parser-output .legend{page-break-inside:avoid;break-inside:avoid-column}.mw-parser-output .legend-color{display:inline-block;min-width:1.25em;height:1.25em;line-height:1.25;margin:1px 0;text-align:center;border:1px solid black;background-color:transparent;color:black}.mw-parser-output .legend-text{}
Africans
Coloured
White
Indian/Asian
None dominant
Little or no population South Africa 2011 dominant population group map (hex cells).svg
Dominant population groups in South Africa.
  Africans
  Coloured
  White
  Indian/Asian
  None dominant
  Little or no population

Racial groups in South Africa have a variety of origins. The racial categories introduced by Apartheid remain ingrained in South African society [1] [2] [3] [4] with South Africans and the governing party of South Africa continuing to classify themselves, and each other, as belonging to one of the four defined race groups (Blacks, Whites, Coloureds and Indians). [4] [3] Statistics South Africa asks people to describe themselves in the census in terms of five racial population groups. [5] The 2022 estimates were 81.4% Black or Indigenous South African, 7.3% White South African, 8.2% Coloured South African, and 2.7% Indian South African. [6] :21

Contents

Statistics South Africa provided five racial categories by which people could classify themselves, the last of which, "unspecified/other" drew negligible responses, and these results were omitted. [7] The 2010 midyear estimated figures for the other categories were Black at 78.4%, White at 10.2%, Coloured at 8.8%, Indian/Asian at 2.6%. [8] The first census in South Africa in 1911 showed that Whites made up 22% of the population; it declined to 16% in 1980. [9]

Black South Africans

The majority population of South Africa are those who classify themselves Black or indigenous South Africans, Africans or Black people of South Africa, but they are not culturally or linguistically homogeneous. The major ethnic parts of the group are the Zulu, Xhosa, Bapedi (North Sotho), Batswana, South Ndebele, Basotho (South Sotho), Venda, Tsonga and Swazi, all of which predominantly speak Southern Bantu languages.


Black South African ethnicity's native distribution is also found across countries neighbouring South Africa. The Basotho are the majority ethnic group of Lesotho. The Tswana ethnic group constitute the majority of the population of Botswana. The Swazi ethnic group is the majority ethnic group in Swaziland. The Tsonga ethnic group is also found in Southern Mozambique; they are also known as the Shangaan (Shangana, Shangane or Shangani).

African

Zulu people in KwaZulu-Natal Zulu Culture, KwaZulu-Natal, South Africa (20325329170).jpg
Zulu people in KwaZulu-Natal

African in South Africa refers to Black South Africans, unequivocally indigenous South Africans. It is also used to generally refer to Black people, who are expatriates in South Africa.

The Khoisan of South Africa are the minority part of indigenous South Africans that complete the context of indigenous or Black South African. Some Coloureds are now identifying themselves as Khoisan because of their mixed heritage that includes the latter, though they also draw ancestry from other African people and European people. [10]

Demographics

As of the calculations of 2004, there are 34,216,164 Black people and 8,625,050 Black households residing in South Africa. The Black population density is 29/km2. The density of Black households is 7/km2. Blacks made up 79.0% of the total population in 2011 and 81% in 2016. [11] The percentage of all Black households that are made up of individuals is 19.9%. The average Black household size is 4.11 members.[ citation needed ]

In South Africa, the Black population is spread out, with 34.0% under the age of 15, 21.6% from 15 to 24, 28.3% from 25 to 44, 11.8% from 45 to 64 and 4.3% who are 65 years of age or older. The median age of a Black South African is 21 years. For every 100 Black females there are 91.1 Black males. For every 100 Black females age 18 and over, there are 86.2 Black males. [12]

With regard to education, 22.3% of Black people aged 20 and over have received no schooling, 18.5% have had some primary, 6.9% have completed only primary school, 30.4% have had some high education, 16.8% have finished only high school and 5.2% have an education higher than the high school level. Overall, 22.0% of Black people have completed high school and 59% of Black people, aged 25 to 64, have an upper secondary education as their highest level of education. This places South Africa above the G20 average of 32% and the OECD average of 38%. [13]

The percentage of Black housing units having a telephone and/or mobile phone in the dwelling is 31.1%. The percentage having access to a nearby phone is 57.2%, and 11.7% do not have nearby access or any access. The percentage of Black households that have a flush or chemical toilet is 41.9%. Refuse is removed from 45.3% of Black households by the municipality at least once a week and 11.0% have no rubbish disposal. Some 17.9% of Africans have running water inside their dwelling, 51.7% have running water on their property and 80.2% have access to running water. The percentage of Black households using electricity for cooking is 39.3%, for heating, 37.2% and for lighting, 62.0%. Radios are owned by 68.7% of Black households while 44.2% have a television, 1.8% own a computer, 40.0% have a refrigerator and 24.6% have a mobile phone.[ citation needed ]

The unemployment rate of the Black population aged 15–65 is 28.1%. The median annual income of Black working adults aged 15–65 is ZAR 12,073. Black males have a median annual income of ZAR 14,162 versus ZAR 8,903 for Black females. [14]

Ethnic groups in South Africa
Black
80.2%
Coloured
8.8%
White
8.4%
Indian/Asian
2.5%

Coloured South Africans

The Coloured population is mainly concentrated in the Cape region, and come from a combination of ethnic backgrounds including Indigenous South Africans, Whites, Griqua and Asians. [15]

It is important to denote that this ethnicity is not by default to people of multiracial heritage in South Africa, therefore many multiracial South Africans do identify by any ethnic heritage they may be from i.e. Blacks, Whites, Asians etc., in the same matter, some people with little or no multiracial heritage do identify as a Coloured ethnic. However, during Apartheid this ethnicity was by law anyone who is of multiracial heritage or determined to be Coloured by the government. This ethnicity doesn't necessarily have an ethnic language nor of specific race but they are contemporarily South African cultured and rather stem their traditional and historical identity from the sense of community of Coloured people, e.g.Cape Coloureds. They are not all culturally or linguistically homogeneous but many from those who identify as Coloured usually speak Afrikaans as a first language.

In detail, Coloureds descend from indigenous African people (South African Bantu-speaking peoples, South African Khoisan (mostly those who lived in the Cape Peninsula) and Africans not of South African descent), Griqua multiracials, European groups (mainly Dutch and British) and Asian groups (Javanese, Malay, Indian, Malagasy and other concerned Asian ethnicities) mainly of slaves brought in South Africa. The Cape Malay (or Cape Muslim) identity, which was classified as a subgroup of Coloured by the apartheid government, was generally held to encompass people of multiracial heritage from the Cape, who practiced Islam.

San family in South Africa Bushman-family.jpg
San family in South Africa

Khoisan refers to two separate groups. The Khoikhoi, who were called Hottentots by the Europeans, were pastoralists and extensively integrated into the colonial economy, many converting early to Christianity; the San people, called Bushmen by the Europeans, were hunter-gatherers. The Khoisan groups as a minority completes the rest of the indigenous South African population and it is also found that others do not classify themselves as Black South African, African or even Black African. In the 2011 census for example, the overwhelming majority of the San community in Platfontein originating from the northern parts of Namibia and southern Angola opted to be classified as 'Other' and many from those claiming to be descendants of Namaqualand Khoikhoi classify themselves as Coloured. [10]

Within the Coloured community, more recent immigrants will also be found i.e. Coloureds from the former Rhodesia (now Zimbabwe); Namibia and immigrants of mixed descent from India (such as Anglo-Indians) who were welcomed to the Cape when India and Burma received their Independence. [16]

In 2008, the Pretoria High Court ruled that the descendants of mainland Chinese who arrived before 1994, and had been classified as a subgroup of Coloured by the apartheid government, were eligible for redress. As a result of this ruling, about 12,000–15,000 [17] ethnically Chinese citizens who arrived before 1994, numbering 3%–5% of the total Chinese population in the country, will be able to benefit from government BEE policies. [18]

Ethnic groups, 2001-2011 (Numbers are millions of people; horizontal scale is percentage of total population). Ethnic groups of South Africa, 2000-10 stats.png
Ethnic groups, 2001–2011 (Numbers are millions of people; horizontal scale is percentage of total population).

White South Africans

Afrikaners in Pretoria Fokofpolisiekar at Park Acoustics.jpg
Afrikaners in Pretoria

White people in South Africa are predominantly descendants of Dutch, German, French Huguenot, English, Portuguese and other European colonists. [15] [19] Culturally and linguistically, they are divided into Afrikaners, who speak Afrikaans, and English-speaking groups. The White population decreased in the 1990s and 2000s due to a low birth rate and emigration. As a factor in their decision to emigrate, many cite the high crime rate, affirmative action policies and racial discrimination. [20] [21] From 1994 to 2010, approximately 400,000 Whites permanently emigrated. [8] Despite high emigration levels, immigrants from Europe have settled in the country. By 2005, an estimated 212,000 British citizens were residing in South Africa. By 2011, this number may have grown to 500,000. [22] Some European Zimbabweans emigrated to South Africa. Some of the more nostalgic members of the community are known in popular culture as "Whenwes", because of their nostalgia for their lives in Rhodesia "when we were in Rhodesia". [23] White South Africans also returned in large numbers in the 2000s and 2010s. In May 2014, Homecoming Revolution estimated that around 340,000 White South Africans had returned to South Africa in the preceding decade. [24]

There have been other White immigration waves to South Africa in recent decades. In the 1970s, many Portuguese residents of African colonies such as Angola and Mozambique moved to South Africa after the independence of those nations. In addition, the apartheid government encouraged Central European immigration in the 1980s and early 1990s, particularly from Poland and Hungary. In the Near East, particularly from Turkey, Azerbaijan, and Armenia.

Demographics

As of the census of 2001, there are 4,293,638 Whites and 1,409,690 White households residing in South Africa. The White population density is 4/km2. The density of White households is 1.16/km2. Whites made up 9.6% of the total population.

The percentage of all White households that are made up of individuals is 19.1%. The average White household size is 3.05 members. In South Africa, the White population is spread out, with 19.0% under the age of 15, 15.1% from 15 to 24, 31.0% from 25 to 44, 23.8% from 45 to 64, and 11.1% who are 65 years of age or older. The median age of a White is 35 years. For every 100 White females there are 94.0 White males. For every 100 White females age 18 and over, there are 91.1 White males.

With regards to education, 1.4% of Whites aged 20 and over have received no schooling, 1.2% have had no more than some primary school education, 0.8% have only completed primary school, 25.9% have had no more than some high school education, 41.3% have finished only high school, and 29.8% have an education higher than the high-school level. Overall, 70.7% of Whites have completed high school.

The percentage of White housing units having a telephone and/or mobile phone in the dwelling is 95.4%. The percentage having access to a nearby phone is 4.4%, and 0.2% do not have nearby access or any access. The percentage of White households that have a flush or chemical toilet is 98.7%. Waste is removed from 90.8% of White households by the municipality at least once a week, and 0.5% have no rubbish disposal. Some 87.2% of White have running water inside their dwelling, 95.6% have running water on their property, and 99.4% have access to running water. The percentage of White households using electricity for cooking is 96.6%, for heating, 93.2%, and for lighting, 99.2%. Radios are owned by 94.7% of White households while 92.6% have a television, 46.0% own a computer, 97.6% have a refrigerator, and 74.6% have a mobile phone.

The unemployment rate of the White population aged 15–65 is 4.1%. The median annual income of White working adults aged 15–65 is ZAR 65,000. White males have a median annual income of ZAR 81,701 versus ZAR 52,392 for White females.[ citation needed ]

Indian South Africans

Indian Prime Minister Narendra Modi meets members of Indian community in Durban Prime Minister Narendra Modi in Durban.jpg
Indian Prime Minister Narendra Modi meets members of Indian community in Durban

Descendants of migrants from British India in the late 19th and early 20th century [15] have an estimated population of 1.2 million or 2.5% of the South African population; many of them descended from indentured workers brought in the nineteenth century to work on the sugar plantations of the eastern coastal area of Natal and adhered to different religions and spoke different languages. [15] A smaller number, called Passenger Indians came independently for work purposes and business interests at around the same time. Indians (synonymous with Asian) are regarded as one of South Africa's 4 race groups.

Chinese South Africans

There is also a significant group of Chinese South Africans (approximately over 300,000 individuals). They were classified as a subgroup of Coloured. However, Hong Kongers and Taiwanese were categorized as honorary white during apartheid, like Japanese South Africans. [25]

Smaller groups

There is a small but notable population of Lemba people who live primarily in the north eastern regions of South Africa who have Bantu and Semitic origins.

Zimbabweans, Somalis, Pakistanis and Nigerians are large migrant communities. There are also Vietnamese South Africans, Japanese, and Koreans in South Africa.

A small population of Kalderash Roma live in South Africa. [26] [27]

Population growth

Between 2009 and 2016, South Africa's population increased by 11.6% from an estimated 49.9 million to an estimated 55.7 million. [28] [29]

Population change
YearAfricanColouredWhiteIndian/AsianTotal
Pop.±% p.a.Pop.±% p.a.Pop.±% p.a.Pop.±% p.a.Pop.±% p.a.
199631,127,6313,600,4464,434,6971,045,59640,583,573
200135,416,166+2.6%3,994,505+2.1%4,293,640−3.2%1,115,467+6.7%44,819,778+10.4%
201141,000,938+1.5%4,615,401+1.5%4,586,838+6.8%1,286,930+15.4%51,770,560+15.5%
201443,333,700+1.9%4,771,500+1.1%4,554,800−0.7%1,341,900+4.3%54,002,000+4.3%

Related Research Articles

Black is a racialized classification of people, usually a political and skin color-based category for specific populations with a mid- to dark brown complexion. Not all people considered "black" have dark skin; in certain countries, often in socially based systems of racial classification in the Western world, the term "black" is used to describe persons who are perceived as dark-skinned compared to other populations. It is most commonly used for people of sub-Saharan African ancestry, Indigenous Australians and Melanesians, though it has been applied in many contexts to other groups, and is no indicator of any close ancestral relationship whatsoever. Indigenous African societies do not use the term black as a racial identity outside of influences brought by Western cultures.

<span class="mw-page-title-main">Demographics of South Africa</span>

According to the 2022 census, the population of South Africa is about 62 million people of diverse origins, cultures, languages, and religions. The South African National Census of 2022 was the most recent census held; the next will be in 2032.

<span class="mw-page-title-main">Cape Coloureds</span> Ethnic group in South Africa

Cape Coloureds are a South African ethnic classification consisting primarily of persons of mixed race African, Asian and European descent.

Mulatto is a racial classification to refer to people of mixed African and European ancestry. Its use is considered outdated and offensive in several languages, including English and Dutch. But it does not have the same associations in languages such as Italian, Spanish and Portuguese. Among Latin Americans in the US, for instance, the term can be a source of pride. A mulatta is a female mulatto.

The terms multiracial people or mixed-race people refer to people who are of more than one race, and the terms multi-ethnic people or ethnically mixed people refer to people who are of more than one ethnicity. A variety of terms have been used both historically and presently for mixed-race people in a variety of contexts, including multiethnic, polyethnic, occasionally bi-ethnic, Métis, Muwallad, Melezi, Coloured, Dougla, half-caste, ʻafakasi, mestizo, mutt, Melungeon, quadroon, octoroon, sambo/zambo, Eurasian, hapa, hāfu, Garifuna, pardo, and Gurans. A number of these once-acceptable terms are now considered offensive, in addition to those that were initially coined for pejorative use.

<span class="mw-page-title-main">Coloureds</span> Multiracial ethnic group of Southern Africa

Coloureds refers to members of multiracial ethnic communities in South Africa who may have ancestry from African, European, and Asian people. The intermixing of different races began in the Cape province of South Africa, with Dutch settlers, Bantu, and Malay slaves intermixing with the indigenous Khoi tribes of that region. Later various other European nationals also contributed to the growing mixed race people, who would later be officially classified as coloured by the apartheid government in the 1950s.

In South Africa, Asian usually refers to people of South Asian ancestry, more commonly called Indians. They are largely descended from people who migrated to South Africa in the late 19th and early 20th century from British ruled South Asia.

<span class="mw-page-title-main">Griqua people</span> Southern African ethnic group

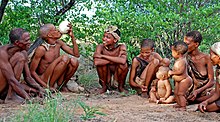
Griqua People also known as Griekwa, Chariqua, Korana or Koranna can be found in South Africa and Namibia, they are related to the Khoisan People.The name Griqua is of Khoekhoe origin. The kind Griqua representative Thys Mentoor explained the significance of the ethnonym in his mother tongue Afrikaans:

<i>Colored</i> Racial exonym

Colored is a racial descriptor historically used in the United States during the Jim Crow Era to refer to an African American. In many places, it may be considered a slur, though it has taken on a special meaning in Southern Africa referring to a person of mixed or Cape Coloured heritage.

<span class="mw-page-title-main">Population Registration Act, 1950</span> Apartheid-era South African law

The Population Registration Act of 1950 required that each inhabitant of South Africa be classified and registered in accordance with their racial characteristics as part of the system of apartheid.

<span class="mw-page-title-main">Apartheid</span> South African system of racial separation

Apartheid was a system of institutionalised racial segregation that existed in South Africa and South West Africa from 1948 to the early 1990s. Apartheid was characterised by an authoritarian political culture based on baasskap, which ensured that South Africa was dominated politically, socially, and economically by the nation's minority white population. In this minoritarian system, there was social stratification, where white citizens had the highest status, followed by Indians and Coloureds, then Black Africans. The economic legacy and social effects of apartheid continue to the present day, particularly inequality.

<span class="mw-page-title-main">Race and ethnicity in the United States</span>

The United States has a racially and ethnically diverse population. At the federal level, race and ethnicity have been categorized separately. The most recent United States census recognized five racial categories, as well as people who belong to two or more of the racial categories. The United States also recognizes the broader notion of ethnicity. The 2000 census and 2010 American Community Survey inquired about the "ancestry" of residents, while the 2020 census allowed people to enter their "origins". The Census Bureau also classified respondents as either Hispanic or Latino, identifying as an ethnicity, which comprises the minority group in the nation.

White South Africans are South Africans of European descent. In linguistic, cultural, and historical terms, they are generally divided into the Afrikaans-speaking descendants of the Dutch East India Company's original colonists, known as Afrikaners, and the Anglophone descendants of predominantly British colonists of South Africa. In 2016, 57.9% were native Afrikaans speakers, 40.2% were native English speakers, and 1.9% spoke another language as their mother tongue, such as Portuguese, Greek, or German. White South Africans are by far the largest population of White Africans. White was a legally defined racial classification during apartheid.

<span class="mw-page-title-main">Bantu peoples of South Africa</span> Ethnic descriptor in South Africa

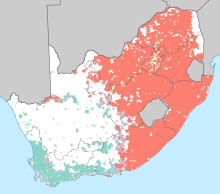
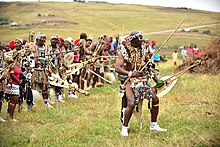
Black South Africans also known as 'South African Bantu-speaking peoples represent the majority of people in South Africa and who have lived in what is now South Africa for thousands of years as an indigenous people alongside other indigenous groups like Khoisans. Occasionally grouped as Bantu, the term itself is derived from the English word "people", common to many of the Bantu languages. The Oxford Dictionary of South African English describes "Bantu", when used in a contemporary usage or racial context as "obsolescent and offensive", because of its strong association with the "white minority rule" with their Apartheid system. However, Bantu is used without pejorative connotations in other parts of Africa and is still used in South Africa as the group term for the language family.

<span class="mw-page-title-main">Demographics of Manhattan</span>

New York County, coterminous with the New York City borough of Manhattan, is the most densely populated U.S. county, with a density of 70,825.6/mi2 (27,267.4/km2) as of 2013. In 1910, it reached a peak of 101,548/mi2 (39,222.9/km2). The county is one of the original counties of New York State.

The demographics of the Bronx are characterized by a Hispanic majority and by the lowest percentage of Whites among all boroughs.

Multiracial Americans or mixed-race Americans are Americans who have mixed ancestry of two or more races. The term may also include Americans of mixed-race ancestry who self-identify with just one group culturally and socially. In the 2020 United States census, 33.8 million individuals or 10.2% of the population, self-identified as multiracial. There is evidence that an accounting by genetic ancestry would produce a higher number.

<span class="mw-page-title-main">Youth in South Africa</span>

Youth in South Africa constituted 37% of the population in 2010, numbering 19.1 million individuals. South Africa's National Youth Commission Act, 1996, defines youth as those from ages 15-34 years. Like many other developing countries, South Africa's population as a whole is quite young. The elevated level of youth population is expected to exist for the next 20–30 years; the large proportion of working-age population presents South Africa with a time period of opportunity for human capital and economic development.

<span class="mw-page-title-main">Trinidadians and Tobagonians</span> People identified with the country of Trinidad and Tobago

Trinidadians and Tobagonians, colloquially known as Trinis or Trinbagonians, are the people who are identified with the country of Trinidad and Tobago. The country is home to people of many different national, ethnic and religious origins. As a result, Trinidadians do not equate their nationality with race and ethnicity, but with citizenship, identification with the islands as whole, or either Trinidad or Tobago specifically. Although citizens make up the majority of Trinidadians, there is a substantial number of Trinidadian expatriates, dual citizens and descendants living worldwide, chiefly elsewhere in the Anglosphere.

<span class="mw-page-title-main">Demographics of San Francisco</span>

The 2020 United States Census reported that San Francisco had a population of 873,965—an increase from the 2010 Census count of 805,235. The 2022 Census Bureau American Community Survey put the population at 808,437: a decrease of 65,528 from 2020. With a population density of 18,633 per square mile (7,194/km2), San Francisco is the second-most densely populated major American city, behind only New York.

References

  1. Rondganger, Lee (6 June 2006). "Being an African makes me who I am". IOL. Retrieved 9 March 2013.
  2. du Preez, Max (9 March 2011). "Are we all 'coloured'?". News24. Retrieved 9 March 2013.
  3. 1 2 Posel, Deborah (2001). "What's in a name? Racial categorisations under apartheid and their afterlife" (PDF). Transformation: 50–74. ISSN   0258-7696. Archived from the original (PDF) on 8 November 2006.
  4. 1 2 Pillay, Kathryn (2019). "Indian Identity in South Africa". The Palgrave Handbook of Ethnicity. pp. 77–92. doi: 10.1007/978-981-13-2898-5_9 . ISBN   978-981-13-2897-8.
  5. Lehohla, Pali (5 May 2005). "Debate over race and censuses not peculiar to SA". Business Report. Archived from the original on 14 August 2007. Retrieved 25 August 2013. Others pointed out that the repeal of the Population Registration Act in 1991 removed any legal basis for specifying 'race'. The Identification Act of 1997 makes no mention of race. On the other hand, the Employment Equity Act speaks of 'designated groups' being 'black people, women and people with disabilities'. The Act defines 'black' as referring to 'Africans, coloureds and Indians'. Apartheid and the racial identification which underpinned it explicitly linked race with differential access to resources and power. If the post-apartheid order was committed to remedying this, race would have to be included in surveys and censuses, so that progress in eradicating the consequences of apartheid could be measured and monitored. This was the reasoning that led to a 'self-identifying' question about 'race' or 'population group' in both the 1996 and 2001 population censuses, and in Statistics SA's household survey programme.
  6. Census 2011: Census in brief (PDF). Pretoria: Statistics South Africa. 2012. ISBN   9780621413885 . Retrieved 21 February 2017.
  7. Census 2001 Archived 10 August 2007 at the Wayback Machine , Statistics South Africa.
  8. 1 2 "Midyear population estimates: 2010" (PDF). Statistics South Africa. Retrieved 23 July 2010.
  9. South Africa: time running out : the report of the Study Commission on U.S. Policy Toward Southern Africa. University of California Press. 1981. p. 42. ISBN   0-520-04547-5.
  10. 1 2 "Platfontein 2011 census results".
  11. "StatsSA" (PDF). StatsSA. Retrieved 14 February 2021.
  12. Adams, Byron G.; Van de Vijver, Fons J.R.; De Bruin, Gideon P. (May 2012). "Identity in South Africa: Examining self-descriptions across ethnic groups". International Journal of Intercultural Relations. 36 (3): 377–388. doi:10.1016/j.ijintrel.2011.11.008. ISSN   0147-1767.
  13. “Education at a Glance: South Africa”. OECD. 2019. https://www.oecd.org/education/education-at-a-glance/EAG2019_CN_ZAF.pdf
  14. "Unemployment, race and poverty in South Africa". Archived from the original on 18 November 2019. Retrieved 16 April 2014.
  15. 1 2 3 4 Kristin Henrard (2002). Minority Protection in Post-Apartheid South Africa: Human Rights, Minority Rights, and Self-Determination. Greenwood Publishing Group. p. 43. ISBN   978-0-275-97353-7.
  16. Suttner, Raymond (November 2009). "The Zuma Era – Its Historical Context and the Future". African Historical Review. 41 (2): 28–59. doi:10.1080/17532521003607286. ISSN   1753-2523. S2CID   144543571.
  17. Conason, Joe (19 June 2008). "Chinese declared black". Salon.com. Retrieved 30 May 2010.
  18. We agree that you are black, South African court tells Chinese, The Times
  19. James L. Gibson; Amanda Gouws (2005). Overcoming Intolerance in South Africa: Experiments in Democratic Persuasion. Cambridge University Press. p. 36. ISBN   978-0-521-67515-4.
  20. "The New Great Trek – The Story of South Africa's White Exodus". Unisa.ac.za. Retrieved 30 October 2011.
  21. "Policy Series". Queensu.ca. 7 October 1997. Archived from the original on 29 October 2011. Retrieved 30 October 2011.
  22. "Britons living in SA to enjoy royal wedding". Eyewitness News. 28 April 2011. Archived from the original on 21 January 2012.
  23. "Rhodie oldies". New Internationalist . 1985. Archived from the original on 4 September 2009. Retrieved 29 October 2007.
  24. Jane Flanagan (3 May 2014). "Why white South Africans are coming home". Bbc.co.uk. Archived from the original on 3 May 2014. Retrieved 15 January 2016.
  25. Kim, Young-Chan (20 January 2017). China and Africa: A New Paradigm of Global Business. Springer. p. 84. ISBN   9783319470306.
  26. Chesterton, G. K. (March 2022). Orthodoxy. B&H Publishing. ISBN   978-1-5359-9568-9. OCLC   1299383669.
  27. Historical Dictionary of the Gypsies (Romanies) (PDF). p. 258.
  28. Johnson, Leigh F.; May, Margaret T.; Dorrington, Rob E.; Cornell, Morna; Boulle, Andrew; Egger, Matthias; Davies, Mary-Ann (12 December 2017). "Estimating the impact of antiretroviral treatment on adult mortality trends in South Africa: A mathematical modelling study". PLOS Medicine. 14 (12): e1002468. doi: 10.1371/journal.pmed.1002468 . ISSN   1549-1676. PMC   5726614 . PMID   29232366.
  29. Osman, Muhammad; van Schalkwyk, Cari; Naidoo, Pren; Seddon, James A.; Dunbar, Rory; Dlamini, Sicelo S.; Welte, Alex; Hesseling, Anneke C.; Claassens, Mareli M. (5 August 2021). "Mortality during tuberculosis treatment in South Africa using an 8-year analysis of the national tuberculosis treatment register". Scientific Reports. 11 (1): 15894. Bibcode:2021NatSR..1115894O. doi:10.1038/s41598-021-95331-w. ISSN   2045-2322. PMC   8342475 . PMID   34354135. S2CID   236933396.