Internal standard

Last updated

In a chemical analysis, the internal standard method involves adding the same amount of a chemical substance to each sample and calibration solution. The internal standard responds proportionally to changes in the analyte and provides a similar, but not identical, measurement signal. It must also be absent from the sample matrix to ensure there is no other source of the internal standard present. Taking the ratio of analyte signal to internal standard signal and plotting it against the analyte concentrations in the calibration solutions will result in a calibration curve. The calibration curve can then be used to calculate the analyte concentration in an unknown sample. [1]

Contents

Selecting an appropriate internal standard accounts for random and systematic sources of uncertainty that arise during sample preparation or instrument fluctuation. This is because the ratio of analyte relative to the amount of internal standard is independent of these variations. If the measured value of the analyte is erroneously shifted above or below the actual value, the internal standard measurements should shift in the same direction. [1]

Ratio plot provides good way of compensation of detector sensitivity variation, but may be biased and should be replaced by Relative concentration/Relative calibration calculations if the reason of response variability is in different mass of analysed sample and traditional (not internal standard) calibration curve of any analyte is not linear through origin. [2]

History

The earliest recorded use of the internal standard method dates back to Gouy's flame spectroscopy work in 1877, where he used an internal standard to determine if the excitation in his flame was consistent. [3] [4] His experimental procedure was later reintroduced in the 1940s, when recording flame photometers became readily available. [3] The use of internal standards continued to grow, being applied to a wide range of analytical techniques including nuclear magnetic resonance (NMR) spectroscopy, chromatography, and inductively coupled plasma spectroscopy.

Applications

Nuclear magnetic resonance spectroscopy

In NMR spectroscopy, e.g. of the nuclei 1H, 13C and 29Si, frequencies depend on the magnetic field, which is not the same across all experiments. Therefore, frequencies are reported as relative differences to tetramethylsilane (TMS), an internal standard that George Tiers proposed in 1958 and that the International Union of Pure and Applied Chemistry has since endorsed. [5] [6] The relative difference to TMS is called chemical shift. [7]

TMS works as an ideal standard because it is relatively inert and its identical methyl protons produce a strong upfield signal, isolated from most other protons. [7] It is soluble in most organic solvents and is removable via distillation due to its low boiling point. [1]

In practice, the difference between the signals of common solvents and TMS are known. Therefore, no TMS needs to be added to commercial deuterated solvents, as modern instruments are capable of detecting the small quantities of protonated solvent present. By specifying the lock solvent to be used, modern spectrometers are able to correctly reference the sample; in effect, the solvent itself serves as the internal standard. [1]

Chromatography

In chromatography, internal standards are used to determine the concentration of other analytes by calculating response factor. The selected internal standard should have a similar retention time and derivatization. It must be stable and not interfere with the sample components. This mitigates the uncertainty that can occur in preparatory steps such as sample injection. [1]

In gas chromatography-mass spectrometry (GC-MS), deuterated compounds with similar structures to the analyte commonly act as effective internal standards. [8] However, there are non-deuterated internal standards such as norleucine, which is popular in the analysis of amino acids because it can be separated from accompanying peaks. [9] [10] [11]

Selecting an internal standard for liquid chromatography-mass spectrometry (LC-MS) depends on the employed ionization method. The internal standard needs a comparable ionization response and fragmentation pattern to the analyte. [12] LC-MS internal standards are often isotopically analogous to the structure of the analyte, using isotopes such as deuterium (2H), 13C, 15N and 18O. [13]

Inductively coupled plasma

Selecting an internal standard in inductively coupled plasma spectroscopy can be difficult, because signals from the sample matrix can overlap with those belonging to the analyte. Yttrium is a common internal standard that is naturally absent in most samples. It has both a mid-range mass and emission lines that don't interfere with many analytes. The intensity of the yttrium signal is what the signal from the analyte gets compared to. [1] [14]

In Inductively coupled plasma-mass spectrometry (ICP-MS), species with a similar mass to the analyte usually serve as good internal standards, though not in every case. Factors that also contribute to the effectiveness of an internal standard in ICP-MS include how close its ionization potential, change in enthalpy, and change in entropy are to the analyte. [15]

Inductively coupled plasma-optical emission spectroscopy (ICP-OES) internal standards can be selected by observing how the analyte and internal standard signals change with varying experimental conditions. This includes making adjustments to the sample matrix or instrumentation settings and evaluating whether the selected internal standard is reacting in the same way the analyte is. [16]

Example of internal standard method

Spreadsheet for worked-example of plotting nickel concentrations in calibration solutions. The calibration curve on the top does not use the internal standard method. The calibration curve on the bottom does use the internal standard method. Internal Standard Example - Revised.png
Spreadsheet for worked-example of plotting nickel concentrations in calibration solutions. The calibration curve on the top does not use the internal standard method. The calibration curve on the bottom does use the internal standard method.

One way to visualize the internal standard method is to create one calibration curve that doesn't use the method and one calibration curve that does. Suppose there are known concentrations of nickel in a set of calibration solutions: 0 ppm, 1.6 ppm, 3.2 ppm, 4.8 ppm, 6.4 ppm, and 8 ppm. Each solution also has 5 ppm yttrium to act as an internal standard. If these solutions are measured using ICP-OES, the intensity of the yttrium signal should be consistent across all solutions. If not, the intensity of the nickel signal is likely imprecise as well.

The calibration curve that does not use the internal standard method ignores the uncertainty between measurements. The coefficient of determination (R2) for this plot is 0.9985.

In the calibration curve that uses the internal standard, the y-axis is the ratio of the nickel signal to the yttrium signal. This ratio is unaffected by uncertainty in the nickel measurements, as it should affect the yttrium measurements in the same way. This results in a higher R2, 0.9993.

Related Research Articles

<span class="mw-page-title-main">Analytical chemistry</span> Study of the separation, identification, and quantification of matter

Analytical chemistry studies and uses instruments and methods to separate, identify, and quantify matter. In practice, separation, identification or quantification may constitute the entire analysis or be combined with another method. Separation isolates analytes. Qualitative analysis identifies analytes, while quantitative analysis determines the numerical amount or concentration.

<span class="mw-page-title-main">Inductively coupled plasma mass spectrometry</span> Type of mass spectrometry that uses an inductively coupled plasma to ionize the sample

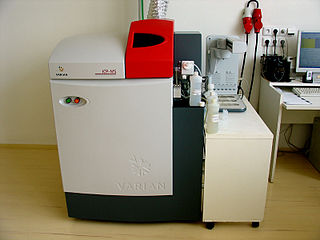
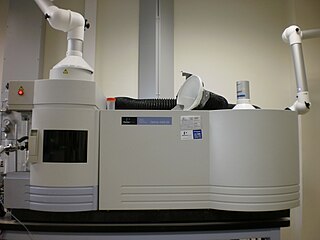
Inductively coupled plasma mass spectrometry (ICP-MS) is a type of mass spectrometry that uses an inductively coupled plasma to ionize the sample. It atomizes the sample and creates atomic and small polyatomic ions, which are then detected. It is known and used for its ability to detect metals and several non-metals in liquid samples at very low concentrations. It can detect different isotopes of the same element, which makes it a versatile tool in isotopic labeling.

<span class="mw-page-title-main">Mass spectrometry</span> Analytical technique based on determining mass to charge ratio of ions

Mass spectrometry (MS) is an analytical technique that is used to measure the mass-to-charge ratio of ions. The results are presented as a mass spectrum, a plot of intensity as a function of the mass-to-charge ratio. Mass spectrometry is used in many different fields and is applied to pure samples as well as complex mixtures.

<span class="mw-page-title-main">Ion source</span> Device that creates charged atoms and molecules (ions)

An ion source is a device that creates atomic and molecular ions. Ion sources are used to form ions for mass spectrometers, optical emission spectrometers, particle accelerators, ion implanters and ion engines.

<span class="mw-page-title-main">Calibration curve</span> Method for determining the concentration of a substance in an unknown sample

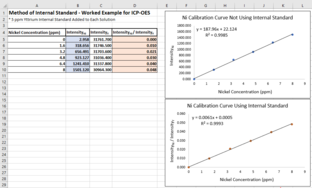
In analytical chemistry, a calibration curve, also known as a standard curve, is a general method for determining the concentration of a substance in an unknown sample by comparing the unknown to a set of standard samples of known concentration. A calibration curve is one approach to the problem of instrument calibration; other standard approaches may mix the standard into the unknown, giving an internal standard. The calibration curve is a plot of how the instrumental response, the so-called analytical signal, changes with the concentration of the analyte.

<span class="mw-page-title-main">Gas chromatography</span> Type of chromatography

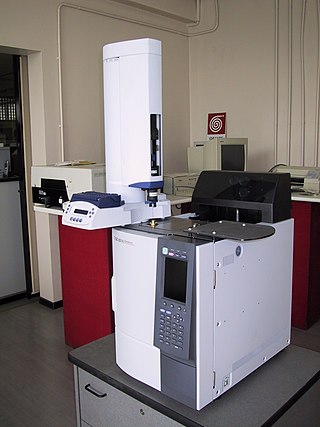
Gas chromatography (GC) is a common type of chromatography used in analytical chemistry for separating and analyzing compounds that can be vaporized without decomposition. Typical uses of GC include testing the purity of a particular substance, or separating the different components of a mixture. In preparative chromatography, GC can be used to prepare pure compounds from a mixture.

Gold fingerprinting is a method of identifying an item made of gold based on the impurities or trace elements it contains.

In nuclear magnetic resonance (NMR) spectroscopy, the chemical shift is the resonant frequency of an atomic nucleus relative to a standard in a magnetic field. Often the position and number of chemical shifts are diagnostic of the structure of a molecule. Chemical shifts are also used to describe signals in other forms of spectroscopy such as photoemission spectroscopy.

<span class="mw-page-title-main">Nuclear magnetic resonance spectroscopy</span> Laboratory technique

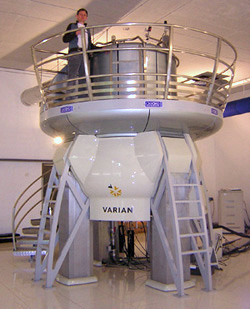
Nuclear magnetic resonance spectroscopy, most commonly known as NMR spectroscopy or magnetic resonance spectroscopy (MRS), is a spectroscopic technique based on re-orientation of atomic nuclei with non-zero nuclear spins in an external magnetic field. This re-orientation occurs with absorption of electromagnetic radiation in the radio frequency region from roughly 4 to 900 MHz, which depends on the isotopic nature of the nucleus and increased proportionally to the strength of the external magnetic field. Notably, the resonance frequency of each NMR-active nucleus depends on its chemical environment. As a result, NMR spectra provide information about individual functional groups present in the sample, as well as about connections between nearby nuclei in the same molecule. As the NMR spectra are unique or highly characteristic to individual compounds and functional groups, NMR spectroscopy is one of the most important methods to identify molecular structures, particularly of organic compounds.

Graphite furnace atomic absorption spectroscopy (GFAAS), also known as electrothermal atomic absorption spectroscopy (ETAAS), is a type of spectrometry that uses a graphite-coated furnace to vaporize the sample. Briefly, the technique is based on the fact that free atoms will absorb light at frequencies or wavelengths characteristic of the element of interest. Within certain limits, the amount of light absorbed can be linearly correlated to the concentration of analyte present. Free atoms of most elements can be produced from samples by the application of high temperatures. In GFAAS, samples are deposited in a small graphite or pyrolytic carbon coated graphite tube, which can then be heated to vaporize and atomize the analyte. The atoms absorb ultraviolet or visible light and make transitions to higher electronic energy levels. Applying the Beer-Lambert law directly in AA spectroscopy is difficult due to variations in the atomization efficiency from the sample matrix, and nonuniformity of concentration and path length of analyte atoms. Concentration measurements are usually determined from a working curve after calibrating the instrument with standards of known concentration. The main advantages of the graphite furnace comparing to aspiration atomic absorption are the following:

<span class="mw-page-title-main">Atmospheric-pressure chemical ionization</span> Ionization method

Atmospheric pressure chemical ionization (APCI) is an ionization method used in mass spectrometry which utilizes gas-phase ion-molecule reactions at atmospheric pressure (105 Pa), commonly coupled with high-performance liquid chromatography (HPLC). APCI is a soft ionization method similar to chemical ionization where primary ions are produced on a solvent spray. The main usage of APCI is for polar and relatively less polar thermally stable compounds with molecular weight less than 1500 Da. The application of APCI with HPLC has gained a large popularity in trace analysis detection such as steroids, pesticides and also in pharmacology for drug metabolites.

<span class="mw-page-title-main">Proton nuclear magnetic resonance</span> NMR via protons, hydrogen-1 nuclei

Proton nuclear magnetic resonance is the application of nuclear magnetic resonance in NMR spectroscopy with respect to hydrogen-1 nuclei within the molecules of a substance, in order to determine the structure of its molecules. In samples where natural hydrogen (H) is used, practically all the hydrogen consists of the isotope 1H.

<span class="mw-page-title-main">Inductively coupled plasma atomic emission spectroscopy</span> Analytic scientific technique

Inductively coupled plasma atomic emission spectroscopy (ICP-AES), also referred to as inductively coupled plasma optical emission spectroscopy (ICP-OES), is an analytical technique used for the detection of chemical elements. It is a type of emission spectroscopy that uses the inductively coupled plasma to produce excited atoms and ions that emit electromagnetic radiation at wavelengths characteristic of a particular element. The plasma is a high temperature source of ionised source gas. The plasma is sustained and maintained by inductive coupling from electrical coils at megahertz frequencies. The source temperature is in the range from 6000 to 10,000 K. The intensity of the emissions from various wavelengths of light are proportional to the concentrations of the elements within the sample.

The Standard addition method, often used in analytical chemistry, quantifies the analyte present in an unknown. This method is useful for analyzing complex samples where a matrix effect interferes with the analyte signal. In comparison to the calibration curve method, the standard addition method has the advantage of the matrices of the unknown and standards being nearly identical. This minimizes the potential bias arising from the matrix effect when determining the concentration.

Deuterated chloroform, also known as chloroform-d, is the organic compound with the formula CDCl3. Deuterated chloroform is a common solvent used in NMR spectroscopy. The properties of CDCl3 and ordinary CHCl3 (chloroform) are virtually identical.

<span class="mw-page-title-main">Thermospray</span>

Thermospray is a soft ionization source by which a solvent flow of liquid sample passes through a very thin heated column to become a spray of fine liquid droplets. As a form of atmospheric pressure ionization in mass spectrometry these droplets are then ionized via a low-current discharge electrode to create a solvent ion plasma. A repeller then directs these charged particles through the skimmer and acceleration region to introduce the aerosolized sample to a mass spectrometer. It is particularly useful in liquid chromatography-mass spectrometry (LC-MS).

Sample preparation for mass spectrometry is used for the optimization of a sample for analysis in a mass spectrometer (MS). Each ionization method has certain factors that must be considered for that method to be successful, such as volume, concentration, sample phase, and composition of the analyte solution. Quite possibly the most important consideration in sample preparation is knowing what phase the sample must be in for analysis to be successful. In some cases the analyte itself must be purified before entering the ion source. In other situations, the matrix, or everything in the solution surrounding the analyte, is the most important factor to consider and adjust. Often, sample preparation itself for mass spectrometry can be avoided by coupling mass spectrometry to a chromatography method, or some other form of separation before entering the mass spectrometer. In some cases, the analyte itself must be adjusted so that analysis is possible, such as in protein mass spectrometry, where usually the protein of interest is cleaved into peptides before analysis, either by in-gel digestion or by proteolysis in solution.

<span class="mw-page-title-main">Atomic emission spectroscopy</span> Analytical method using radiation to identify chemical elements in a sample

Atomic emission spectroscopy (AES) is a method of chemical analysis that uses the intensity of light emitted from a flame, plasma, arc, or spark at a particular wavelength to determine the quantity of an element in a sample. The wavelength of the atomic spectral line in the emission spectrum gives the identity of the element while the intensity of the emitted light is proportional to the number of atoms of the element. The sample may be excited by various methods.

Ion suppression in LC-MS and LC-MS/MS refers to reduced detector response, or signal:noise as a manifested effect of competition for ionisation efficiency in the ionisation source, between the analyte(s) of interest and other endogenous or exogenous species which have not been removed from the sample matrix during sample preparation. Ion suppression is not strictly a problem unless interfering compounds elute at the same time as the analyte of interest. In cases where ion suppressing species do co-elute with an analyte, the effects on the important analytical parameters including precision, accuracy and limit of detection can be extensive, severely limiting the validity of an assay's results.

The term "lignin characterization" refers to a group of activities within lignin research aiming at describing the characteristics of a lignin by determination of its most important properties. Most often, this term is used to describe the characterization of technical lignins by means of chemical or thermo-chemical analysis. Technical lignins are lignins isolated from various biomasses during various kinds of technical processes such as wood pulping. The most common technical lignins include lignosulphonates, kraft lignins, organosolv lignins, soda lignins and lignin residue after enzymatic treatment of biomass.

References

  1. 1 2 3 4 5 6 Skoog, Douglas A. (2018). Principles of instrumental analysis. F. James Holler, Stanley R. Crouch (7th ed.). Australia: Cengage Learning. ISBN   978-1-305-57721-3. OCLC   986919158.
  2. Kalambet, Yuri; Kozmin, Yuri (18 December 2018). "Internal standard arithmetic implemented as relative concentration/relative calibration". Journal of Chemometrics. 33 (6): 1–7. doi:10.1002/cem.3106.
  3. 1 2 Burns, D. Thorburn; Walker, Michael J. (2019-05-01). "Origins of the method of standard additions and of the use of an internal standard in quantitative instrumental chemical analyses". Analytical and Bioanalytical Chemistry. 411 (13): 2749–2753. doi:10.1007/s00216-019-01754-w. ISSN   1618-2650. PMC   6522454 . PMID   30941480.
  4. Gouy, M. (1880). "Recherches photométriques sur les flammes colorée". Journal de Physique Théorique et Appliquée (in French). 9 (1): 19–27. doi:10.1051/jphystap:01880009001901. ISSN   0368-3893. S2CID   178492346.
  5. Tiers, George Van Dyke (1958-09-01). "Reliable Proton Nuclear Resonance Shielding Values by "Internal Referencing" with Tetramethyl-silane". The Journal of Physical Chemistry. 62 (9): 1151–1152. doi:10.1021/j150567a041. ISSN   0022-3654.
  6. Harris, Robin K.; Becker, Edwin D.; Cabral de Menezes, Sonia M.; Goodfellow, Robin; Granger, Pierre (2001-01-01). "NMR nomenclature. Nuclear spin properties and conventions for chemical shifts(IUPAC Recommendations 2001)". Pure and Applied Chemistry. 73 (11): 1795–1818. doi: 10.1351/pac200173111795 . ISSN   1365-3075. S2CID   95765050.
  7. 1 2 Guzman, Alexander L.; Hoye, Thomas R. (2022-01-21). "TMS is Superior to Residual C H Cl 3 for Use as the Internal Reference for Routine 1 H NMR Spectra Recorded in CDCl 3". The Journal of Organic Chemistry. 87 (2): 905–909. doi:10.1021/acs.joc.1c02590. ISSN   0022-3263. PMID   34974707. S2CID   245651135.
  8. Unice, Kenneth M.; Kreider, Marisa L.; Panko, Julie M. (2012-11-08). "Use of a Deuterated Internal Standard with Pyrolysis-GC/MS Dimeric Marker Analysis to Quantify Tire Tread Particles in the Environment". International Journal of Environmental Research and Public Health. 9 (11): 4033–4055. doi: 10.3390/ijerph9114033 . ISSN   1660-4601. PMC   3524611 . PMID   23202830.
  9. Fico, D.; Margapoti, E.; Pennetta, A.; De Benedetto, G. E. (2018-04-01). "An Enhanced GC/MS Procedure for the Identification of Proteins in Paint Microsamples". Journal of Analytical Methods in Chemistry. 2018: e6032084. doi: 10.1155/2018/6032084 . ISSN   2090-8865. PMC   5902064 . PMID   29805835.
  10. Pons, Alexandre; Richet, Colette; Robbe, Catherine; Herrmann, Annkatrin; Timmerman, Philippe; Huet, Guillemette; Leroy, Yves; Carlstedt, Ingemar; Capon, Calliope; Zanetta, Jean-Pierre (2003-07-01). "Sequential GC/MS Analysis of Sialic Acids, Monosaccharides, and Amino Acids of Glycoproteins on a Single Sample as Heptafluorobutyrate Derivatives". Biochemistry. 42 (27): 8342–8353. doi:10.1021/bi034250e. ISSN   0006-2960. PMID   12846583.
  11. Harduf, Z.; Bielorai, R.; Alumot, E. (1977-09-11). "Norleucine —an internal standard for the basic column used in physiological amino acid analysis". Journal of Chromatography A. 139 (1): 215–217. doi:10.1016/S0021-9673(01)84148-0. ISSN   0021-9673. PMID   893614.
  12. "Internal Standard an Important Analyte Use in Drug Analysis by Liquid Chromatography Mass Spectrometry- An Article". International Journal of Pharmaceutical and Bio Medical Science. 2022-01-13. doi: 10.47191/ijpbms/v2-i1-02 . S2CID   245957199.
  13. Grocholska, Paulina; Bąchor, Remigiusz (2021-05-18). "Trends in the Hydrogen−Deuterium Exchange at the Carbon Centers. Preparation of Internal Standards for Quantitative Analysis by LC-MS". Molecules. 26 (10): 2989. doi: 10.3390/molecules26102989 . ISSN   1420-3049. PMC   8157363 . PMID   34069879.
  14. Zachariadis, G. A.; Vogiatzis, C. (2010-05-17). "An Overview of the Use of Yttrium for Internal Standardization in Inductively Coupled Plasma–Atomic Emission Spectrometry". Applied Spectroscopy Reviews. 45 (3): 220–239. Bibcode:2010ApSRv..45..220Z. doi:10.1080/05704921003719122. ISSN   0570-4928. S2CID   98458774.
  15. Finley-Jones, Haley J.; Molloy, John L.; Holcombe, James A. (2008-08-06). "Choosing internal standards based on a multivariate analysis approach with ICP(TOF)MS". Journal of Analytical Atomic Spectrometry. 23 (9): 1214–1222. doi:10.1039/B804048F. ISSN   1364-5544.
  16. Sedcole, J. R.; Lee, J.; Pritchard, M. W. (1986-01-01). "Internal standard selection in the presence of matrix interactions in an inductively coupled argon plasma optimised for simultaneous multielement analysis by atomic emission spectrometry". Spectrochimica Acta Part B: Atomic Spectroscopy. 41 (3): 227–235. Bibcode:1986AcSpe..41..227S. doi:10.1016/0584-8547(86)80162-8. ISSN   0584-8547.