Optical spectrometer

Last updated
Grating spectrometer schematic Spectrometer.svg
Grating spectrometer schematic
Internal structure of a grating spectrometer: Light comes from left side and diffracts on the upper middle reflective grating. The wavelength of light is then selected by the slit on the upper right corner. Simple grating spectrometer inside.jpg
Internal structure of a grating spectrometer: Light comes from left side and diffracts on the upper middle reflective grating. The wavelength of light is then selected by the slit on the upper right corner.

An optical spectrometer (spectrophotometer, spectrograph or spectroscope) is an instrument used to measure properties of light over a specific portion of the electromagnetic spectrum, typically used in spectroscopic analysis to identify materials. [1] The variable measured is most often the irradiance of the light but could also, for instance, be the polarization state. The independent variable is usually the wavelength of the light or a closely derived physical quantity, such as the corresponding wavenumber or the photon energy, in units of measurement such as centimeters, reciprocal centimeters, or electron volts, respectively.

Contents

A spectrometer is used in spectroscopy for producing spectral lines and measuring their wavelengths and intensities. Spectrometers may operate over a wide range of non-optical wavelengths, from gamma rays and X-rays into the far infrared. If the instrument is designed to measure the spectrum on an absolute scale rather than a relative one, then it is typically called a spectrophotometer. The majority of spectrophotometers are used in spectral regions near the visible spectrum.

A spectrometer that is calibrated for measurement of the incident optical power is called a spectroradiometer. [2]

In general, any particular instrument will operate over a small portion of this total range because of the different techniques used to measure different portions of the spectrum. Below optical frequencies (that is, at microwave and radio frequencies), the spectrum analyzer is a closely related electronic device.

Spectrometers are used in many fields. For example, they are used in astronomy to analyze the radiation from objects and deduce their chemical composition. The spectrometer uses a prism or a grating to spread the light into a spectrum. This allows astronomers to detect many of the chemical elements by their characteristic spectral lines. These lines are named for the elements which cause them, such as the hydrogen alpha, beta, and gamma lines. A glowing object will show bright spectral lines. Dark lines are made by absorption, for example by light passing through a gas cloud, and these absorption lines can also identify chemical compounds. Much of our knowledge of the chemical makeup of the universe comes from spectra.

Spectroscopes

Spectroscope
Spektrometr.jpg
Other namesSpectrograph
Related items Mass spectrograph
Comparison of different diffraction based spectrometers: Reflection optics, refraction optics, fiber/integrated optics Optical spectrometers.png
Comparison of different diffraction based spectrometers: Reflection optics, refraction optics, fiber/integrated optics

Spectroscopes are often used in astronomy and some branches of chemistry. Early spectroscopes were simply prisms with graduations marking wavelengths of light. Modern spectroscopes generally use a diffraction grating, a movable slit, and some kind of photodetector, all automated and controlled by a computer. Recent advances have seen increasing reliance of computational algorithms in a range of miniaturised spectrometers without diffraction gratings, for example, through the use of quantum dot-based filter arrays on to a CCD chip [3] or a series of photodetectors realised on a single nanostructure. [4]

Joseph von Fraunhofer developed the first modern spectroscope by combining a prism, diffraction slit and telescope in a manner that increased the spectral resolution and was reproducible in other laboratories. Fraunhofer also went on to invent the first diffraction spectroscope. [5] Gustav Robert Kirchhoff and Robert Bunsen discovered the application of spectroscopes to chemical analysis and used this approach to discover caesium and rubidium. [6] [7] Kirchhoff and Bunsen's analysis also enabled a chemical explanation of stellar spectra, including Fraunhofer lines. [8]

When a material is heated to incandescence it emits light that is characteristic of the atomic makeup of the material. Particular light frequencies give rise to sharply defined bands on the scale which can be thought of as fingerprints. For example, the element sodium has a very characteristic double yellow band known as the Sodium D-lines at 588.9950 and 589.5924 nanometers, the color of which will be familiar to anyone who has seen a low pressure sodium vapor lamp.

In the original spectroscope design in the early 19th century, light entered a slit and a collimating lens transformed the light into a thin beam of parallel rays. The light then passed through a prism (in hand-held spectroscopes, usually an Amici prism) that refracted the beam into a spectrum because different wavelengths were refracted different amounts due to dispersion. This image was then viewed through a tube with a scale that was transposed upon the spectral image, enabling its direct measurement.

With the development of photographic film, the more accurate spectrograph was created. It was based on the same principle as the spectroscope, but it had a camera in place of the viewing tube. In recent years, the electronic circuits built around the photomultiplier tube have replaced the camera, allowing real-time spectrographic analysis with far greater accuracy. Arrays of photosensors are also used in place of film in spectrographic systems. Such spectral analysis, or spectroscopy, has become an important scientific tool for analyzing the composition of unknown material and for studying astronomical phenomena and testing astronomical theories.

In modern spectrographs in the UV, visible, and near-IR spectral ranges, the spectrum is generally given in the form of photon number per unit wavelength (nm or μm), wavenumber (μm−1, cm−1), frequency (THz), or energy (eV), with the units indicated by the abscissa. In the mid- to far-IR, spectra are typically expressed in units of Watts per unit wavelength (μm) or wavenumber (cm−1). In many cases, the spectrum is displayed with the units left implied (such as "digital counts" per spectral channel).

A comparison of the four abscissa types typically used for visible spectrometers. Units visible spectrum.png
A comparison of the four abscissa types typically used for visible spectrometers.
A comparison of the four abscissa types typically used for infrared spectrometers. Units IR spectrum.png
A comparison of the four abscissa types typically used for infrared spectrometers.

In Gemology

Gemologists frequently use spectroscopes to determine the absorption spectra of gemstones, thereby allowing them to make inferences about what kind of gem they are examining. [9] A gemologist may compare the absorption spectrum they observe with a catalogue of spectra for various gems to help narrow down the exact identity of the gem.

Spectrographs

A very simple spectroscope based on a prism Simple spectroscope.jpg
A very simple spectroscope based on a prism
The KMOS spectrograph. The KMOS spectrograph before shipping to Chile.jpg
The KMOS spectrograph.
Horizontal Solar Spectrograph at the Czech Astronomical Institute in Ondrejov, Czech Republic Solar Spectrograph 2, Ondrejov Astronomical.jpg
Horizontal Solar Spectrograph at the Czech Astronomical Institute in Ondřejov, Czech Republic

A spectrograph is an instrument that separates light by its wavelengths and records this data. [11] A spectrograph typically has a multi-channel detector system or camera that detects and records the spectrum of light. [11] [12]

The term was first used in 1876 by Dr. Henry Draper when he invented the earliest version of this device, and which he used to take several photographs of the spectrum of Vega. This earliest version of the spectrograph was cumbersome to use and difficult to manage. [13]

There are several kinds of machines referred to as spectrographs, depending on the precise nature of the waves. The first spectrographs used photographic paper as the detector. The plant pigment phytochrome was discovered using a spectrograph that used living plants as the detector. More recent spectrographs use electronic detectors, such as CCDs which can be used for both visible and UV light. The exact choice of detector depends on the wavelengths of light to be recorded.

A spectrograph is sometimes called polychromator, as an analogy to monochromator.

Stellar and solar spectrograph

The star spectral classification and discovery of the main sequence, Hubble's law and the Hubble sequence were all made with spectrographs that used photographic paper. James Webb Space Telescope contains both a near-infrared spectrograph (NIRSpec) and a mid-infrared spectrograph (MIRI).

Echelle spectrograph

An Echelle spectrograph uses two diffraction gratings, rotated 90 degrees with respect to each other and placed close to one another. Therefore, an entrance point and not a slit is used and a CCD-chip records the spectrum. Both gratings have a wide spacing, and one is blazed so that only the first order is visible and the other is blazed with many higher orders visible, so a very fine spectrum is presented to the CCD.

Slitless spectrograph

In conventional spectrographs, a slit is inserted into the beam to limit the image extent in the dispersion direction. A slitless spectrograph omits the slit; this results in images that convolve the image information with spectral information along the direction of dispersion. If the field is not sufficiently sparse, then spectra from different sources in the image field will overlap. The trade is that slitless spectrographs can produce spectral images much more quickly than scanning a conventional spectrograph. That is useful in applications such as solar physics where time evolution is important.

See also

Related Research Articles

<span class="mw-page-title-main">Spectroscopy</span> Study involving matter and electromagnetic radiation

Spectroscopy is the field of study that measures and interprets electromagnetic spectra. In narrower contexts, spectroscopy is the precise study of color as generalized from visible light to all bands of the electromagnetic spectrum.

Fourier-transform spectroscopy is a measurement technique whereby spectra are collected based on measurements of the coherence of a radiative source, using time-domain or space-domain measurements of the radiation, electromagnetic or not. It can be applied to a variety of types of spectroscopy including optical spectroscopy, infrared spectroscopy, nuclear magnetic resonance (NMR) and magnetic resonance spectroscopic imaging (MRSI), mass spectrometry and electron spin resonance spectroscopy.

<span class="mw-page-title-main">Ultraviolet–visible spectroscopy</span> Range of spectroscopic analysis

Ultraviolet (UV) spectroscopy or ultraviolet–visible (UV–VIS) spectrophotometry refers to absorption spectroscopy or reflectance spectroscopy in part of the ultraviolet and the full, adjacent visible regions of the electromagnetic spectrum. Being relatively inexpensive and easily implemented, this methodology is widely used in diverse applied and fundamental applications. The only requirement is that the sample absorb in the UV-Vis region, i.e. be a chromophore. Absorption spectroscopy is complementary to fluorescence spectroscopy. Parameters of interest, besides the wavelength of measurement, are absorbance (A) or transmittance (%T) or reflectance (%R), and its change with time.

<span class="mw-page-title-main">Emission spectrum</span> Frequencies of light emitted by atoms or chemical compounds

The emission spectrum of a chemical element or chemical compound is the spectrum of frequencies of electromagnetic radiation emitted due to electrons making a transition from a high energy state to a lower energy state. The photon energy of the emitted photons is equal to the energy difference between the two states. There are many possible electron transitions for each atom, and each transition has a specific energy difference. This collection of different transitions, leading to different radiated wavelengths, make up an emission spectrum. Each element's emission spectrum is unique. Therefore, spectroscopy can be used to identify elements in matter of unknown composition. Similarly, the emission spectra of molecules can be used in chemical analysis of substances.

<span class="mw-page-title-main">Spectrophotometry</span> Branch of spectroscopy

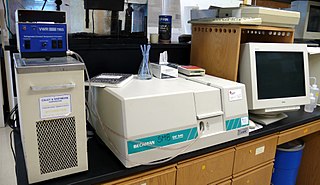
Spectrophotometry is a branch of electromagnetic spectroscopy concerned with the quantitative measurement of the reflection or transmission properties of a material as a function of wavelength. Spectrophotometry uses photometers, known as spectrophotometers, that can measure the intensity of a light beam at different wavelengths. Although spectrophotometry is most commonly applied to ultraviolet, visible, and infrared radiation, modern spectrophotometers can interrogate wide swaths of the electromagnetic spectrum, including x-ray, ultraviolet, visible, infrared, and/or microwave wavelengths.

<span class="mw-page-title-main">Monochromator</span> Optical device

A monochromator is an optical device that transmits a mechanically selectable narrow band of wavelengths of light or other radiation chosen from a wider range of wavelengths available at the input. The name is from the Greek roots mono-, "single", and chroma, "colour", and the Latin suffix -ator, denoting an agent.

<span class="mw-page-title-main">X-ray spectroscopy</span> Technique to characterize materials using X-ray radiation

X-ray spectroscopy is a general term for several spectroscopic techniques for characterization of materials by using x-ray radiation.

A spectroradiometer is a light measurement tool that is able to measure both the wavelength and amplitude of the light emitted from a light source. Spectrometers discriminate the wavelength based on the position the light hits at the detector array allowing the full spectrum to be obtained with a single acquisition. Most spectrometers have a base measurement of counts which is the un-calibrated reading and is thus impacted by the sensitivity of the detector to each wavelength. By applying a calibration, the spectrometer is then able to provide measurements of spectral irradiance, spectral radiance and/or spectral flux. This data is also then used with built in or PC software and numerous algorithms to provide readings or Irradiance (W/cm2), Illuminance, Radiance (W/sr), Luminance (cd), Flux, Chromaticity, Color Temperature, Peak and Dominant Wavelength. Some more complex spectrometer software packages also allow calculation of PAR μmol/m2/s, Metamerism, and candela calculations based on distance and include features like 2- and 20-degree observer, baseline overlay comparisons, transmission and reflectance.

<span class="mw-page-title-main">NASA Infrared Telescope Facility</span>

The NASA Infrared Telescope Facility is a 3-meter (9.8 ft) telescope optimized for use in infrared astronomy and located at the Mauna Kea Observatory in Hawaii. It was first built to support the Voyager missions and is now the US national facility for infrared astronomy, providing continued support to planetary, solar neighborhood, and deep space applications. The IRTF is operated by the University of Hawaii under a cooperative agreement with NASA. According to the IRTF's time allocation rules, at least 50% of the observing time is devoted to planetary science.

<span class="mw-page-title-main">Imaging spectrometer</span>

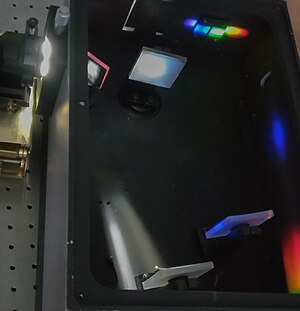
An imaging spectrometer is an instrument used in hyperspectral imaging and imaging spectroscopy to acquire a spectrally-resolved image of an object or scene, often referred to as a datacube due to the three-dimensional representation of the data. Two axes of the image correspond to vertical and horizontal distance and the third to wavelength. The principle of operation is the same as that of the simple spectrometer, but special care is taken to avoid optical aberrations for better image quality.

<span class="mw-page-title-main">Dispersive prism</span> Device used to disperse light

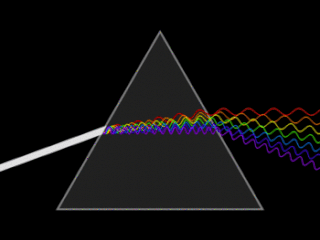
In optics, a dispersive prism is an optical prism that is used to disperse light, that is, to separate light into its spectral components. Different wavelengths (colors) of light will be deflected by the prism at different angles. This is a result of the prism material's index of refraction varying with wavelength (dispersion). Generally, longer wavelengths (red) undergo a smaller deviation than shorter wavelengths (blue). The dispersion of white light into colors by a prism led Sir Isaac Newton to conclude that white light consisted of a mixture of different colors.

<span class="mw-page-title-main">Cosmic Origins Spectrograph</span> Instrument installed on the Hubble Space Telescope

The Cosmic Origins Spectrograph (COS) is a science instrument that was installed on the Hubble Space Telescope during Servicing Mission 4 (STS-125) in May 2009. It is designed for ultraviolet (90–320 nm) spectroscopy of faint point sources with a resolving power of ≈1,550–24,000. Science goals include the study of the origins of large scale structure in the universe, the formation and evolution of galaxies, and the origin of stellar and planetary systems and the cold interstellar medium. COS was developed and built by the Center for Astrophysics and Space Astronomy (CASA-ARL) at the University of Colorado at Boulder and the Ball Aerospace and Technologies Corporation in Boulder, Colorado.

A multivariate optical element (MOE), is the key part of a multivariate optical computer; an alternative to conventional spectrometry for the chemical analysis of materials.

<span class="mw-page-title-main">Extreme Ultraviolet Explorer</span> NASA satellite of the Explorer program

The Extreme Ultraviolet Explorer was a NASA space telescope for ultraviolet astronomy. EUVE was a part of NASA's Explorer spacecraft series. Launched on 7 June 1992. With instruments for ultraviolet (UV) radiation between wavelengths of 7 and 76 nm, the EUVE was the first satellite mission especially for the short-wave ultraviolet range. The satellite compiled an all-sky survey of 801 astronomical targets before being decommissioned on 31 January 2001.

<span class="mw-page-title-main">Echelle grating</span> Type of diffraction grating used in spectrometers

An echelle grating is a type of diffraction grating characterised by a relatively low groove density, but a groove shape which is optimized for use at high incidence angles and therefore in high diffraction orders. Higher diffraction orders allow for increased dispersion (spacing) of spectral features at the detector, enabling increased differentiation of these features. Echelle gratings are, like other types of diffraction gratings, used in spectrometers and similar instruments. They are most useful in cross-dispersed high resolution spectrographs, such as HARPS, PARAS, and numerous other astronomical instruments.

<span class="mw-page-title-main">Fourier-transform infrared spectroscopy</span> Technique to analyze the infrared spectrum of matter

Fourier-transform infrared spectroscopy (FTIR) is a technique used to obtain an infrared spectrum of absorption or emission of a solid, liquid, or gas. An FTIR spectrometer simultaneously collects high-resolution spectral data over a wide spectral range. This confers a significant advantage over a dispersive spectrometer, which measures intensity over a narrow range of wavelengths at a time.

<span class="mw-page-title-main">History of spectroscopy</span>

Modern spectroscopy in the Western world started in the 17th century. New designs in optics, specifically prisms, enabled systematic observations of the solar spectrum. Isaac Newton first applied the word spectrum to describe the rainbow of colors that combine to form white light. During the early 1800s, Joseph von Fraunhofer conducted experiments with dispersive spectrometers that enabled spectroscopy to become a more precise and quantitative scientific technique. Since then, spectroscopy has played and continues to play a significant role in chemistry, physics and astronomy. Fraunhofer observed and measured dark lines in the Sun's spectrum, which now bear his name although several of them were observed earlier by Wollaston.

<span class="mw-page-title-main">NIRSpec</span> Spectrograph on the James Webb Space Telescope

The NIRSpec is one of the four scientific instruments flown on the James Webb Space Telescope (JWST). The JWST is the follow-on mission to the Hubble Space Telescope (HST) and is developed to receive more information about the origins of the universe by observing infrared light from the first stars and galaxies. In comparison to HST, its instruments will allow looking further back in time and will study the so-called Dark Ages during which the universe was opaque, about 150 to 800 million years after the Big Bang.

<span class="mw-page-title-main">Spectrometer</span> Used to measure spectral components of light

A spectrometer is a scientific instrument used to separate and measure spectral components of a physical phenomenon. Spectrometer is a broad term often used to describe instruments that measure a continuous variable of a phenomenon where the spectral components are somehow mixed. In visible light a spectrometer can separate white light and measure individual narrow bands of color, called a spectrum. A mass spectrometer measures the spectrum of the masses of the atoms or molecules present in a gas. The first spectrometers were used to split light into an array of separate colors. Spectrometers were developed in early studies of physics, astronomy, and chemistry. The capability of spectroscopy to determine chemical composition drove its advancement and continues to be one of its primary uses. Spectrometers are used in astronomy to analyze the chemical composition of stars and planets, and spectrometers gather data on the origin of the universe.

<span class="mw-page-title-main">Prism spectrometer</span>

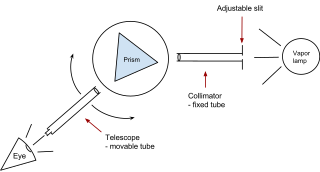
A prism spectrometer is an optical spectrometer which uses a dispersive prism as its dispersive element. The prism refracts light into its different colors (wavelengths). The dispersion occurs because the angle of refraction is dependent on the refractive index of the prism's material, which in turn is slightly dependent on the wavelength of light that is traveling through it.

References

  1. Butler, L. R. P.; Laqua, K. (1995). "Nomenclature, symbols, units and their usage in spectrochemical analysis-IX. Instrumentation for the spectral dispersion and isolation of optical radiation (IUPAC Recommendations 1995)". Pure Appl. Chem. 67 (10): 1725–1744. doi: 10.1351/pac199567101725 . S2CID   94991425. A spectrometer is the general term for describing a combination of spectral apparatus with one or more detectors to measure the intensity of one or more spectral bands.
  2. Schneider, T.; Young, R.; Bergen, T.; Dam-Hansen, C; Goodman, T.; Jordan, W.; Lee, D.-H; Okura, T.; Sperfeld, P.; Thorseth, A; Zong, Y. (2022). CIE 250:2022 Spectroradiometric Measurement of Optical Radiation Sources. Vienna: CIE - International Commission on Illumination. ISBN   978-3-902842-23-7.
  3. Bao, Jie; Bawendi, Moungi G. (2015-07-01). "A colloidal quantum dot spectrometer". Nature. 523 (7558): 67–70. Bibcode:2015Natur.523...67B. doi:10.1038/nature14576. ISSN   1476-4687. PMID   26135449. S2CID   4457991.
  4. Yang, Zongyin; Albrow-Owen, Tom; Cui, Hanxiao; Alexander-Webber, Jack; Gu, Fuxing; Wang, Xiaomu; Wu, Tien-Chun; Zhuge, Minghua; Williams, Calum; Wang, Pan; Zayats, Anatoly V. (2019-09-06). "Single-nanowire spectrometers". Science. 365 (6457): 1017–1020. Bibcode:2019Sci...365.1017Y. doi: 10.1126/science.aax8814 . PMID   31488686. S2CID   201845940.
  5. Brand, John C. D. (1995). Lines of Light: The Sources of Dispersive Spectroscopy, 1800–1930. Gordon and Breach Publishers. pp. 37–42. ISBN   978-2884491624.
  6. Weeks, Mary Elvira (1932). "The discovery of the elements. XIII. Some spectroscopic discoveries". Journal of Chemical Education . 9 (8): 1413–1434. Bibcode:1932JChEd...9.1413W. doi:10.1021/ed009p1413.
  7. "Robert Bunsen". infoplease. Pearson Education. 2007. Retrieved 2011-11-21.
  8. Brand 1995 , p. 63
  9. "Spectroscope - The Gemology Project". gemologyproject.com. Retrieved 2022-01-04.
  10. "Powerful New VLT Instrument Arrives in Chile". ESO Announcement. Retrieved 11 October 2012.
  11. 1 2 "Spectrometer, Spectroscope, and SpectrographExcerpt from Field Guide to Spectroscopy".
  12. IUPAC , Compendium of Chemical Terminology , 2nd ed. (the "Gold Book") (1997). Online corrected version: (2006) " spectrograph ". doi : 10.1351/goldbook.S05836
  13. George Barker, Memoir of Henry Draper, 1837-1882 (PDF), p. 103

Bibliography

Optical spectrometer at Curlie