Middle gray

Last updated
50% CIELAB lightness
(Y = 18.4%)

In photography, painting, and other visual arts, middle gray or middle grey is a tone that is perceptually about halfway between black and white on a lightness scale; [1] in photography and printing, it is typically defined as 18% reflectance in visible light. [2] [3]

Contents

Light meters, cameras, and pictures are often calibrated using an 18% gray card [4] [5] [6] or a color reference card such as a ColorChecker. [7] [8] [9] On the assumption that 18% is similar to the average reflectance of a scene, a gray card can be used to estimate the required exposure of the film. [5]

History

Following the Weber–Fechner law, at the start of the 20th century human lightness perception was assumed to be logarithmic. In 1903, The New International Encyclopædia illustrated this concept by stating that given a black and white with a luminance ratio of 1:60 (  :  ), the geometric mean had to be used to find the middle gray. [10] That is equivalent to a relative luminance of 12.9% ( ).

When Albert Henry Munsell was developing his color system, he tried to ascertain the relation between luminance and perceived lightness. As early as 1906, he wrote: 'Should we use logarithmic curve or curve of squares?' [11] In 1920 Priest, Gibson, and McNicholas showed using both a König-Martens spectrophotometer and an apparatus designed by Gibson where the outputs of two photocells are balanced [12] that the shades in Munsell's 1915 atlas followed a square root curve, which was later confirmed by extensive experiments. [13] [14] In Munsell's system, the shades of neutral gray were labelled N1 to N9, with N5 in the middle and 0 and 10 denoting the unachievable ideal black and perfect white. [15]

In 1933, Alexander Ector Orr Munsell (Albert Henry Munsell's son) found "that a series of neutral reflecting surfaces whose reflectances are...18.0...and 100.0 percent...form for the average observer a series of equal differences in value." [16]

From the 1930s onward various lightness curves were proposed, but halfway through the 20th century, the proposals settled on cube-root-based curves. In 1976 the International Commission on Illumination defined the CIELAB color space, [17] an extension of which would become the standard for the coming decades in a variety of applications. [18] [19] Following research in the 80s and 90s, more and more advanced models of color vision were developed, the first major step being CIECAM97s; see Lightness § 1933 for details.

Table of middle grays

Below are various "middle" grays based on various criteria.

The shades in the rightmost column will only be correct if viewed on a calibrated monitor.

Note that LCD screens, even when correctly calibrated, often have a brightness that varies considerably depending on the viewing angle.

Middle gray as defined byYear CIEXYZ relative luminance (Y)Appearance
Geomean of 60:1190312.91%
Munsell, Sloan & Godlove193318%
CIELAB 197618.42%
sRGB 199621.40%
Munsell's original N5190625.00%
NCS S 5000-N196426%
Mac, pre-OS X 10.61984≈ 30%
CIECAM02 lightness2002*
CIECAM97s lightness1997*
50% Luminance193150.00%

Quarter luminance list (typical monitor calibrated to 2.2 gamma, 50% luminance gray has RGB hex 0xBA value, which is 0.5^(1/2.2)*255)

Middle gray as defined byYear CIEXYZ relative luminanceAppearance
100% Luminance1931100%
75% Luminance193175%
50% Luminance193150%
25% Luminance193125%
0% Luminance19310%

* Context-dependent; an estimate is displayed here taking the environment where it appears in the article into account and assuming a neutrally lit surround of 200 cd/m2.

Related Research Articles

Gamma correction or gamma is a nonlinear operation used to encode and decode luminance or tristimulus values in video or still image systems. Gamma correction is, in the simplest cases, defined by the following power-law expression:

<span class="mw-page-title-main">Munsell color system</span> Color space

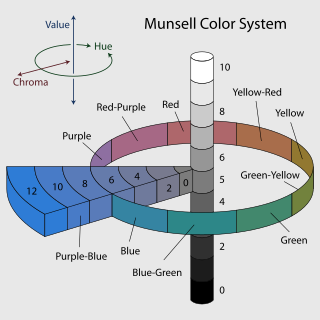
In colorimetry, the Munsell color system is a color space that specifies colors based on three properties of color: hue, chroma, and value (lightness). It was created by Albert H. Munsell in the first decade of the 20th century and adopted by the United States Department of Agriculture (USDA) as the official color system for soil research in the 1930s.

<span class="mw-page-title-main">Exposure (photography)</span> Amount of light captured by a camera

In photography, exposure is the amount of light per unit area reaching a frame of photographic film or the surface of an electronic image sensor. It is determined by shutter speed, lens F-number, and scene luminance. Exposure is measured in units of lux-seconds, and can be computed from exposure value (EV) and scene luminance in a specified region.

<span class="mw-page-title-main">Light meter</span> Device used to measure the amount of light

A light meter is a device used to measure the amount of light. In photography, an exposure meter is a light meter coupled to either a digital or analog calculator which displays the correct shutter speed and f-number for optimum exposure, given a certain lighting situation and film speed. Similarly, exposure meters are also used in the fields of cinematography and scenic design, in order to determine the optimum light level for a scene.

<span class="mw-page-title-main">Film speed</span> Measure of a photographic films sensitivity to light

Film speed is the measure of a photographic film's sensitivity to light, determined by sensitometry and measured on various numerical scales, the most recent being the ISO system introduced in 1974. A closely related system, also known as ISO, is used to describe the relationship between exposure and output image lightness in digital cameras. Prior to ISO, the most common systems were ASA in the U.S. and DIN in Europe.

<span class="mw-page-title-main">HSL and HSV</span> Alternative representations of the RGB color model

HSL and HSV are the two most common cylindrical-coordinate representations of points in an RGB color model. The two representations rearrange the geometry of RGB in an attempt to be more intuitive and perceptually relevant than the cartesian (cube) representation. Developed in the 1970s for computer graphics applications, HSL and HSV are used today in color pickers, in image editing software, and less commonly in image analysis and computer vision.

<span class="mw-page-title-main">Chromaticity</span> Specification of color hue and saturation

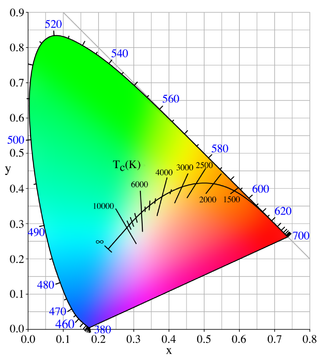
Chromaticity is an objective specification of the quality of a color regardless of its luminance. Chromaticity consists of two independent parameters, often specified as hue (h) and colorfulness (s), where the latter is alternatively called saturation, chroma, intensity, or excitation purity. This number of parameters follows from trichromacy of vision of most humans, which is assumed by most models in color science.

<span class="mw-page-title-main">Grayscale</span> Image where each pixels intensity is shown only achromatic values of black, gray, and white

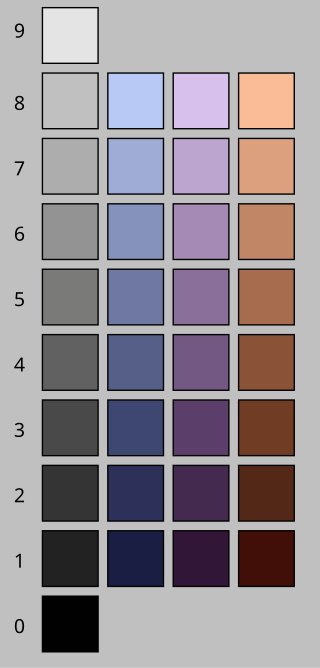
In digital photography, computer-generated imagery, and colorimetry, a grayscale image is one in which the value of each pixel is a single sample representing only an amount of light; that is, it carries only intensity information. Grayscale images, a kind of black-and-white or gray monochrome, are composed exclusively of shades of gray. The contrast ranges from black at the weakest intensity to white at the strongest.

A color model is an abstract mathematical model describing the way colors can be represented as tuples of numbers, typically as three or four values or color components. When this model is associated with a precise description of how the components are to be interpreted, taking account of visual perception, the resulting set of colors is called "color space."

<span class="mw-page-title-main">Tone mapping</span> Image processing technique

Tone mapping is a technique used in image processing and computer graphics to map one set of colors to another to approximate the appearance of high-dynamic-range (HDR) images in a medium that has a more limited dynamic range. Print-outs, CRT or LCD monitors, and projectors all have a limited dynamic range that is inadequate to reproduce the full range of light intensities present in natural scenes. Tone mapping addresses the problem of strong contrast reduction from the scene radiance to the displayable range while preserving the image details and color appearance important to appreciate the original scene content.

Relative luminance follows the photometric definition of luminance including spectral weighting for human vision, but while luminance is a measure of light in units such as , relative luminance values are normalized as 0.0 to 1.0, with 1.0 being a theoretical perfect reflector of 100% reference white. Like the photometric definition, it is related to the luminous flux density in a particular direction, which is radiant flux density weighted by the luminous efficiency function of the CIE Standard Observer.

Adams chromatic valence color spaces are a class of color spaces suggested by Elliot Quincy Adams. Two important Adams chromatic valence spaces are CIELUV and Hunter Lab.

In the theory of photography, tone reproduction is the mapping of scene luminance and color to print reflectance or display luminance, with the aim of subjectively "properly" reproducing brightness and "brightness differences".

<span class="mw-page-title-main">Gray card</span> Reflectance reference used in photography

A gray card is a middle gray reference, typically used together with a reflective light meter, as a way to produce consistent image exposure and/or color in video production, film and photography.

<span class="mw-page-title-main">Error diffusion</span> Type of halftoning

Error diffusion is a type of halftoning in which the quantization residual is distributed to neighboring pixels that have not yet been processed. Its main use is to convert a multi-level image into a binary image, though it has other applications.

<span class="mw-page-title-main">Lightness</span> Property of a color

Lightness is a visual perception of the luminance of an object. It is often judged relative to a similarly lit object. In colorimetry and color appearance models, lightness is a prediction of how an illuminated color will appear to a standard observer. While luminance is a linear measurement of light, lightness is a linear prediction of the human perception of that light.

The CIE 1964 (U*, V*, W*) color space, also known as CIEUVW, is based on the CIE 1960 UCS:

In colorimetry the OSA-UCS is a color space first published in 1947 and developed by the Optical Society of America’s Committee on Uniform Color Scales. Previously created color order systems, such as the Munsell color system, failed to represent perceptual uniformity in all directions. The committee decided that, in order to accurately represent uniform color differences in each direction, a new shape of three dimensional Cartesian geometry would need to be used.

This article provides introductory information about the RGB, HSV, and HSL color models from a computer graphics perspective. An introduction to colors is also provided to support the main discussion.

Data visualization involves presenting data and information using visual elements like charts, graphs, and maps. It simplifies complex data, making patterns and trends more apparent, and aiding in better understanding and decision-making. And color coding in data visualization is implemented to help users of data to easily read, understand, and categorize the different facets of information that a given set data is trying to explain.

References

  1. Stephen Quiller (1999). Painter's Guide to Color: Includes the New Quiller Color Wheel. Watson-Guptill. ISBN   0-8230-3913-7.
  2. Blain Brown (2002). Cinematography: Theory and Practice : Imagemaking for Cinematographers, Directors, and Videographers. Focal Press. ISBN   0-240-80500-3.
  3. Woods, Mark. How to Effectively Use the Gray Card Archived 2014-11-29 at the Wayback Machine . cameraguild.com
  4. Steven Barclay (1999). The Motion Picture Image: From Film to Digital. Focal Press. ISBN   0-240-80390-6.
  5. 1 2 Film and Its Techniques by Raymond Spottiswoode
  6. Gevaert Manual of Photography, ed. A.H.S. Craeybeckx
  7. C. S. McCamy, H. Marcus, and J. G. Davidson (1976). "A Color-Rendition Chart". Journal of Applied Photographic Engineering2(3). 95–99.
  8. Shoptalk: a new tool for checking color photography by Norman Goldberg
  9. How to Photograph Landscapes & Scenic Views by David Brooks
  10. Daniel Coit Gilman; Harry Thurston Peck & Frank Moore Colby (1903). The New International Encyclopædia. Dodd, Mead and Company.
  11. Kuehni, Rolf G. (February 2002). "The early development of the Munsell system". Color Research & Application. 27 (1): 20–27. doi:10.1002/col.10002.
  12. First the photocells are illuminated by lamps and their outputs are balanced without the sample present; then the sample is placed at one cell and the lamp illuminating the other cell is moved further away until the outputs rebalance. For a more detailed description see K.S. Gibson, Photoelectric spectrophotometry using the null method.
  13. Priest, Irwin G.; Gibson, K.S.; McNicholas, H.J. (September 1920). "An examination of the Munsell color system. I: Spectral and total reflection and the Munsell scale of Value". Technical Paper 167 (3). United States Bureau of Standards: 27.
  14. Munsell AEO, Sloan LL, Godlove IH. Neutral value scales I, Munsell neutral value scale. J Opt Soc Am 1933;23:394 – 401
  15. Priest, Irwin G.; Gibson, K.S.; McNicholas, H.J. (September 1920). "An examination of the Munsell color system. I: Spectral and total reflection and the Munsell scale of Value". Technical Paper 167 (3). United States Bureau of Standards: 27.
  16. Munsell AEO, Sloan LL, Godlove IH. Neutral value scales I, Munsell neutral value scale. J Opt Soc Am 1933;23:394 – 401
  17. CIE Colorimetry–Part 4: 1976 L* a* b* Colour Space
  18. H. Pauli, Proposed extension of the CIE recommendation on "Uniform color spaces, color difference equations, and metric color terms"
  19. Kenichiro Masaoka, Fu Jiang, Mark D. Fairchild & Rodney L. Heckaman, Analysis of color volume of multi-chromatic displays using gamut rings