Blackpool Borough Council elections are generally held every four years. Blackpool Borough Council is the local authority for the unitary authority of Blackpool in Lancashire, England. Since the last boundary changes in 2023, 42 councillors have been elected from 21 wards.

Lancaster City Council elections are held every four years. Lancaster City Council is the local authority for the non-metropolitan district of Lancaster in Lancashire, England. Since the last boundary changes in 2023, 61 councillors have been elected from 27 wards.
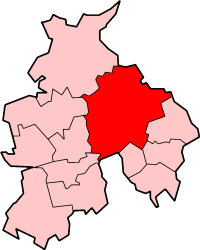
Newcastle City Council elections are generally held three years out of every four, with a third of the council being elected each time. Newcastle City Council is the local authority for the metropolitan borough of the Newcastle upon Tyne in Tyne and Wear, England. Since the last boundary changes in 2018, 78 councillors have been elected from 26 wards.
Leicester City Council elections are held every four years. Leicester City Council is the local authority for the unitary authority of Leicester in Leicestershire, England. Until 1 April 1997 it was a non-metropolitan district. Since 2011 it has also had a directly elected mayor. Since the last boundary changes in 2015, 54 councillors have been elected from 21 wards.
Coventry City Council elections are generally held three years out of every four, with a third of the council being elected each time. Coventry City Council is the local authority for the metropolitan borough of Coventry in the West Midlands, England. Since the last boundary changes in 2004, 54 councillors have been elected from 18 wards.
Ashfield District Council elections are held every four years. Ashfield District Council is the local authority for the non-metropolitan district of Ashfield in Nottinghamshire, England. Since the last boundary changes in 2015, 35 councillors are elected from 23 wards.
Canterbury City Council is the local authority for the City of Canterbury. The council is elected every four years.
Dartford Borough Council is the local authority for the Borough of Dartford in Kent, England. The council is elected every four years.
Warwick District Council elections are held every four years. Warwick District Council is the local authority for the non-metropolitan district of Warwick in Warwickshire, England. Since the last boundary changes in 2019, 44 councillors have been elected from 17 wards.

West Lancashire Borough Council elections are generally held three years out of every four, with a third of the council elected each time. West Lancashire Borough Council is the local authority for the non-metropolitan district of West Lancashire in Lancashire, England. Since the last boundary changes in 2023 the council has comprised 45 councillors representing 15 wards, with each ward electing three councillors.
East Hampshire District Council elections are held every four years to elect councillors to East Hampshire District Council in Hampshire, England. Since the last boundary changes in 2019 the council has comprised 43 councillors representing 31 wards, with each ward electing one, two or three councillors.
Mid Devon District Council elections are held every four years to elect Mid Devon District Council in Devon, England. Since the last boundary changes in 2023 the council has comprised 42 councillors, representing 22 wards, with each ward electing one, two or three councillors.
South Cambridgeshire District Council was created as part of the 1972 local government reforms. The first elections to the new authority were held in the year 1973. From 1978 until 2016, one third of the council were elected each year, followed by one year without a poll. Since 2018, all members of the council are elected at once in a so-called 'all-out' election, after a decision made in 2015.
Medway Council is the local authority for the unitary authority of Medway in Kent, England. It was created on 1 April 1998 replacing Gillingham and Rochester-upon-Medway.
Swindon Borough Council is the local authority for the unitary authority of Swindon in Wiltshire, England. Until 1 April 1997 its area was a non-metropolitan district called Thamesdown Borough Council, with Wiltshire County Council providing the county-level services.
Gravesham Borough Council elections are held every four years to elect Gravesham Borough Council in Kent, England. Since the last boundary changes in 2023, the council has comprised 39 councillors, representing 17 wards.
Redcar and Cleveland Borough Council is the local authority for the unitary authority of Redcar and Cleveland in North Yorkshire, England. Until 1 April 1996 it was a non-metropolitan district in Cleveland, called Langbaurgh.
Ribble Valley Borough Council elections are held every four years. Ribble Valley Borough Council is the local authority for the non-metropolitan district of Ribble Valley in Lancashire, England. Since the last boundary changes in 2019, 40 councillors have been elected from 26 wards.
Stoke-on-Trent City Council elections are held every four years. Stoke-on-Trent City Council is the local authority for the unitary authority of Stoke-on-Trent in the ceremonial county of Staffordshire, England. Since the last boundary changes in 2023, 44 councillors have been elected from 34 wards.
Nottingham City Council elections are held every four years. Nottingham City Council is the local authority for the unitary authority of Nottingham in Nottinghamshire, England. Until 1 April 1998 it was a non-metropolitan district. Since the last boundary changes in 2019, 55 councillors are elected from 20 wards.
 1979 results map
 1983 results map
 1987 results map
 1991 results map
 1995 results map
 1997 results map
 2000 results map
 2003 results map
 2004 results map
 2006 results map
 2007 results map
 2008 results map
 2010 results map
 2011 results map
 2012 results map
 2014 results map
 2015 results map
 2016 results map
 2018 results map
 2019 results map
 2021 results map
 2022 results map
 2023 results map