Borough result maps
 2011 results map
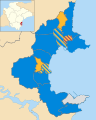 2015 results map
 2019 results map
 2023 results map
Torbay Council is the local authority for the unitary authority of Torbay in Devon, England. Until 1 April 1998 it was a non-metropolitan district. From 2005 to 2019 it had a directly elected mayor. The council is elected every four years.
A referendum took place on 14 July 2005 on establishing a directly elected mayor. The result saw a majority in favour with 18,074 in support and 14,684 opposed on a 32.1% turnout. [5]
A referendum took place on 5 May 2016 on reverting to a leader and cabinet system. The result saw a majority in favour of a leader and cabinet system with 15,846 votes in support of the leader and cabinet system and 9,511 wanting to stick with an elected mayor, on a 25.3% turnout. [6]


| Party | Candidate | Votes | % | ±% | |
|---|---|---|---|---|---|
| Conservative | 1,380 | 46.3 | +10.9 | ||
| Liberal Democrats | 884 | 29.7 | -2.4 | ||
| Independent | 521 | 17.5 | -3.5 | ||
| Labour | 195 | 6.5 | -5.0 | ||
| Majority | 469 | 16.6 | |||
| Turnout | 2,980 | 35.0 | |||
| Conservative gain from Liberal Democrats | Swing | ||||
| Party | Candidate | Votes | % | ±% | |
|---|---|---|---|---|---|
| Conservative | Damian Barton | 671 | 38.2 | +5.9 | |
| Liberal Democrats | Jennifer Faulkner | 667 | 38.0 | -5.3 | |
| Labour | Darren Cowell | 321 | 18.3 | -6.1 | |
| Liberal | 97 | 5.5 | +5.5 | ||
| Majority | 4 | 0.2 | |||
| Turnout | 1,756 | ||||
| Conservative gain from Liberal Democrats | Swing | ||||
| Party | Candidate | Votes | % | ±% | |
|---|---|---|---|---|---|
| Conservative | 1,504 | 51.4 | +16.0 | ||
| Liberal Democrats | 1,129 | 38.6 | +6.5 | ||
| Labour | 295 | 10.1 | -1.4 | ||
| Majority | 375 | 12.8 | |||
| Turnout | 2,928 | 34.0 | |||
| Conservative gain from Liberal Democrats | Swing | ||||
| Party | Candidate | Votes | % | ±% | |
|---|---|---|---|---|---|
| Liberal Democrats | Andrew Blake | 1,151 | 62.9 | +32.9 | |
| Conservative | David Selley | 546 | 29.8 | -7.2 | |
| Labour | Pauline Digby | 94 | 5.1 | +0.0 | |
| Independent | Lionel Digby | 40 | 2.2 | +2.2 | |
| Majority | 605 | 33.1 | |||
| Turnout | 1,831 | 24.7 | |||
| Liberal Democrats gain from Conservative | Swing | ||||
| Party | Candidate | Votes | % | ±% | |
|---|---|---|---|---|---|
| Liberal Democrats | Christopher Harris | 1,201 | 63.4 | -26.3 | |
| Conservative | 557 | 29.6 | -10.9 | ||
| Labour | 121 | 6.4 | -5.6 | ||
| Majority | 644 | 33.8 | |||
| Turnout | 1,879 | 25.5 | |||
| Liberal Democrats gain from Conservative | Swing | ||||
| Party | Candidate | Votes | % | ±% | |
|---|---|---|---|---|---|
| Conservative | Joseph Carroll | 498 | 29.3 | -2.3 | |
| Liberal Democrats | Andrew Douglas-Dunbar | 413 | 24.3 | -24.7 | |
| Independent | Alan Hall | 203 | 11.9 | +4.6 | |
| Labour | David Pedrick-Friend | 203 | 11.9 | -0.1 | |
| UKIP | Mark Dent | 128 | 7.5 | +7.5 | |
| BNP | Michael Turner | 106 | 6.2 | +6.2 | |
| Independent | Pamela Neale | 85 | 5.0 | +5.0 | |
| Independent | Mary Bennett | 63 | 3.7 | +3.7 | |
| Majority | 85 | 5.0 | |||
| Turnout | 1,699 | 31.2 | |||
| Conservative gain from Liberal Democrats | Swing | ||||
| Party | Candidate | Votes | % | ±% | |
|---|---|---|---|---|---|
| Conservative | 964 | ||||
| Conservative | 923 | ||||
| UKIP | 545 | ||||
| UKIP | 482 | ||||
| Liberal Democrats | Tristan Gruber | 198 | |||
| Liberal Democrats | Thomas Pentney | 192 | |||
| Labour | 102 | ||||
| Labour | 89 | ||||
| Turnout | 3,496 | 27.6 | |||
| Conservative hold | Swing | ||||
| Party | Candidate | Votes | % | ±% | |
|---|---|---|---|---|---|
| Conservative | Colin Hurst | 701 | 42.2 | +10.5 | |
| Liberal Democrats | Thomas Pentney | 510 | 30.7 | -27.9 | |
| UKIP | Mark Dent | 284 | 17.1 | +7.4 | |
| Labour | John Mellor | 116 | 7.0 | +7.0 | |
| BNP | Michael Turner | 50 | 3.0 | +3.0 | |
| Majority | 191 | 11.5 | |||
| Turnout | 1,661 | 30.9 | |||
| Conservative gain from Liberal Democrats | Swing | ||||
| Party | Candidate | Votes | % | ±% | |
|---|---|---|---|---|---|
| Conservative | John Hanley | 1,261 | 62.5 | +8.5 | |
| Liberal Democrats | Jefferson Rose | 331 | 16.4 | +5.2 | |
| UKIP | Mark Dent | 326 | 16.1 | -13.3 | |
| Labour | Thomas Millman | 99 | 4.9 | -0.6 | |
| Majority | 930 | 46.1 | |||
| Turnout | 2,017 | 29.6 | |||
| Conservative hold | Swing | ||||
| Party | Candidate | Votes | % | ±% | |
|---|---|---|---|---|---|
| Conservative | Jeanette Richards | 1,708 | 38.9 | +18.9 | |
| Liberal Democrats | Alan Forbes | 1,563 | 35.6 | -14.1 | |
| Labour | Jonathan Haines | 1,124 | 25.6 | +7.4 | |
| Majority | 145 | 3.3 | |||
| Turnout | 4,395 | 57.8 | |||
| Conservative gain from Liberal Democrats | Swing | ||||
| Party | Candidate | Votes | % | ±% | |
|---|---|---|---|---|---|
| Conservative | Derek Mills | 1,250 | 77.7 | +27.4 | |
| Liberal Democrats | Andrew Douglas-Dunbar | 270 | 16.8 | -32.9 | |
| Labour | Trevor Fine | 89 | 5.5 | +5.5 | |
| Majority | 980 | 60.9 | |||
| Turnout | 1,609 | 28.3 | |||
| Conservative hold | Swing | ||||
| Party | Candidate | Votes | % | ±% | |
|---|---|---|---|---|---|
| Independent | Michael Morey | 1,006 | |||
| Independent | Vic Ellery | 952 | |||
| Conservative | Martyn Hodge | 853 | |||
| Conservative | Simon Jones | 727 | |||
| Conservative | Alan Craig | 689 | |||
| Independent | Tony Walker | 510 | |||
| Liberal Democrats | Chris Lomas | 483 | |||
| Independent | Nigel James | 397 | |||
| Liberal Democrats | Catherine Johns | 277 | |||
| Liberal Democrats | John Turner | 245 | |||
| BNP | Michael Turner | 159 | |||
| BNP | Maureen Turner | 152 | |||
| BNP | Chris Marchant | 151 | |||
| UKIP | Gary Booth | 145 | |||
| UKIP | Peter Fryett | 129 | |||
| UKIP | Mike Simpson | 93 | |||
| Labour | Patrick Canavan | 71 | |||
| Labour | Jermaine Atiya-Alla | 67 | |||
| Labour | Irene Reade | 66 | |||
| Turnout | 7,172 | 31.8 | |||
| Independent gain from Liberal Democrats | Swing | ||||
| Independent gain from Conservative | Swing | ||||
| Conservative hold | Swing | ||||
| Party | Candidate | Votes | % | ±% | |
|---|---|---|---|---|---|
| Liberal Democrats | Andrew Baldrey | 801 | 52.7 | ||
| Conservative | Nicholas Henderson | 365 | 24.0 | ||
| Labour | Rosemary Ann Clarke | 195 | 12.8 | ||
| UKIP | Jen Walsh | 159 | 10.5 | ||
| Majority | |||||
| Turnout | 2,017 | 1,520 | |||
| Liberal Democrats gain from Conservative | Swing | ||||
| Party | Candidate | Votes | % | ±% | |
|---|---|---|---|---|---|
| Liberal Democrats | Mark Pountney | 1,048 | 46.3 | ||
| Conservative | Sylvia Faryna | 614 | 27.1 | ||
| Labour | Leonora Critchlow | 357 | 15.8 | ||
| Independent | Susie Colley | 129 | 5.7 | ||
| Independent | Mark Dent | 61 | 2.7 | ||
| Green | Thomas Cooper | 55 | 2.4 | ||
| Majority | |||||
| Turnout | 2,264 | 26.3 | |||
| Liberal Democrats gain from Conservative | Swing | ||||
| Party | Candidate | Votes | % | ±% | |
|---|---|---|---|---|---|
| Liberal Democrats | Adrian Sanders | 1,096 | 69.2 | +39.3 | |
| Conservative | Richard Barnby | 234 | 14.8 | -13.7 | |
| UKIP | Anthony Rayner | 158 | 10.0 | -9.7 | |
| Labour | Eddie Harris | 53 | 3.3 | -9 | |
| Green | Stephen Pocock | 43 | 2.7 | -6.8 | |
| Majority | 862 | 54.4 | +53 | ||
| Turnout | 1,584 | 27.6 | |||
| Liberal Democrats hold | Swing | +26.5 | |||
| Party | Candidate | Votes | % | ±% | |
|---|---|---|---|---|---|
| Liberal Democrats | Nicholas Pentney | 1,126 | 46.7 | ||
| Conservative | Jacqueline Wakeham | 533 | 22.1 | ||
| Labour | Darren Cowell | 344 | 14.3 | ||
| UKIP | Steven Walsh | 315 | 13.1 | ||
| Green | Stephen Morley | 66 | 2.7 | ||
| TUSC | Michelle Goodman | 27 | 1.1 | ||
| Majority | 593 | 24.6 | |||
| Turnout | 2,411 | 29.8 | |||
| Liberal Democrats gain from Conservative | Swing | ||||
| Party | Candidate | Votes | % | ±% | |
|---|---|---|---|---|---|
| Liberal Democrats | Swithin Long | 655 | 57.1 | ||
| Conservative | Daniel Maddock | 355 | 30.9 | ||
| Labour | Julia Neal | 121 | 9.5 | ||
| Green | Eleanor Taylor | 17 | 1.4 | ||
| Majority | 300 | 26.1 | |||
| Turnout | 1,148 | 22.3 | |||
| Liberal Democrats hold | Swing | ||||
| Party | Candidate | Votes | % | ±% | |
|---|---|---|---|---|---|
| Conservative | Jane Barnby | 892 | 49.3 | +21.7 | |
| Liberal Democrats | Dennis Shearman | 641 | 35.5 | +4.8 | |
| Brexit Party | Eddie Davis | 168 | 9.3 | +9.3 | |
| Labour | Catherine Fritz | 72 | 4.0 | -2.3 | |
| Green | Jane Hughes | 35 | 1.9 | -7.5 | |
| Majority | 251 | 13.9 | |||
| Turnout | 1,808 | ||||
| Conservative gain from Liberal Democrats | Swing | ||||
| Party | Candidate | Votes | % | ±% | |
|---|---|---|---|---|---|
| Liberal Democrats | Cat Johns | 1,014 | 45.8 | +4.7 | |
| Conservative | John Fellows | 983 | 44.4 | +17.6 | |
| Labour | Andy Symons | 149 | 6.7 | -0.8 | |
| Green | Sue Kenning | 69 | 3.1 | -9.7 | |
| Majority | 31 | 1.4 | |||
| Turnout | 2,215 | ||||
| Liberal Democrats hold | Swing | ||||
Dacorum Borough Council in Hertfordshire, England is elected every four years. Since the last boundary changes in 2007, 51 councillors have been elected from 25 wards.

Fylde Borough Council elections are held every four years to elect councillors to Fylde Borough Council in Lancashire, England. Since the last boundary changes in 2023 the council has comprised 37 councillors, representing 17 wards, with each ward electing one, two or three councillors.
Boston Borough Council in Lincolnshire, England is elected every four years. Since the last boundary changes in 2015, 30 councillors are elected from 15 wards.
Charnwood Borough Council elections are held every four years. Charnwood Borough Council is the local authority for the non-metropolitan district of Charnwood in Leicestershire, England. Since the last boundary changes in 2023 the council has comprised 52 councillors, representing 24 wards, with each ward electing one, two or three councillors.
Fenland District Council in Cambridgeshire, England is elected every four years. Since the last boundary changes in 2023, the council has comprised 43 councillors representing 18 wards, with each ward electing one, two or three councillors.
Northampton Borough Council was the local authority for Northampton in Northamptonshire, England and was elected every four years. From the last boundary changes in 1999, 47 councillors were elected from 23 wards. The borough council was abolished in 2021, with the area becoming part of West Northamptonshire.
One third of Crawley Borough Council in West Sussex, England is elected each year, followed by one year without election. Since the last boundary changes in 2019, 36 councillors have been elected from 13 wards.

West Lancashire Borough Council elections are generally held three years out of every four, with a third of the council elected each time. West Lancashire Borough Council is the local authority for the non-metropolitan district of West Lancashire in Lancashire, England. Since the last boundary changes in 2023 the council has comprised 45 councillors representing 15 wards, with each ward electing three councillors.

Burnley Borough Council elections are generally held three years out of every four, with a third of the council elected each time. Burnley Borough Council is the local authority for the non-metropolitan district of Burnley in Lancashire, England. Since the last boundary changes in 2002, 45 councillors have been elected from 15 wards.
The Borough Council of Wellingborough in Northamptonshire, UK was elected every four years. After the last boundary changes in 1999, thirty-six councillors were elected from 16 wards. The council was abolished in 2021, with the area becoming part of North Northamptonshire.

South Ribble Borough Council elections are held every four years. South Ribble Borough Council is the local authority for the non-metropolitan district of South Ribble in Lancashire, England. Since the last boundary changes in 2015, 50 councillors have been elected from 23 wards. The next borough council elections are due to take place in 2027 as part of the wider 2027 United Kingdom local elections.
Hartlepool Borough Council elections usually take place for a third of the council, three years out of every four. Hartlepool Borough Council is the local authority for the unitary authority of Hartlepool in County Durham, England. Until 1 April 1996 it was a non-metropolitan district in Cleveland.
Rotherham Metropolitan Borough Council is the local authority for Rotherham in South Yorkshire, England. The council is elected every four years. Since the last boundary changes in 2004, 63 councillors have been elected from 21 wards.
Stafford Borough Council elections are held every four years. Stafford Borough Council is the local authority for the non-metropolitan district of Stafford in Staffordshire, England. Since the last boundary changes in 2015, 40 councillors have been elected from 23 wards.
Dover District Council is the local authority for the Dover District in Kent, England. The council is elected every four years.
West Devon Borough Council in Devon, England is elected every four years. Since the last boundary changes in 2015, 31 councillors have been elected from 18 wards.
Newcastle-under-Lyme Borough Council elections are held every four years. Newcastle-under-Lyme Borough Council is the local authority for the non-metropolitan district of Newcastle-under-Lyme in Staffordshire, England. Since the last boundary changes in 2018, 47 councillors have been elected from 21 wards. Prior to 2018 elections were held three years out of every four, with a third of the council elected each time.
One-third of Runnymede Borough Council in Surrey, England, is elected each year, followed by one year where there is an election to Surrey County Council instead. The council is divided up into 14 wards, electing 41 councillors, since the last boundary changes in 2019.
Redcar and Cleveland Borough Council is the local authority for the unitary authority of Redcar and Cleveland in North Yorkshire, England. Until 1 April 1996 it was a non-metropolitan district in Cleveland, called Langbaurgh.
High Peak Borough Council elections are held every four years. High Peak Borough Council is the local authority for the non-metropolitan district of High Peak in Derbyshire, England. Since the last boundary changes in 2015, 43 councillors have been elected from 28 wards.