In computing, a core dump, memory dump, crash dump, storage dump, system dump, or ABEND dump consists of the recorded state of the working memory of a computer program at a specific time, generally when the program has crashed or otherwise terminated abnormally. In practice, other key pieces of program state are usually dumped at the same time, including the processor registers, which may include the program counter and stack pointer, memory management information, and other processor and operating system flags and information. A snapshot dump is a memory dump requested by the computer operator or by the running program, after which the program is able to continue. Core dumps are often used to assist in diagnosing and debugging errors in computer programs.
Cabinet is an archive-file format for Microsoft Windows that supports lossless data compression and embedded digital certificates used for maintaining archive integrity. Cabinet files have .cab filename extensions and are recognized by their first four bytes MSCF. Cabinet files were known originally as Diamond files.
In computing, Physical Address Extension (PAE), sometimes referred to as Page Address Extension, is a memory management feature for the x86 architecture. PAE was first introduced by Intel in the Pentium Pro, and later by AMD in the Athlon processor. It defines a page table hierarchy of three levels (instead of two), with table entries of 64 bits each instead of 32, allowing these CPUs to directly access a physical address space larger than 4 gigabytes (232 bytes).
Nagios Core, formerly known as Nagios, is a free and open-source computer-software application that monitors systems, networks and infrastructure. Nagios offers monitoring and alerting services for servers, switches, applications and services. It alerts users when things go wrong and alerts them a second time when the problem has been resolved.

A crash reporter is usually a system software whose function is to identify reporting crash details and to alert when there are crashes, in production or on development / testing environments. Crash reports often include data such as stack traces, type of crash, trends and version of software. These reports help software developers- Web, SAAS, mobile apps and more, to diagnose and fix the underlying problem causing the crashes. Crash reports may contain sensitive information such as passwords, email addresses, and contact information, and so have become objects of interest for researchers in the field of computer security.
RootkitRevealer is a proprietary freeware tool for rootkit detection on Microsoft Windows by Bryce Cogswell and Mark Russinovich. It runs on Windows XP and Windows Server 2003. Its output lists Windows Registry and file system API discrepancies that may indicate the presence of a rootkit. It is the same tool that triggered the Sony BMG copy protection rootkit scandal.
Windows Sysinternals is a website that offers technical resources and utilities to manage, diagnose, troubleshoot, and monitor a Microsoft Windows environment. Originally, the Sysinternals website was created in 1996 and was operated by the company Winternals Software LP, which was located in Austin, Texas. It was started by software developers Bryce Cogswell and Mark Russinovich. Microsoft acquired Winternals and its assets on July 18, 2006.
A machine-check exception (MCE) is a type of computer hardware error that occurs when a computer's central processing unit detects a hardware error in the processor itself, the memory, the I/O devices, or on the system bus; in some architectures, an MCE only occurs for an unrecoverable error. On x86 architectures, a machine-check exception is not caused by software. However, on other architectures such as PowerPC, certain software bugs such as invalid memory accesses can cause machine-check exceptions. The error usually occurs due to component failure or the overheating or overclocking of hardware components. Most machine-check exceptions halt the operating system and require a restart before users can continue normal operation. Diagnosing the failure can be often difficult because so little information about what caused the problem is captured during the error.

Process Explorer is a freeware task manager and system monitor for Microsoft Windows created by SysInternals, which has been acquired by Microsoft and re-branded as Windows Sysinternals. It provides the functionality of Windows Task Manager along with a rich set of features for collecting information about processes running on the user's system. It can be used as the first step in debugging software or system problems.
Process Monitor is a tool from Windows Sysinternals, part of the Microsoft TechNet website. The tool monitors and displays in real-time all file system activity on a Microsoft Windows or Unix-like operating system. It combines two older tools, FileMon and RegMon and is used in system administration, computer forensics, and application debugging.
perf is a performance analyzing tool in Linux, available from Linux kernel version 2.6.31 in 2009. Userspace controlling utility, named perf, is accessed from the command line and provides a number of subcommands; it is capable of statistical profiling of the entire system.
Memory forensics is forensic analysis of a computer's memory dump. Its primary application is investigation of advanced computer attacks which are stealthy enough to avoid leaving data on the computer's hard drive. Consequently, the memory (RAM) must be analyzed for forensic information.
Docker is a set of platform as a service (PaaS) products that use OS-level virtualization to deliver software in packages called containers. The service has both free and premium tiers. The software that hosts the containers is called Docker Engine. It was first started in 2013 and is developed by Docker, Inc.
CodeXL was an open-source software development tool suite which included a GPU debugger, a GPU profiler, a CPU profiler, Graphics frame analyzer and a static shader/kernel analyzer.

Windows Subsystem for Linux (WSL) is a compatibility layer for running Linux binary executables natively on Windows 10, Windows 11, Windows Server 2019 and Windows Server 2022.
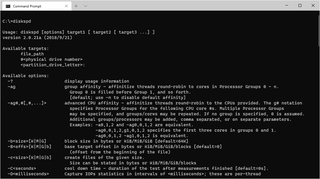
DiskSpd is a free and open-source command-line tool for storage benchmarking on Microsoft Windows that generates a variety of requests against computer files, partitions or storage devices and presents collected statistics as text in the command-line interface or as an XML file.
Microsoft, a technology company historically known for its opposition to the open source software paradigm, turned to embrace the approach in the 2010s. From the 1970s through 2000s under CEOs Bill Gates and Steve Ballmer, Microsoft viewed the community creation and sharing of communal code, later to be known as free and open source software, as a threat to its business, and both executives spoke negatively against it. In the 2010s, as the industry turned towards cloud, embedded, and mobile computing—technologies powered by open source advances—CEO Satya Nadella led Microsoft towards open source adoption although Microsoft's traditional Windows business continued to grow throughout this period generating revenues of 26.8 billion in the third quarter of 2018, while Microsoft's Azure cloud revenues nearly doubled.
Microsoft Detours is an open source library for intercepting, monitoring and instrumenting binary functions on Microsoft Windows. It is developed by Microsoft and is most commonly used to intercept Win32 API calls within Windows applications. Detours makes it possible to add debugging instrumentation and to attach arbitrary DLLs to any existing Win32 binary. Detours does not require other software frameworks as a dependency and works on ARM, x86, x64, and IA-64 systems. The interception code is applied dynamically at execution time.
OneFuzz is a cross-platform free and open source fuzz testing framework by Microsoft. The software enables continuous developer-driven fuzz testing to identify weaknesses in computer software prior to release.
LPAR2RRD is an open-source software tool that is used for monitoring and reporting performance of servers, clouds and databases. It is developed by the Czech company XoruX.
