Ireland is a parliamentary, representative democratic republic and a member state of the European Union. While the head of state is the popularly elected President of Ireland, it is a largely ceremonial position, with real political power being vested in the Taoiseach, who is nominated by the Dáil and is the head of the government.
Sinn Féin is an Irish republican and democratic socialist political party active in both the Republic of Ireland and Northern Ireland.
The Second Dáil was Dáil Éireann as it convened from 16 August 1921 until 8 June 1922. From 1919 to 1922, Dáil Éireann was the revolutionary parliament of the self-proclaimed Irish Republic. The Second Dáil consisted of members elected at the 1921 elections, but with only members of Sinn Féin taking their seats. On 7 January 1922, it ratified the Anglo-Irish Treaty by 64 votes to 57 which ended the War of Independence and led to the establishment of the Irish Free State on 6 December 1922.
The Workers' Party is an Irish republican, Marxist–Leninist communist party active in both the Republic of Ireland and Northern Ireland.

Republican Sinn Féin or RSF is an Irish republican political party in Ireland. RSF claims to be heirs of the Sinn Féin party founded in 1905; the party took its present form in 1986 following a split in Sinn Féin. RSF members take seats when elected to local government in the Republic of Ireland, but do not recognise the validity of the Partition of Ireland. It subsequently does not recognise the legitimacy of the parliaments of Northern Ireland (Stormont) or the Republic of Ireland, so the party does not register itself with them.

Mary Louise McDonald is an Irish politician who has served as Leader of the Opposition in Ireland since June 2020, as President of Sinn Féin since February 2018, and as a Teachta Dála (TD) for the Dublin Central constituency since 2011. She previously served as vice president of Sinn Féin from 2009 to 2018 and as a Member of the European Parliament (MEP) for the Dublin constituency from 2004 to 2009.

Joe Sherlock was an Irish Labour Party politician who served as a Teachta Dála (TD) from 2002 to 2007, 1987 to 1992 and 1981 to 1982. He was a Senator for the Labour Panel from 1993 to 1997.
Michael McCarthy is an Irish former Labour Party politician who served as a Teachta Dála (TD) for the Cork South-West constituency from 2011 to 2016. He was a Senator for the Labour Panel from 2002 to 2011 and as a local councillor on Cork County Council from 1999 to 2003.

Desmond Ellis is an Irish Sinn Féin politician who has been a Teachta Dála (TD) for the Dublin North-West constituency since the 2011 general election. During the 1970s and 1980s Ellis was a member of the Provisional IRA until his arrest in Ireland in 1981. Ellis subsequently fled Ireland before being recaptured in the United States and returned to Irish authorities.
Seán Sherlock is an Irish former Labour Party politician who served as a Teachta Dála (TD) for the Cork East constituency from 2007 to 2024. He served as a Minister of State from 2011 to 2016.
Chris O'Leary is an Irish Sinn Féin politician. He was formerly a Cork City Councillor and Lord Mayor of Cork. With a background in community development projects, in 2002 he was co-opted into the council to replace his Green Party colleague Dan Boyle who had been elected a TD. O'Leary left the Green Party in 2009, and was an independent councillor prior to joining Sinn Féin in 2010. He became Lord Mayor of Cork in June 2015, in the second year of a D'Hondt method rotation agreed for the office in 2014. He was Lord Mayor of Cork from June 2015 to June 2016, when he was replaced by Fine Gael politician Des Cahill. In the 2019 Irish local elections, O'Leary was not reelected, one of two Sinn Féin councillors to lose seats on Cork City Council.
The boundary between Cork city and County Cork, under the local jurisdiction of Cork City Council and Cork County Council respectively, was changed in mid 2019 when the Local Government Act 2018 came into force after the 2019 local elections, with the city area quadrupling in size. Its implementation followed the Cork Local Government Review, a 2015 review by the Cork Local Government Committee which recommended merging the two councils into a single "super-council". The recommendation was unpopular within the city and in 2017, after a review, it was dropped in favour of extending the city boundary into territory of the county. This alternative was not approved by county council, which meant the Fine Gael-led government was obliged to pass an Act of the Oireachtas to effect it.

John Brady is an Irish Sinn Féin politician who has been a Teachta Dála (TD) for the Wicklow constituency since the 2016 general election. He had been a member of Wicklow County Council from 2011 to 2016 and also a member of Bray Town Council from 2004 to 2014.

Pat Buckley is an Irish Sinn Féin politician who has been a Teachta Dála (TD) for the Cork East constituency since the 2016 general election.
Elections to the Cork Corporation took place on Thursday 15 January 1920 as part of that year's Irish local elections.
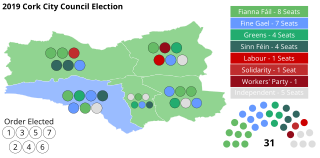
An election to all 31 seats on Cork City Council was held in Cork city in Ireland on 24 May 2019 as part of that year's local elections. Councillors were elected from five local electoral areas (LEAs) on the electoral system of proportional representation by means of the single transferable vote (PR-STV). This election coincided with an increase in the city area. Several outgoing members of Cork County Council, based in areas transferred to the city, stood for election to the city council. As well as the extension of all LEAs into the former county area, the former LEA of North Central was abolished and its area divided between North West and North East.

An election to all 55 seats on Cork County Council was held on 24 May 2019 as part of the 2019 Irish local elections. County Cork was divided into 10 local electoral areas (LEAs) to elect councillors for a five-year term of office on the electoral system of proportional representation by means of the single transferable vote (PR-STV).

The 2024 Irish general election to elect the 34th Dáil took place on Friday, 29 November 2024, following the dissolution of the 33rd Dáil on 8 November by President Michael D. Higgins at the request of Taoiseach Simon Harris. Polls were open from 7 a.m. to 10 p.m UTC. It elected 174 Teachtaí Dála (TDs) across 43 constituencies of between 3 and 5 seats to Dáil Éireann, the lower house of the Oireachtas, Ireland's legislature. Under the Electoral (Amendment) Act 2023, the number of TDs was increased from 160 to 174, with an increase in the number of constituencies from 39 to 43. The 34th Dáil will be the largest Dáil in the history of the state. The main issues in the campaign were the cost of living, housing affordability and availability, immigration and asylum management, and economic stability amid external trade uncertainties, reflecting voter concerns despite the country's strong overall financial health.

Independent Ireland is a right-wing political party in Ireland. It was formed on 8 November 2023 by former independent TDs Michael Collins and Richard O'Donoghue. Their elected representation was subsequently boosted by the joining of TD Michael Fitzmaurice, formerly an independent, and by the success of Ciaran Mullooly in winning a seat for the party in the European Parliament in the 2024 elections.
