| |||||||||||||||||||||||||||||||||||||||||||||||||||||
All 31 seats on Cork City Council | |||||||||||||||||||||||||||||||||||||||||||||||||||||
---|---|---|---|---|---|---|---|---|---|---|---|---|---|---|---|---|---|---|---|---|---|---|---|---|---|---|---|---|---|---|---|---|---|---|---|---|---|---|---|---|---|---|---|---|---|---|---|---|---|---|---|---|---|
| |||||||||||||||||||||||||||||||||||||||||||||||||||||
Map showing the area of Cork City Council |
An election to Cork City Council took place on 27 June 1991 as part of that year's Irish local elections. 31 councillors were elected from six local electoral areas (LEAs) for a five-year term of office on the electoral system of proportional representation by means of the single transferable vote (PR-STV). This term was extended twice, first to 1998, then to 1999. [1] [2]
Party | Seats | ± | First Pref. votes | FPv% | ±% | |
---|---|---|---|---|---|---|
Fianna Fáil | 9 | -4 | 13,427 | 29.0 | ||
Fine Gael | 6 | -2 | 8,684 | 18.8 | ||
Labour | 6 | +1 | 6,591 | 14.2 | ||
Workers' Party | 3 | +1 | 4,600 | 9.9 | ||
Progressive Democrats | 3 | +3 | 3,867 | 8.4 | ||
Green | 1 | +1 | 2,385 | 5.2 | ||
Independent | 3 | 0 | 5,604 | 12.1 | ||
Totals | 31 | 0 | 46,288 | 100.0 | — |
Party | Candidate | FPv% | Count | ||||||||||||
---|---|---|---|---|---|---|---|---|---|---|---|---|---|---|---|
1 | 2 | 3 | 4 | 5 | 6 | 7 | 8 | 9 | 10 | 11 | 12 | ||||
Fine Gael | Bernard Allen TD* | 17.5% | 1,291 | ||||||||||||
Labour | Joe O'Callaghan* | 13.1% | 971 | 990 | 997 | 1,020 | 1,047 | 1,063 | 1,089 | 1,110 | 1,147 | 1,205 | 1,269 | ||
Fianna Fáil | Noel O'Flynn | 12.2% | 903 | 905 | 909 | 917 | 931 | 941 | 952 | 1,058 | 1,066 | 1,089 | 1,145 | 1,246 | |
Independent | Con O'Leary | 10.9% | 802 | 812 | 817 | 830 | 856 | 886 | 927 | 940 | 961 | 1,001 | 1,061 | 1,232 | |
Fianna Fáil | Damian Wallace | 9.7% | 715 | 718 | 722 | 732 | 742 | 767 | 781 | 865 | 874 | 907 | 983 | 1,048 | |
Independent | Donie O'Leary | 5.2% | 381 | 386 | 388 | 398 | 421 | 438 | 466 | 474 | 489 | 511 | 554 | ||
Workers' Party | Denis Leahy | 4.7% | 344 | 358 | 360 | 375 | 387 | 395 | 437 | 444 | 633 | 647 | 694 | 750 | |
Progressive Democrats | Dave Buckley | 4.5% | 334 | 336 | 341 | 351 | 359 | 382 | 398 | 424 | 437 | 480 | |||
Fianna Fáil | Paud Black* | 3.9% | 285 | 285 | 288 | 291 | 295 | 314 | 319 | ||||||
Fine Gael | Maebh Sheehan | 3.6% | 263 | 265 | 286 | 299 | 307 | 322 | 332 | 341 | 348 | ||||
Workers' Party | Colette Harris | 3.3% | 247 | 257 | 258 | 282 | 287 | 293 | 321 | 326 | |||||
Sinn Féin | Don O'Leary | 3.3% | 242 | 253 | 254 | 261 | 275 | 278 | |||||||
Independent | Declan Kelly | 2.4% | 180 | 182 | 183 | 193 | 203 | ||||||||
Independent | Bernie Murphy* | 2.3% | 169 | 177 | 178 | 188 | |||||||||
Green | Brendan Burke | 2.2% | 161 | 165 | 167 | ||||||||||
Independent | Pat Maloney | 1.3% | 98 | ||||||||||||
Electorate: 13,853 Valid: 7,386 (53.3%) Spoilt: 116 Quota: 1,232 Turnout: 7,502 (54.2%) |
Party | Candidate | FPv% | Count | ||||||||
---|---|---|---|---|---|---|---|---|---|---|---|
1 | 2 | 3 | 4 | 5 | 6 | 7 | 8 | ||||
Workers' Party | John Kelleher* | 17.3% | 1,045 | ||||||||
Progressive Democrats | Mairin Quill TD* | 15.9% | 961 | 965 | 969 | 1,005 | 1,059 | ||||
Labour | Frank Nash* | 13.3% | 803 | 812 | 825 | 870 | 899 | 950 | 959 | 1,081 | |
Fine Gael | Liam Burke * | 11.8% | 711 | 712 | 715 | 799 | 820 | 1,011 | |||
Fianna Fáil | Tim Brosnan* | 10.8% | 654 | 656 | 658 | 672 | 758 | 790 | 801 | 1,069 | |
Green | Donogh McCarthy-Morrogh | 7.9% | 478 | 500 | 509 | 526 | 538 | 582 | 591 | 623 | |
Fianna Fáil | Pat McRory | 7.1% | 429 | 429 | 431 | 456 | 529 | 545 | 553 | ||
Fianna Fáil | Brid Houlihan | 5.1% | 306 | 307 | 310 | 316 | |||||
Fine Gael | Betty McGee | 5% | 304 | 306 | 307 | 371 | 379 | ||||
Fine Gael | Tadhg McAuliffe | 4.9% | 297 | 297 | 299 | ||||||
Independent | James Howe | 0.8% | 46 | ||||||||
Electorate: 12,462 Valid: 6,034 (48.4%) Spoilt: 164 Quota: 1,006 Turnout: 6,198 (49.7%) |
Party | Candidate | FPv% | Count | ||||||||||
---|---|---|---|---|---|---|---|---|---|---|---|---|---|
1 | 2 | 3 | 4 | 5 | 6 | 7 | 8 | 9 | 10 | ||||
Labour | Gerry O'Sullivan TD* | 17.3% | 1,253 | ||||||||||
Fianna Fáil | Dan Wallace TD* | 16.5% | 1,198 | 1,202 | 1,209 | ||||||||
Workers' Party | Jimmy Homan | 14.6% | 1,058 | 1,064 | 1,076 | 1,080 | 1,088 | 1,145 | 1,165 | 1,332 | |||
Fianna Fáil | Dave McCarthy* | 11.3% | 821 | 826 | 829 | 835 | 838 | 868 | 898 | 978 | 1,024 | 1,047 | |
Fianna Fáil | Tim Falvey* | 10.1% | 735 | 738 | 744 | 748 | 765 | 778 | 839 | 877 | 925 | 945 | |
Fine Gael | Michael O'Leary | 6% | 437 | 439 | 443 | 526 | 693 | 732 | 858 | 872 | 960 | 972 | |
Sinn Féin | Thomas Flynn | 5.3% | 384 | 385 | 389 | 390 | 391 | 406 | 412 | ||||
Labour | Pat Magner | 4.6% | 334 | 352 | 362 | 365 | 376 | 431 | 474 | 509 | |||
Progressive Democrats | Jack Coughlan | 4.1% | 297 | 298 | 301 | 312 | 333 | 375 | |||||
Green | John T. O'Sullivan | 3.9% | 279 | 281 | 287 | 305 | 314 | ||||||
Fine Gael | Pat Hickey | 2.9% | 215 | 216 | 216 | 254 | |||||||
Fine Gael | David Riordan | 2.3% | 170 | 171 | 173 | ||||||||
Independent | Philip Murray | 0.87% | 63 | 64 | |||||||||
Electorate: 14,357 Valid: 7,244 (43.2%) Spoilt: 106 Quota: 1,208 Turnout: 7,350 (43.91%) |
Party | Candidate | FPv% | Count | |||||||||
---|---|---|---|---|---|---|---|---|---|---|---|---|
1 | 2 | 3 | 4 | 5 | 6 | 7 | 8 | 9 | ||||
Fianna Fáil | Micheál Martin TD* | 24.2% | 1,746 | |||||||||
Workers' Party | Kathleen Lynch * | 15.7% | 1,136 | 1,197 | 1,203 | |||||||
Labour | John Murray* | 13.2% | 955 | 988 | 990 | 1,012 | 1,054 | 1,119 | 1,135 | 1,170 | 1,290 | |
Fianna Fáil | Tom O'Driscoll | 8.1% | 581 | 799 | 801 | 825 | 845 | 863 | 1,085 | 1,111 | 1,165 | |
Fine Gael | Denis Cregan * | 8.1% | 581 | 621 | 625 | 657 | 685 | 713 | 732 | 982 | 1,067 | |
Labour | Pat Dawson | 7.3% | 523 | 549 | 550 | 568 | 606 | 627 | 650 | 671 | 790 | |
Independent | Con O'Connell | 6% | 434 | 447 | 447 | 467 | 500 | 612 | 625 | 648 | ||
Fine Gael | Fidelma Collins | 4.5% | 328 | 344 | 346 | 371 | 379 | 391 | 408 | |||
Independent | Damien McSweeney | 3.7% | 268 | 285 | 287 | 304 | 333 | |||||
Independent | Bernie Kennedy | 3% | 222 | 230 | 239 | 248 | ||||||
Fianna Fáil | Hannah Carrington | 3% | 221 | 316 | 316 | 326 | 343 | 354 | ||||
Progressive Democrats | Noel Walsh | 2.7% | 192 | 205 | 205 | |||||||
Independent | A.J. Cotter | 0.4% | 26 | 29 | ||||||||
Electorate: 12,765 Valid: 7,213 (56.5%) Spoilt: 122 Quota: 1,203 Turnout: 7,335 (57.5%) |
Party | Candidate | FPv% | Count | ||||||||||||
---|---|---|---|---|---|---|---|---|---|---|---|---|---|---|---|
1 | 2 | 3 | 4 | 5 | 6 | 7 | 8 | 9 | 10 | 11 | 12 | ||||
Fine Gael | Jim Corr * | 12.97% | 1,315 | 1,351 | 1,353 | 1,369 | 1,376 | 1,528 | |||||||
Progressive Democrats | Pearse Wyse TD* | 12.1% | 1,222 | 1,233 | 1,236 | 1,266 | 1,283 | 1,311 | 1,318 | 1,331 | 1,425 | 1,473 | |||
Fianna Fáil | Chrissie Aherne* | 10.1% | 1,027 | 1,041 | 1,050 | 1,091 | 1,177 | 1,190 | 1,194 | 1,221 | 1,246 | 1,299 | 1,331 | 1,409 | |
Green | Dan Boyle | 9.8% | 989 | 994 | 1,002 | 1,023 | 1,039 | 1,054 | 1,057 | 1,127 | 1,182 | 1,255 | 1,388 | 1,518 | |
Independent | Sean Beausang* | 9.1% | 923 | 929 | 965 | 970 | 988 | 1,010 | 1,015 | 1,042 | 1,097 | 1,185 | 1,280 | 1,486 | |
Fianna Fáil | Donal Counihan* | 7.3% | 743 | 746 | 747 | 779 | 838 | 846 | 849 | 860 | 883 | 905 | 918 | 1,012 | |
Labour | Joe O'Flynn | 7.1% | 723 | 734 | 755 | 765 | 783 | 796 | 798 | 821 | 853 | 895 | 1,049 | 1,168 | |
Independent | Ted McCarthy* | 6.2% | 628 | 634 | 643 | 647 | 654 | 662 | 666 | 684 | 743 | 802 | 838 | ||
Workers' Party | Sean McCarthy | 4.4% | 442 | 445 | 459 | 466 | 479 | 481 | 481 | 530 | 550 | 576 | |||
Independent | Rose White | 3.4% | 348 | 359 | 359 | 400 | 427 | 437 | 440 | 493 | 511 | ||||
Fine Gael | Frank Heffernan | 3.3% | 338 | 354 | 355 | 355 | 355 | 411 | 459 | 465 | |||||
Sinn Féin | Liam Burke | 3.3% | 333 | 350 | 351 | 361 | 361 | 361 | |||||||
Fine Gael | Jean McNicholl-Murphy | 2.9% | 295 | 328 | 331 | 331 | 332 | ||||||||
Fianna Fáil | Maurice MacCarthy | 2.4% | 240 | 244 | 267 | 298 | |||||||||
Fianna Fáil | Denis O'Brien | 2% | 203 | 205 | 206 | ||||||||||
Independent | Paddy Dennehy | 1.96% | 199 | 203 | |||||||||||
Fine Gael | Marie O'Sullivan | 1.7% | 172 | ||||||||||||
Electorate: 20,320 Valid: 10,140 (49.9%) Spoilt: 83 Quota: 1,449 Turnout: 10,223 (50.3%) |
Party | Candidate | FPv% | Count | ||||||||
---|---|---|---|---|---|---|---|---|---|---|---|
1 | 2 | 3 | 4 | 5 | 6 | 7 | 8 | ||||
Fianna Fáil | John Dennehy TD* | 20.1% | 1,662 | ||||||||
Labour | Toddy O'Sullivan TD* | 12.4% | 1,029 | 1,075 | 1,102 | 1,232 | 1,248 | 1,386 | |||
Fine Gael | P.J. Hourican | 11.2% | 925 | 936 | 938 | 946 | 978 | 1,036 | 1,080 | 1,520 | |
Progressive Democrats | Brian Bermingham * | 10.4% | 861 | 885 | 887 | 908 | 948 | 985 | 1,111 | 1,269 | |
Independent | Patrick Murray* | 9.9% | 817 | 830 | 860 | 934 | 957 | 992 | 1,221 | 1,328 | |
Fine Gael | Kenneth White | 8% | 658 | 662 | 665 | 672 | 685 | 765 | 824 | ||
Fianna Fáil | Jerry Long | 7.9% | 652 | 703 | 719 | 732 | 981 | 1,001 | 1,044 | 1,067 | |
Green | Jillian Delaney | 5.8% | 478 | 488 | 522 | 581 | 602 | 624 | |||
Fine Gael | Dan Morrissey | 4.6% | 384 | 406 | 413 | 432 | 435 | ||||
Workers' Party | Gerry McCarthy | 4% | 328 | 333 | 367 | ||||||
Fianna Fáil | Sean Hennigan | 3.7% | 306 | 397 | 406 | 408 | |||||
Sinn Féin | James McBarron | 2% | 171 | 177 | |||||||
Electorate: 16,790 Valid: 8,271 (49.3%) Spoilt: 90 Quota: 1,371 Turnout: 8,361 (49.8%) |
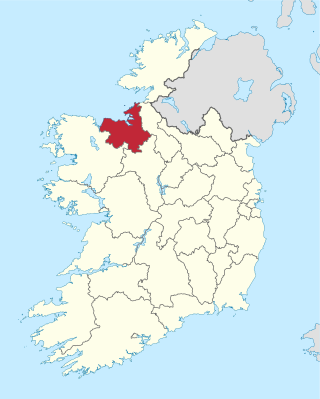
An election to Sligo County Council took place on 27 June 1991 as part of that year's Irish local elections. 25 councillors were elected from five local electoral areas (LEAs) for a five-year term of office on the electoral system of proportional representation by means of the single transferable vote (PR-STV). This term was extended twice, first to 1998, then to 1999.
An election to Leitrim County Council took place on 27 June 1991 as part of that year's Irish local elections. 22 councillors were elected from four local electoral areas (LEAs) for a five-year term of office on the electoral system of proportional representation by means of the single transferable vote (PR-STV). This term was extended twice, first to 1998, then to 1999.
An election to Roscommon County Council took place on 27 June 1991 as part of that year's Irish local elections. 26 councillors were elected from six local electoral areas (LEAs) for a five-year term of office on the electoral system of proportional representation by means of the single transferable vote (PR-STV). This term was extended twice, first to 1998, then to 1999.
An election to Galway County Council took place on 27 June 1991 as part of that year's Irish local elections. 30 councillors were elected from five local electoral areas (LEAs) for a five-year term of office on the electoral system of proportional representation by means of the single transferable vote (PR-STV). This term was extended twice, first to 1998, then to 1999.
An election to Mayo County Council took place on 27 June 1991 as part of that year's Irish local elections. 31 councillors were elected from seven local electoral areas (LEAs) for a five-year term of office on the electoral system of proportional representation by means of the single transferable vote (PR-STV). This term was extended twice, first to 1998, then to 1999.
An election to Monaghan County Council took place on 27 June 1991 as part of that year's Irish local elections. 20 councillors were elected from four local electoral areas (LEAs) for a five-year term of office on the electoral system of proportional representation by means of the single transferable vote (PR-STV). This term was extended twice, first to 1998, then to 1999.
An election to Clare County Council took place on 27 June 1991 as part of that year's Irish local elections. 32 councillors were elected from six local electoral areas (LEAs) for a five-year term of office on the electoral system of proportional representation by means of the single transferable vote (PR-STV). This term was extended twice, first to 1998, then to 1999.
An election to Limerick County Council took place on 27 June 1991 as part of that year's Irish local elections. 28 councillors were elected from five local electoral areas (LEAs) for a five-year term of office on the electoral system of proportional representation by means of the single transferable vote (PR-STV). This term was extended twice, first to 1998, then to 1999.
An election to Limerick City Council took place on 27 June 1991 as part of that year's Irish local elections. 17 councillors were elected from four local electoral areas (LEAs) for a five-year term of office on the electoral system of proportional representation by means of the single transferable vote (PR-STV). This term was extended twice, first to 1998, then to 1999.
An election to Offaly County Council took place on 27 June 1991 as part of that year's Irish local elections. 21 councillors were elected from five local electoral areas (LEAs) for a five-year term of office on the electoral system of proportional representation by means of the single transferable vote (PR-STV). This term was extended twice, first to 1998, then to 1999.
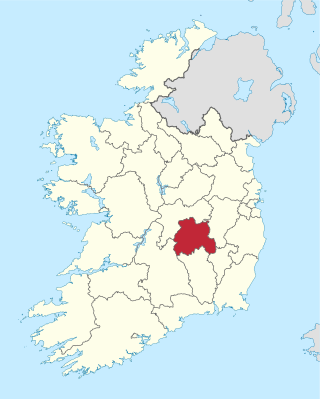
An election to Laois County Council took place on 27 June 1991 as part of that year's Irish local elections. 25 councillors were elected from five local electoral areas (LEAs) for a five-year term of office on the electoral system of proportional representation by means of the single transferable vote (PR-STV). This term was extended twice, first to 1998, then to 1999.
An election to Westmeath County Council took place on 27 June 1991 as part of that year's Irish local elections. 23 councillors were elected from five local electoral areas (LEAs) for a five-year term of office on the electoral system of proportional representation by means of the single transferable vote (PR-STV). This term was extended twice, first to 1998, then to 1999.
An election to Kildare County Council took place on 27 June 1991 as part of that year's Irish local elections. 25 councillors were elected from six local electoral areas (LEAs) for a five-year term of office on the electoral system of proportional representation by means of the single transferable vote (PR-STV). This term was extended twice, first to 1998, then to 1999.
An election to Carlow County Council took place on 27 June 1991 as part of that year's Irish local elections. 21 councillors were elected from four local electoral areas (LEAs) for a five-year term of office on the electoral system of proportional representation by means of the single transferable vote (PR-STV). This term was extended twice, first to 1998, then to 1999.
An election to Kilkenny County Council took place on 27 June 1991 as part of that year's Irish local elections. 26 councillors were elected from five local electoral areas (LEAs) for a five-year term of office on the electoral system of proportional representation by means of the single transferable vote (PR-STV). This term was extended twice, first to 1998, then to 1999.
An election to North Tipperary County Council took place on 27 June 1991 as part of that year's Irish local elections. 21 councillors were elected from four local electoral areas (LEAs) for a five-year term of office on the electoral system of proportional representation by means of the single transferable vote (PR-STV). This term was extended twice, first to 1998, then to 1999.
An election to Dublin County Council in the electoral county of Dún Laoghaire–Rathdown within Dublin County took place on 27 June 1991 as part of that year's Irish local elections. 28 councillors were elected from 7 local electoral areas on the system of proportional representation by means of the single transferable vote for a five-year term of office. It was one of three electoral counties within Dublin County at this election, the others being Fingal and South Dublin.
An election to the council of the electoral county of South Dublin within Dublin County to Dublin County Council took place on 27 June 1991 as part of that year's Irish local elections. 26 councillors were elected for a five-year term of office from five local electoral areas on the system of proportional representation by means of the single transferable vote. It was one of three electoral counties within Dublin County at this election, the others being Fingal and Dún Laoghaire–Rathdown. The term was extended twice, first to 1998, then to 1999.
| label6 = Reporting | data6 = as of {{{last_update}}} {{{time_zone}}} }}
An election to Dublin County Council took place on 27 June 1991 as part of that year's Irish local elections. Councillors were elected for a five-year term of office from local electoral areas (LEAs) on the system of proportional representation by means of the single transferable vote (PR-STV). It was the last election held for Dublin County Council.